
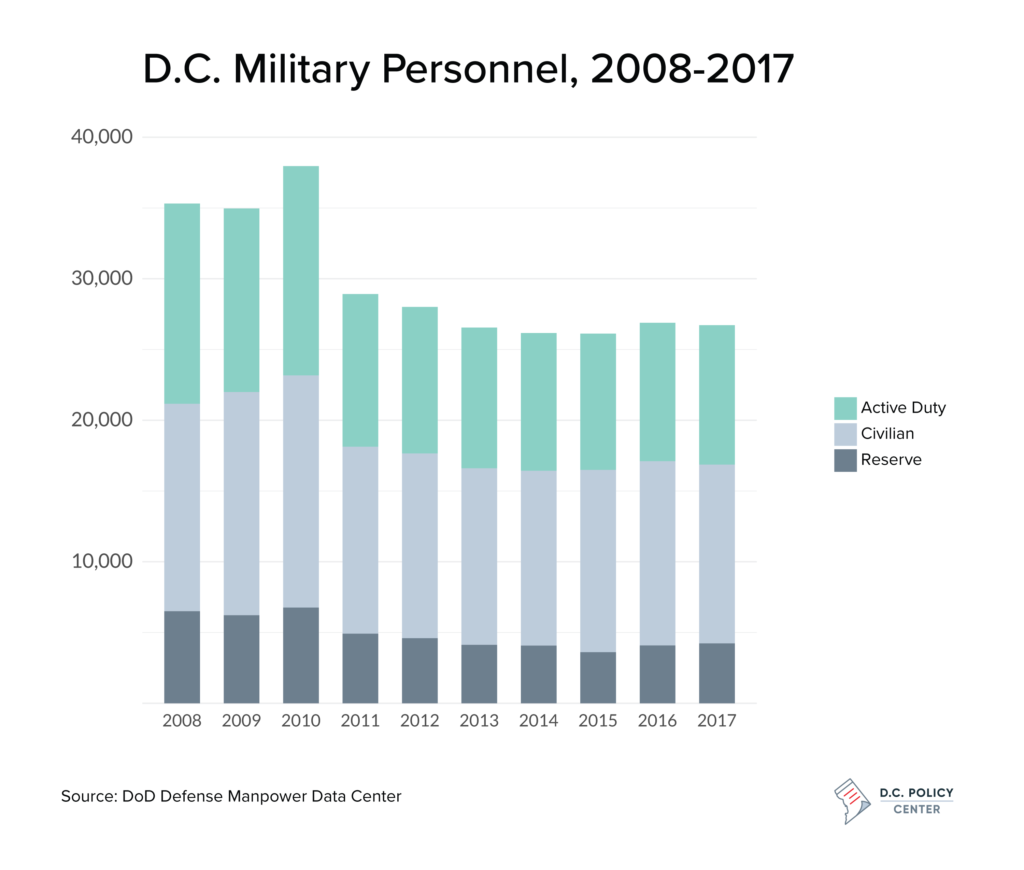
Defense spending and employment play a key role in the role in D.C.’s local economy, as well as the broader metropolitan region. Nearly 27,000 active duty, reserve and civilian personnel were based in D.C. as of late last year, according to Department of Defense (DoD) figures. The federal government also typically awards another $4 billion to $ 5 billion in contracts to local firms, supporting thousands more workers.
Those numbers could climb in the coming years as Congress and the Trump administration have prioritized ramping up defense spending. The Pentagon’s fiscal year 2019 budget proposal calls for a roughly $74 billion increase, with 25,900 additional troops nationwide, growing to 56,600 by 2023.
Given its importance to the District’s employment base, this article will consider how the military’s presence has changed in recent years and how it compares to other parts of the country.
Active Duty
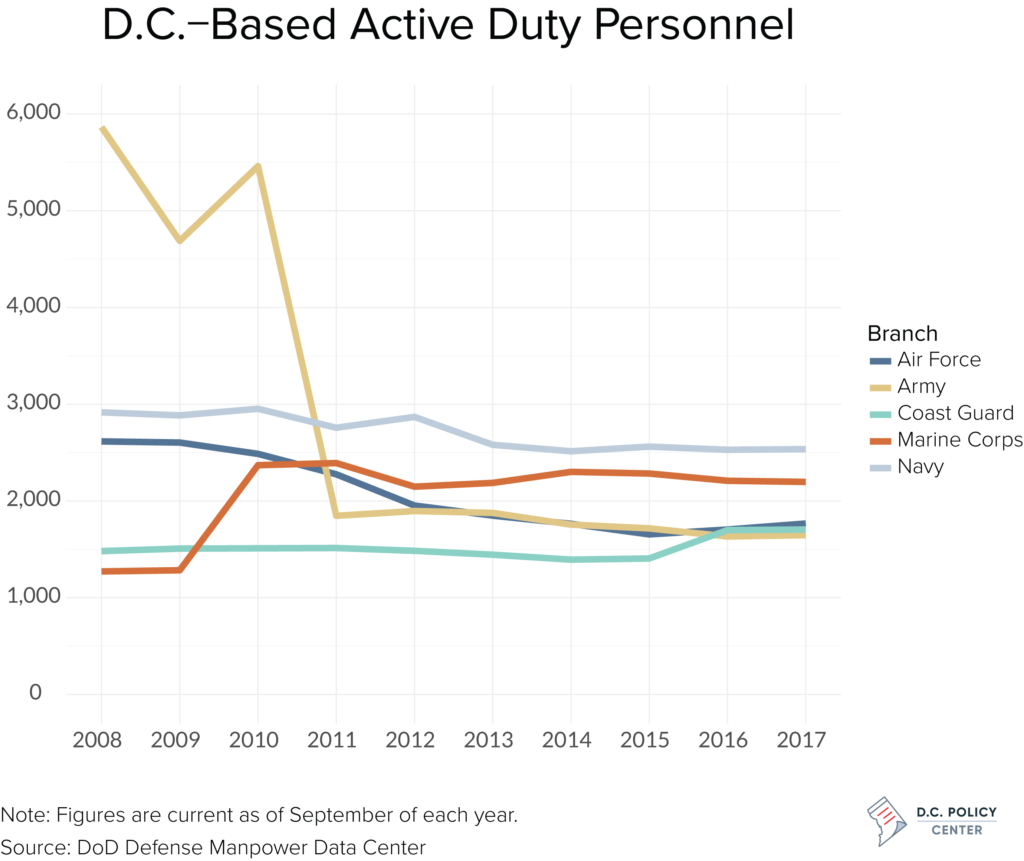
Just under 10,000 active duty service members were stationed in the District as of September 2017.
Over the last four years of the Obama administration, the tally remained relatively flat. It’s down sharply by about 5,000, however, from its most recent peak in 2010. That’s mostly a result of the closure of the massive Walter Reed Army Medical Center in northwest Washington in 2011. The facility merged with the then-National Naval Medical Center to form what’s now the Walter Reed National Military Medical Center in Bethesda.
D.C.-based Air Force active duty personnel have seen their numbers slowly decline over the decade as well. Totals for the Coast Guard, Marine Corps and Navy have fluctuated little in recent years.
Separately, reserve forces account for a much smaller segment of the labor force – about 4,200 last year.
Military Civilians
Civilians make up about half – approximately 12,600 – of military personnel based in D.C. The bulk of these employees work at Washington Navy Yard, which underwent years of expansion and renovations. The Navy’s civilian headcount dipped by a few hundred last year, but it has mostly grown over the long term.
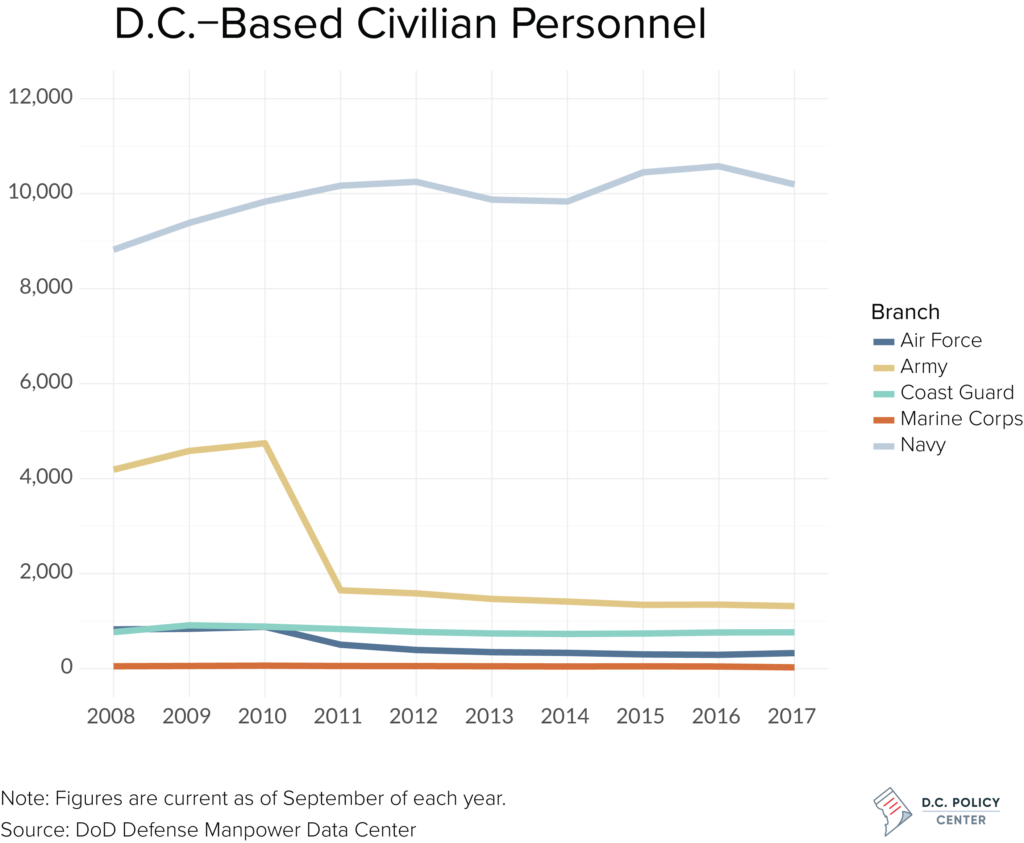
The District’s next-largest military installations are Joint Base Anacostia-Bolling and Fort McNair. The largest annual drop in overall civilian employment came in 2010-11, also due to the closure of the Walter Reed campus.
How D.C. compares to state economies
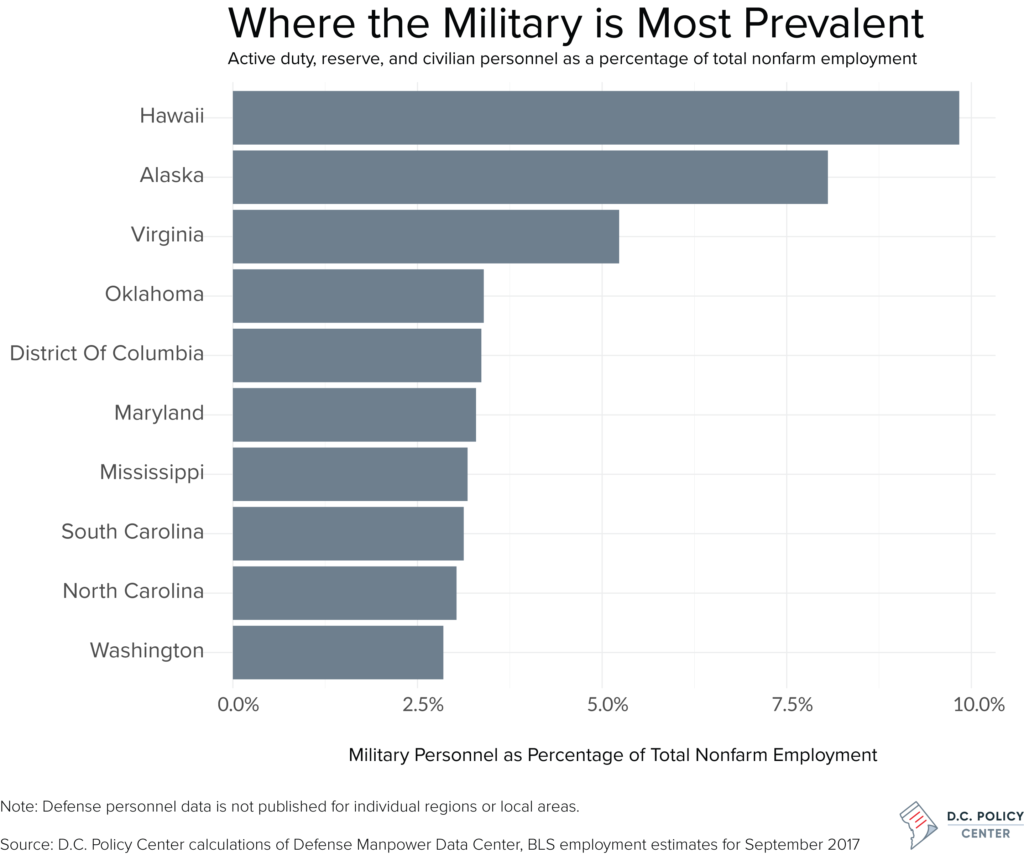
Although the military maintains a sizable presence here, it’s not quite as large as it is in a few states, such as Hawaii, Alaska, and Virginia. As a share of total employment, all active duty, civilian and a small number of reserve personnel accounted for 3.4 percent of total employment as of September—although it’s worth noting that many of these workers don’t live in the District. D.C.’s military employment is on par with Maryland (3.3 percent) and Oklahoma (3.4 percent). Nationally, active duty, reserve and civilian personnel across all branches of the military account for less than 2 percent of U.S. employment.
Virginia’s economy remains very closely tied to the military, as has historically been the case; in addition to the Pentagon, other major military employment hubs include Fort Belvoir in Fairfax County, Marine Corps Base Quantico and Virginia Beach’s Naval Station Norfolk. However, the state’s DoD contracts and active duty personnel have both slowly dwindled over the past several years, according to a report by the Center for Economic Analysis and Policy at Old Dominion University.
For a broader view of the military’s economic impact, DoD’s Office of Economic Adjustment published a report assessing fiscal 2015 defense spending (the most recent year of data available). Payroll for D.C.-based personnel amounted to $2.3 billion, along with another $4.5 billion in awarded contracts. This adds up to 5.7 percent of the District’s GDP – higher than all but five states. The DoD analysis reported defense spending was responsible for 5.7 percent of Maryland’s GDP, and 11.2 percent for Virginia.[1]
About the data
Data on D.C. military personnel over time, including active duty and civilian personnel by military branch, was obtained from the DoD Defense Manpower Data Center and is current as of last September.
Data on the prevalence of the military in different states uses military personnel data from the DoD Defense Manpower Data Center and BLS employment estimates of total nonfarm employment for September of each year.
Notes
[1] The presence of the military means that the federal government has an even larger footprint when looking at metropolitan areas. Richard Florida has written that the direct and indirect federal government employment accounts for 43 percent of jobs in the Honolulu metropolitan area and 42 percent of jobs in the Virginia Beach area, compared with 36 percent of jobs in the D.C. metropolitan area.
Feature photo of the WRAMC Bldg 1. (1910) from WRAMC on Flickr.
D.C. Policy Center Fellow Mike Maciag crunches numbers and writes for Governing magazine on a variety of policy issues relating to state and local governments. He holds a master’s degree in public administration from George Mason University and undergraduate degrees in journalism and computer science from the University of Dayton. Follow him on Twitter at @mikemaciag.