
State of D.C. Schools is an annual systemwide overview of public education in the District of Columbia. In school year 2021-22, all students returned to in-person learning for the first time in almost two years after the COVID-19 pandemic began in spring 2020. This report examines the transition back to in-person learning, measuring outcomes for the first time since the start of the pandemic, and beginning work on recovery. This version of the report has been adapted for web. You may also access the original PDF version.
Quick links
Other reports in this series
Acknowledgements
This report was prepared with generous support from Education Forward DC. The report also benefited from comments provided by the staff of DCPS, DME, DC SBOE, Office of the Student Advocate, and Office of the Ombudsman for Public Education. Their review in no way indicates an endorsement of this report, and all errors are the responsibility of the D.C. Policy Center authors.
Photos throughout this report have been provided by DC Public Charter School Board and by Critical Exposure, a program that trains DC youth to harness the power of photography and their own voices to fight for educational equity and social justice.
1. Introduction
School year 2021-22 marked the transition back to in-person learning at D.C.’s public schools.
At the end of the previous school year (2020-21), 79 percent of students were still fully in virtual learning. For the most part, the students who attended class in person did so three days a week or less.1 In school year 2021-22, all students—aside from a small number with medical exemptions—returned to in-person classrooms full-time.
Schools began the incredibly challenging and crucial work of recreating school culture. They had to reestablish school days structured around learning, catch students up academically, check in on students’ wellbeing, and figure out how to move forward during uncertain times.
Some COVID-19 protocols were more lenient than they had been the previous school year, and vaccines for children ages 5 to 11 were released in November of 2021. These changes eased some of the learning disruptions that COVID-19 had caused the previous year.
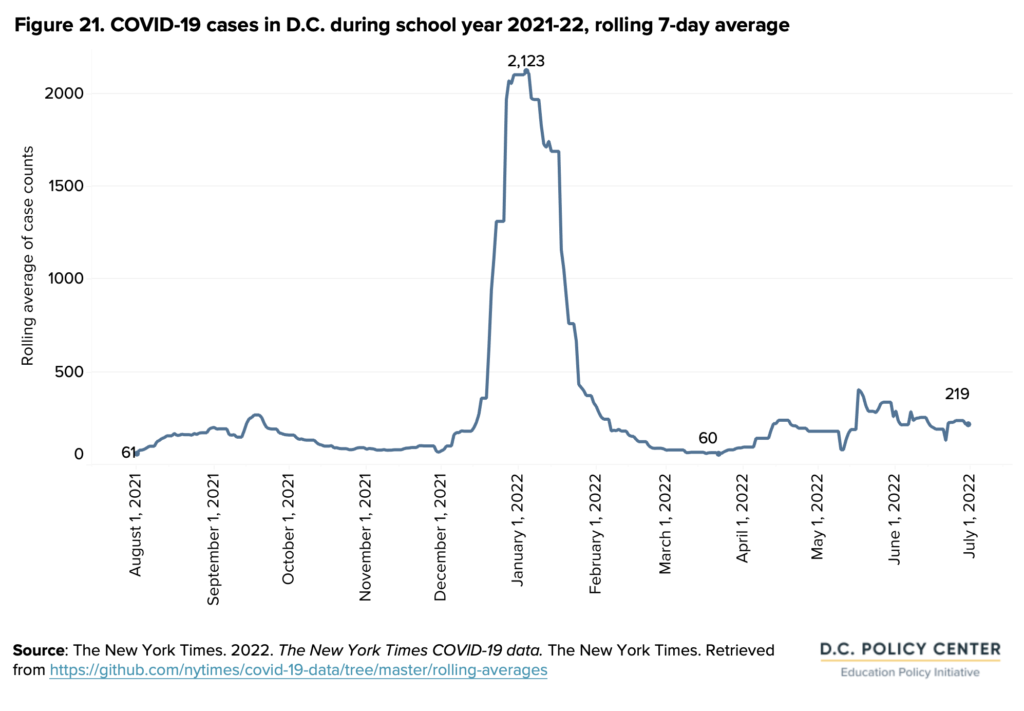
Yet, COVID-19 continued to interrupt learning throughout the school year, with varying impacts. On average, D.C. saw 317 cases of COVID-19 per day in school year 2021-22. During the winter, a spike above 2,000 cases spurred a temporary return to virtual learning.
Even with the benefits of being physically together again, school year 2021-22 was challenging. The education system faced stagnant enrollment, declining learning outcomes, staffing shortages, and more student absenteeism. But the year also marked the beginning of tremendous recovery efforts across the system: the return to in-person learning, investments in learning acceleration (including high-impact tutoring across the entire public education system), and a continued focus on student wellbeing.
This year’s State of D.C. Schools report focuses on the immense changes D.C.’s schools experienced in school year 2021-22. It looks at how recovery began to take shape. It also documents how the previous two years of virtual learning impacted the return to a more normal school day, looking at enrollment, learning outcomes, recovery strategies, and student experiences. Finally, the report provides a look forward to changes in school year 2022-23.
Executive summary
School year 2021-22 marked a critical year of transition toward recovery from the pandemic. Amidst the huge efforts to return to in-person learning, members of the school community displayed resiliency and tremendous innovation as they oriented toward recovery. A group of school leaders interviewed for this report lauded these efforts by staff, families, and students to make in-person learning work, and their perceptions are mentioned throughout this overview.
Federal Elementary and Secondary School Emergency Relief (ESSER) funds were key in allowing school leaders to address challenges related to COVID-19. School leaders described how this funding helped them institute new programs, including new and expanded mental health initiatives and more flexibility for students and staff.
Despite school communities’ efforts and federal funds, school year 2021-22 was immensely difficult and involved many challenges. School leaders navigated evolving COVID-19 protocols. Student attendance and academic outcomes declined. Students and teachers experienced mental health challenges, and schools operated with daily staffing shortages.
School year 2021-22 represented a huge shift toward recovery. But COVID-19 still impacted day-to-day operations.
Schools were resilient during the return to in-person learning. In school year 2021-22, all students (aside from a small number with medical exemptions) were expected to return for in-person learning—compared to 21 percent who experienced any regular in-person learning the previous school year.
Returning in-person represented huge efforts on the part of schools to make in-person learning as safe and joyful as possible. Parents and students also worked hard to reengage with schools and rebuild trust. Being together allowed some of this community-building to begin. It also made it easier to check on students and know how they were doing, both academically and emotionally.
Many school leaders shared that despite the difficulties, having students back in-person was a big step toward normalcy. All school leaders shared that the previous year of virtual learning had been challenging for students and teachers. As a result, the return to in-person learning involved a lot of healing. Schools encouraged this healing by integrating more social-emotional work into lessons, increasing mental health supports, and rebuilding relationships. Schools also introduced special academies, afterschool activities, and whole-school community building to help accelerate in-person learning.
“Our kids love learning in school. They’re really excited to be back. Kids missed out a lot from not being around peers. Teachers love the normalcy of being able to have children close together, on the carpet, in community again.”
Mekia Love
Chief of Schools, KIPP DC
Navigating changing COVID-19 protocols required many resources. COVID-19 continued to impact the 2021-22 school year: D.C. had an average of 317 COVID-19 cases per day, with a spike of 2,000 cases in the winter. When students returned to in-person learning in fall of 2021, school leaders coordinated large-scale public health initiatives. These included reorganizing spaces to help with social distancing, organizing students into cohorts, managing masking, coordinating testing, and communicating quarantines.
Throughout the school year, as the risks posed by COVID-19 changed, policies shifted, forcing school leaders to constantly navigate, adjust, and readjust their responsibilities. School leaders reported that these shifting policies occupied a large chunk of their time, leaving less time to focus on enhancing and supporting student learning. Families also expressed frustrations with changing quarantine protocols.
Federal ESSER funds were key in allowing school leaders to innovate and start new programs. Schools in D.C. have received $540 million in ESSER funds. As of fall of 2022, 23 percent of these funds had been spent, with 73 percent of resources going toward learning acceleration and smaller shares going toward safe reopening and student and staff wellbeing.
Importantly, ESSER funds allowed schools to start innovative new programs. For example, high-impact tutoring (HIT) was initiated on a District-wide scale, reaching approximately 7 percent of students in D.C. from May 2021 to December 2022. School leaders reported that HIT was received positively and that students who participated saw gains in their academic achievement as well as their confidence levels.HIT will continue: In partnership with the Office of the State Superintendent of Education (OSSE), citywide organizations such as CityTutor DC are committed to expanding HIT to more schools and more students in school year 2022-23 and beyond.
In addition to HIT, schools instituted new weekend and afterschool programming for academic enrichment activities. Many Local Education Agencies (LEAs)2 also used ESSER funds to increase compensation for teachers and mitigate burnout associated with increased or different workloads. Schools used ESSER funds in creative ways to help with COVID-19 protocols to increase trust with families and protect kids’ health. One school used funding to purchase portable classrooms to have fewer students in each classroom, for example.
Bright spots: ESSER funds for enrichment activities
Burrville Elementary School used ESSER funds to start Saturday School, a half-day program where students participated in English language arts (ELA) and math lessons, followed by enrichment activities. ESSER funding provided extra pay for teachers who participated. During its first year of implementation, school year 2021-22, students were recruited from the entire school. In its second year, two grades were targeted that had experienced higher than average quarantine rates in the previous school year.
Hart Middle School started an Acceleration Academy in the summer prior to school year 2021-22 using ESSER funds. At first, the program was framed as a way for students to reacclimate back to in-person learning with academic instruction in the morning followed by career, athletics, and arts activities in the afternoon. The academy continued to operate during the school year with weekly sessions and field trips one Saturday a month. In addition to providing enrichment for students, the program, which is organized and operated by teachers, gives teachers an opportunity to demonstrate their leadership skills.
While teacher retention rates rose, staff vacancies and absences due to COVID-19 introduced daily obstacles. In school year 2021-22, while the teacher retention rate rose to 74 percent, it was harder to hire new teachers. The vacancy rate was 6 percent in October 2021 for teaching positions,3 triple the 2 percent rate in October of 2018.4 In addition to long-term vacancies, many schools experienced staffing shortages due to short-term absences and quarantines. A citywide shortage of substitutes meant that teachers were called to cover additional classrooms, which could lead to increased risk of burnout.
Given challenges related to hiring, more absences due to COVID-19, and fewer substitutes, adequate staffing emerged as one of the major obstacles during school year 2021-22 for school leaders. Several school leaders described having to recruit substitutes and reassign instructional coaches and central staff to help when there were immense shortages. To have substitutes on hand, some LEAs described hiring in-house substitutes who were employed full-time in school buildings in case of absences.
Students were still recovering socio-emotionally and figuring out how to reengage with school.
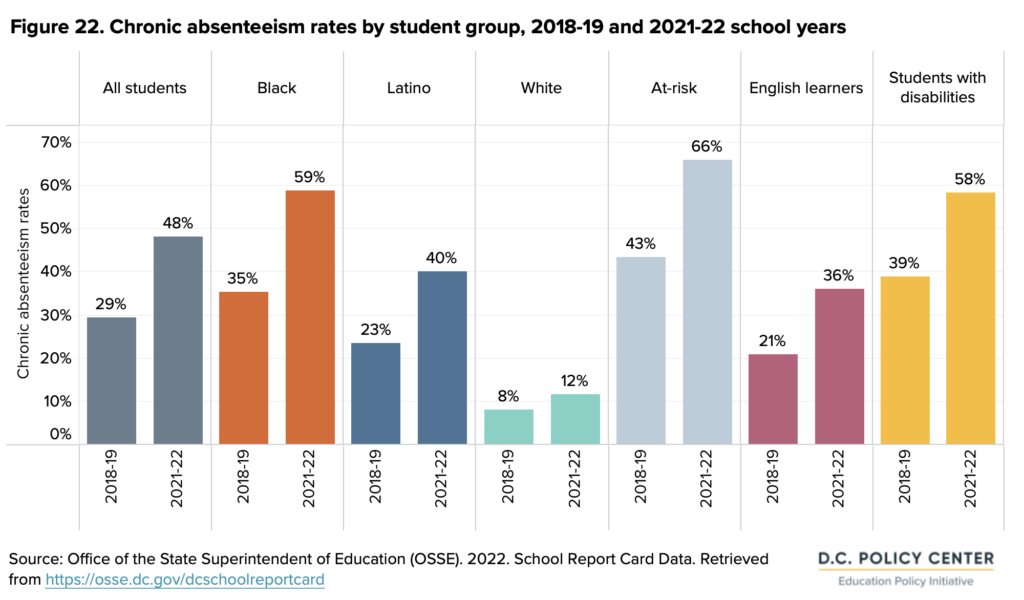
Attendance declined, as almost half of students missed 10 percent or more of the school year. During school year 2021-22, chronic absenteeism, or the percentage of students missing 10 percent or more of the school year, rose to 48 percent (up from 29 percent in school year 2018-19). This uptick was due in part to excused absences related to COVID-19 cases and quarantines, mental health issues, community violence at times, and other factors related to returning to in-person learning as families and students were reacclimating to the idea of in-person attendance every day. Lower attendance made it more challenging to reestablish school culture and move forward on academic recovery.
Interviews with school leaders indicate that attendance remains a challenge during school year 2022-23 and a priority area to improve. To encourage daily attendance, school leaders offered incentives such as celebrations or awards for those who came to school. Students who were chronically absent received more intensive intervention practices such as calls or emails to their parents. However, the readjustment back to in-person school and the many factors affecting attendance in school year 2021-22 continue to contribute to lower rates of daily attendance.
Many students struggled with mental health challenges. Mental health was a challenge for students in school year 2021-22. In a national survey of health risk behaviors, the percentage of D.C.’s high school students who reported feeling sad or hopeless increased to 36 percent in school year 2021-22, up from 33 percent in school year 2019-20.5 Mental health issues could lead to staying home from school. Contributing additional stress, community violence was more present for many students: In school year 2021-22, homicides increased by 13 percent over school year 2020-21.
While schools initiated and continued mental health practices and social-emotional learning, students are continuing to struggle even though this impact is difficult to quantify. School leaders identified trauma due to loss of family members from COVID-19, a lack of social interaction during virtual learning, and proximity to community violence as factors that increased mental health challenges, as well as associated behavioral challenges. At a Mikva Challenge6 Student Soapbox event in December 2022, students identified mental health and the stigma students feel when they seek help as one of the most important issues presented.
Strategies to promote student and staff wellbeing
This school year, District of Columbia Public Schools (DCPS) started a new Youth Mental Health Ambassador program across all high schools. This is a peer led intervention where student ambassadors host programs and receive training with the goal of reducing the stigma associated with seeking help for mental health concerns.
LEAs provided training related to grief and recognizing trauma. Digital resources were made available, including the DC Educator Wellness Center, a series of digital mental health modules developed by OSSE.7
Some LEAs supported educators’ own mental health more directly through weekly yoga or meditation sessions, free counseling sessions, access to a mental health professional onsite for support, gym memberships, and access to mental health apps.
Several school leaders identified the need for increased flexibility as a response to burnout. Several LEAs scheduled wellness days for educators, or days with reduced instruction where teachers attend professional development sessions or get time to catch up on other work. Several schools changed their year schedule to have longer breaks.
Outcomes show recovery is not yet complete.
Even with the successes of returning to in-person learning and innovation around recovery, there is still a clear need for renewed efforts and investments in the years to come.
On state assessments, the percentage of students who met or exceeded expectations in English language arts (ELA) dropped from 37 to 31; in math, it dropped from 31 to 19. For students designated as at-risk, the percentage of students who met or exceeded expectations in ELA dropped from 21 to 15; in math, it dropped from 16 to 6.
Importantly, although graduation rates are up, postsecondary completions are down. In school year 2021-22, 75 percent of students graduated from high school in four years, compared to 73 percent in the previous year. It is estimated that out of every 100 ninth graders, eight will now complete postsecondary within six years of high school graduation compared to 14 pre-pandemic.
School leaders emphasized their commitment to supporting learning acceleration initiatives including high-impact tutoring. Most school leaders expressed relief that the year of transition was over as well as excitement about possibilities for growth coming out of school year 2021-22. With so much potential for recovery, D.C. needs to continuously evaluate efforts in the coming years, set bold goals especially around achievement and postsecondary outcomes, and make changes when things are not working.
Notes on research methods and terminology
To produce this report, the D.C. Policy Center relied primarily on publicly available data sources as described at the close of the report. The team also conducted a review of Continuous Education Plans and interviews with school leaders to provide additional qualitative information.
Continuous Education Plan review
All LEAs in D.C. were required to complete Continuous Education Plans (CEPs) and Health and Safety Plans for school year 2021-22. CEPs include information on how LEAs would approach safe reopening, student and staff wellbeing, and accelerated learning for all students. Health and Safety Plans include information on how schools will adhere to DC Health and OSSE guidance around COVID-19 precautions.
The D.C. Policy Center conducted a review of plans submitted by the 11 largest LEAs in D.C., representing over 80 percent of total student enrollment, to tease out the most common strategies and approaches unique to school year 2021-22. The CEP review specifically concentrated on areas of the plans pertaining to mental and social-emotional health supports, supports for students with disabilities and English learners, and use of federal recovery funds. The Health and Safety Plan review concentrated on social distancing and quarantine policies.
School leader interviews
The D.C. Policy Center conducted a series of interviews with school leaders to learn more about how they approached the first year of full-time in-person learning. Interviews covered strategies that school leaders used in conjunction with federal recovery funds, supports for special populations, experiences with staffing and workforce challenges, family engagement strategies, and general reflections about the school year.
We spoke with 10 school leaders—seven school principals (three from DCPS and four from public charter schools) and three administrative staff—and visited one school. We spoke with leaders from elementary, middle, and high schools in Wards 4, 5, 7, and 8. Interviews were used to provide background throughout the report and direct insight into bright spots and challenges.
Pre-pandemic and pandemic
Throughout the report, we refer to school years as “pre-pandemic” and “pandemic”. Pre-pandemic school years refers to school years 2018-19 and prior. In some instances, pre-pandemic may refer to 2019-20 when explaining enrollment or other metrics that were recorded prior to March 2020 when schools closed due to COVID-19. Pandemic school years refer to school years 2019-20 and 2020-21 when schools were held mostly virtually. While school year 2021-22 still included COVID-19 considerations, because it was held in a more normal format of in-person default instruction, it is not included when referring to pandemic years.
D.C.’s public schools
Throughout the report, we refer to District of Columbia Public Schools (DCPS) and public charter schools in D.C. collectively as “D.C.’s public schools”. We refer to DCPS or public charter schools specifically when we are referring to one sector only.
2. Students
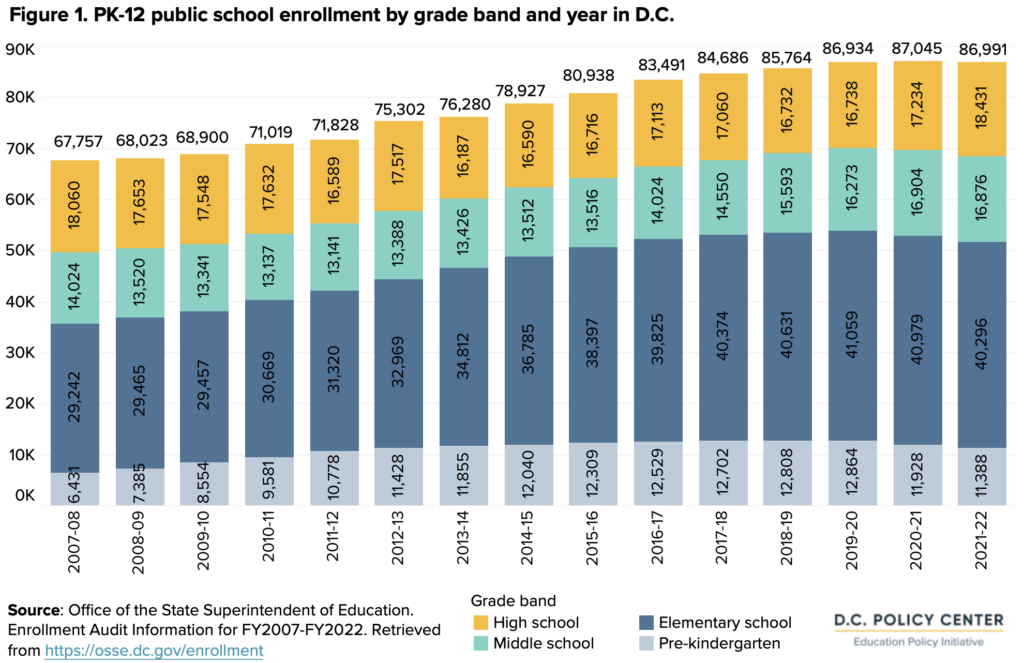
Perhaps as one indicator of declining demand for living in D.C. and attending its public schools, pre-kindergarten to grade 12 enrollment dropped slightly in school year 2021-22 after at least 13 years of steady growth pre-pandemic.
Enrollment declined especially in the youngest and noncompulsory grades of pre-kindergarten for ages 3 and 4. It also declined in Wards 2, 6, and 7.
Enrollment also shifted in terms of student characteristics: the share of students who were designated as “at-risk” for funding purposes increased, because of an underlying increase in two factors that qualify students as “at-risk”: the number of families enrolled in government programs such as TANF and SNAP, and the number of overage high school students.
Enrollment
From 2007-08 to 2019-20, D.C.’s public schools added an average of 1,598 students per year. This trend of steady growth ended when the pandemic began. Enrollment declined slightly—by 54 students—in school year 2021-22 to 86,991 students (see Figure 1). This was due to fewer births to D.C. residents leading up to the pandemic, together with lower demand for living in D.C. and attending its public schools during the pandemic.8
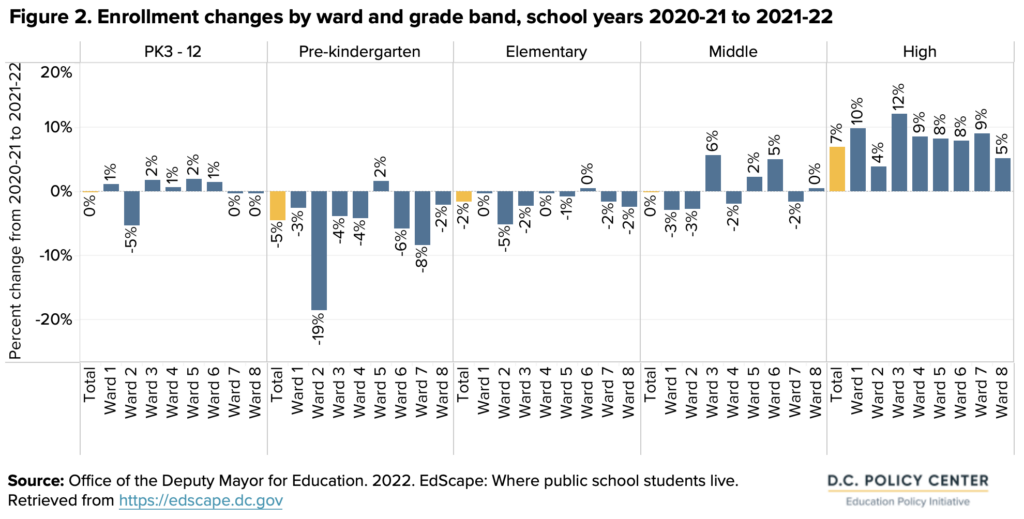
Enrollment changes by ward and grade band
By grade band, pre-kindergarten and high school enrollment had larger changes than other grades, with increases or decreases concentrated in certain wards.9 Pre-kindergarten, which experienced the biggest decrease in enrollment (5 percent), declined most in Wards 2, 6, and 7—where families may have chosen to keep young children in a noncompulsory grade at home during an uncertain year.10
Enrollment increased in high school grades by 7 percent—more than any other grade band (see Figure 2). The increase in high school enrollment is likely due to larger cohorts getting older, and relaxed academic and attendance requirements that were necessary to match the realities of virtual learning pushing fewer students out.11 The increase in high school enrollment was largest in Ward 3.
Enrollment by category
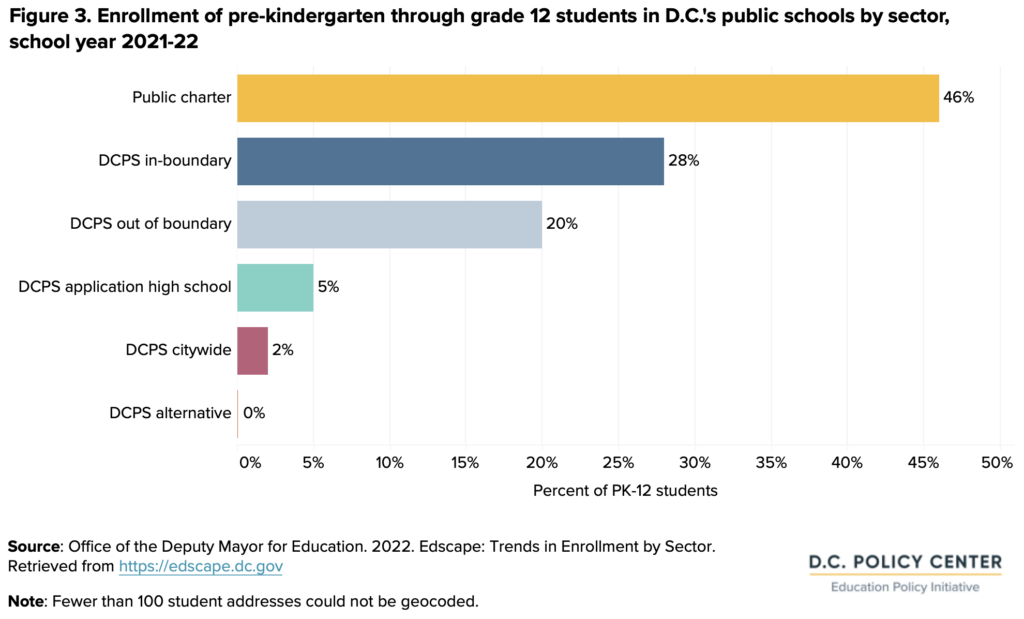
In school year 2021-22, 54 percent of pre-kindergarten through grade 12 students were enrolled in DCPS schools (down 1 percentage point from school year 2020-21), while 46 percent were enrolled in public charter schools (up 1 percentage point from the previous year).
Further breaking down the 54 percent of pre-kindergarten to grade 12 students enrolled at DCPS, 28 percent attended their by-right school, where enrollment is guaranteed based on residence. Twenty percent attended a DCPS by-right school as an out-of-boundary student, 5 percent attended a DCPS application high school, and 2 percent attended another DCPS citywide school (see Figure 3).
Enrollment by race and ethnicity
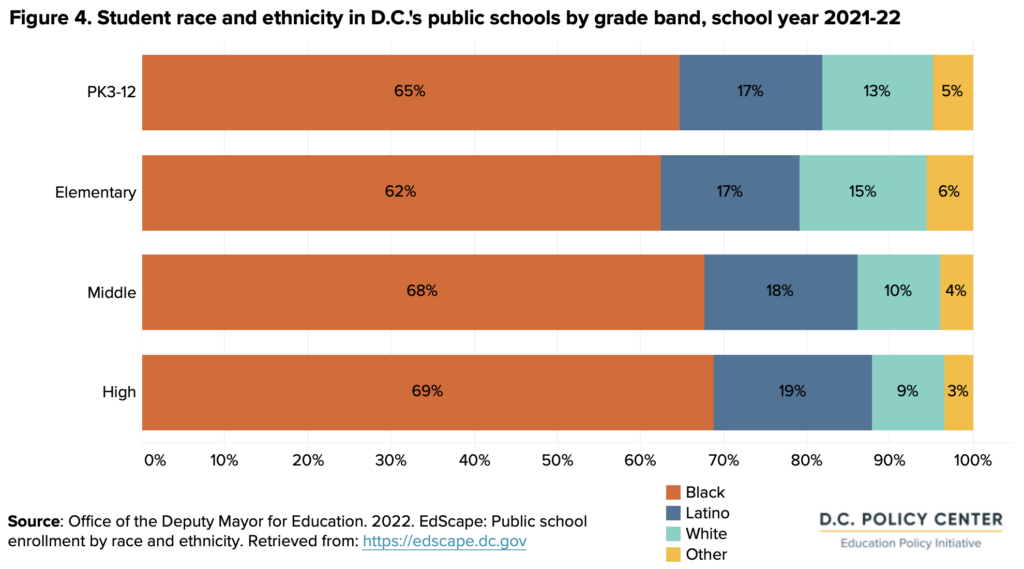
By race and ethnicity, enrollment in D.C.’s public schools did not change very much. In school year 2021-22, as in previous years, most students were students of color: 65 percent of students were Black, 17 percent were Latino, 13 percent were white, and 5 percent were other races or ethnicities. There were very small changes between school years 2020-21 and 2021-22, with less than a percentage point difference across all race and ethnicity groups.
Comparing grade bands to one another during school year 2021-22, elementary school has the highest share of students who are white (15 percent). That share declines for the middle school population and is the smallest in high school at 9 percent (see Figure 4).
Enrollment by special populations
In D.C., LEAs receive additional funding for students who are designated as “at-risk,” a category that includes students who receive certain public benefits, experience homelessness, are in the foster care system, or are overage in high school.
In school year 2021-22, 49 percent of D.C. students (42,708 students) were designated as at-risk, an increase over 45 percent (39,741 students) the previous school year (see Figure 5). This is due in part to more students qualifying for Supplemental Nutritional Assistance Program (SNAP) and Temporary Assistance to Needy Families (TANF) than in previous years, which could be related to large employment losses among D.C. residents, especially those who work in the local service economy.12 The number of students who are overage in high school also increased by 10 percent (approximately 580 students),13 which could be related to higher retention of students who did not meet the requirements to pass to the next grade.
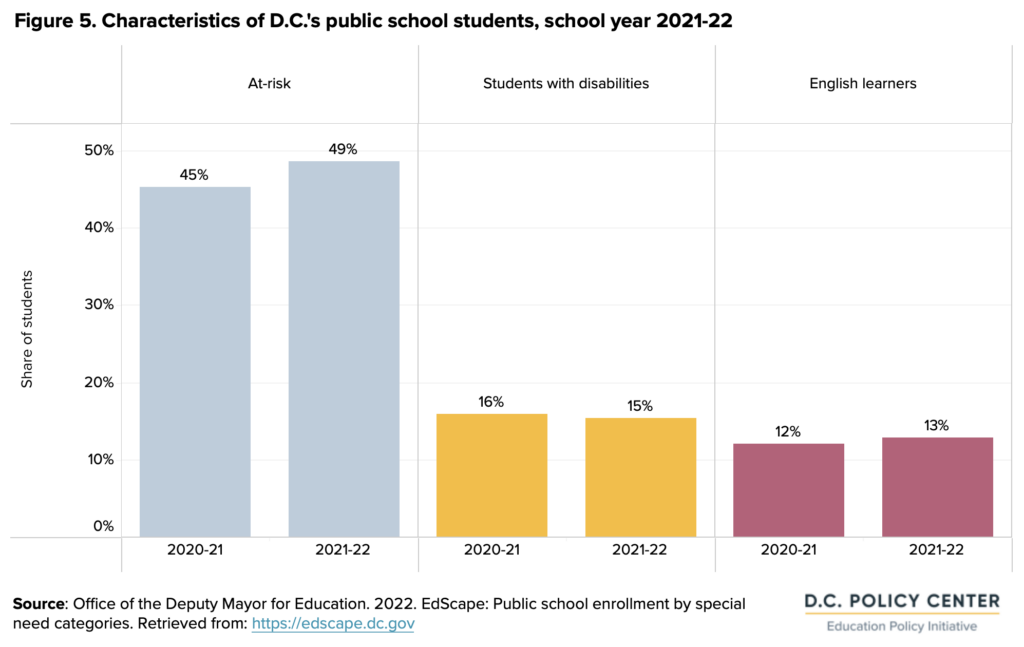
The share of students who receive additional services as students with disabilities or English learners did not change very much. In school year 2021-22, 13 percent of students were English learners, an increase of 1 percentage point over school year 2020-21.14 Additionally, 15 percent of students were students with disabilities, down from 16 percent in school year 2020-21.
Re-enrollment and student movement within public schools
Every year, some students stay in their previous schools, and some others leave. These students may choose not to re-enroll, or may initially enroll in the fall, but then choose to change schools during the year by switching to a different public school, enrolling in private school, moving into or out of D.C., or disengaging.
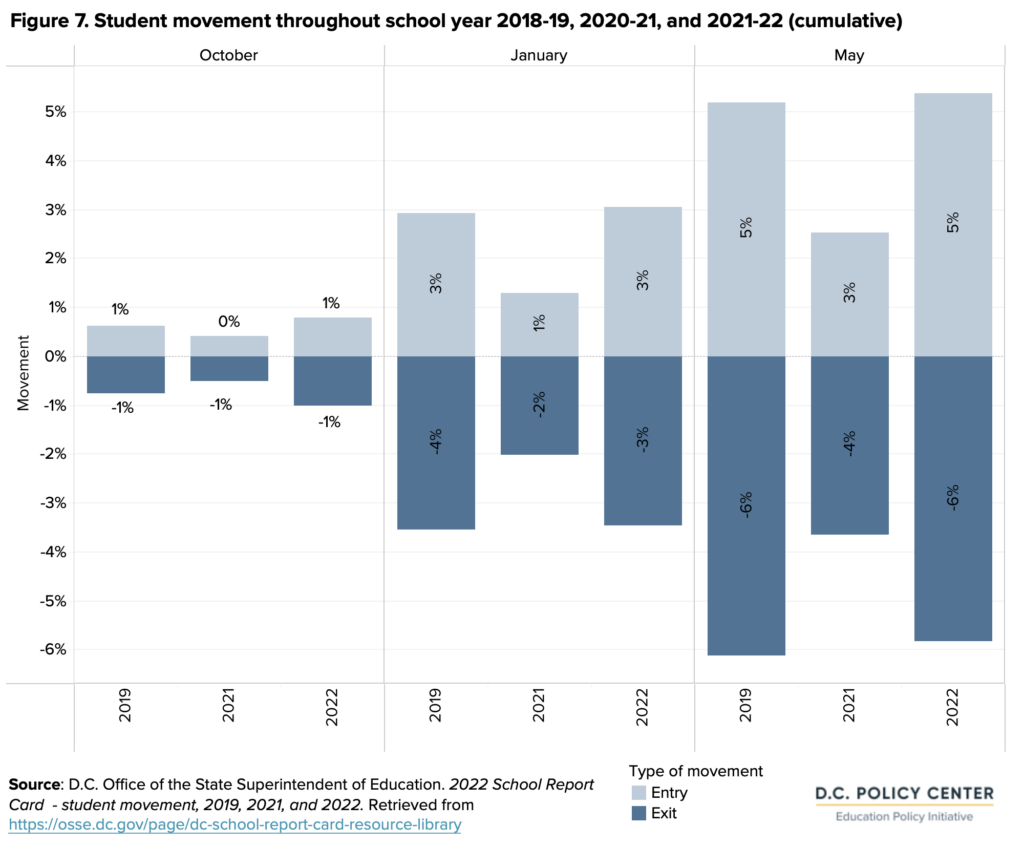
Re-enrollment and student movement data suggest that during virtual learning, families were less interested in moving schools, and that the return to in-person learning during school year 2021-22 meant a return to pre-pandemic enrollment and movement trends (see Figures 6 and 7).
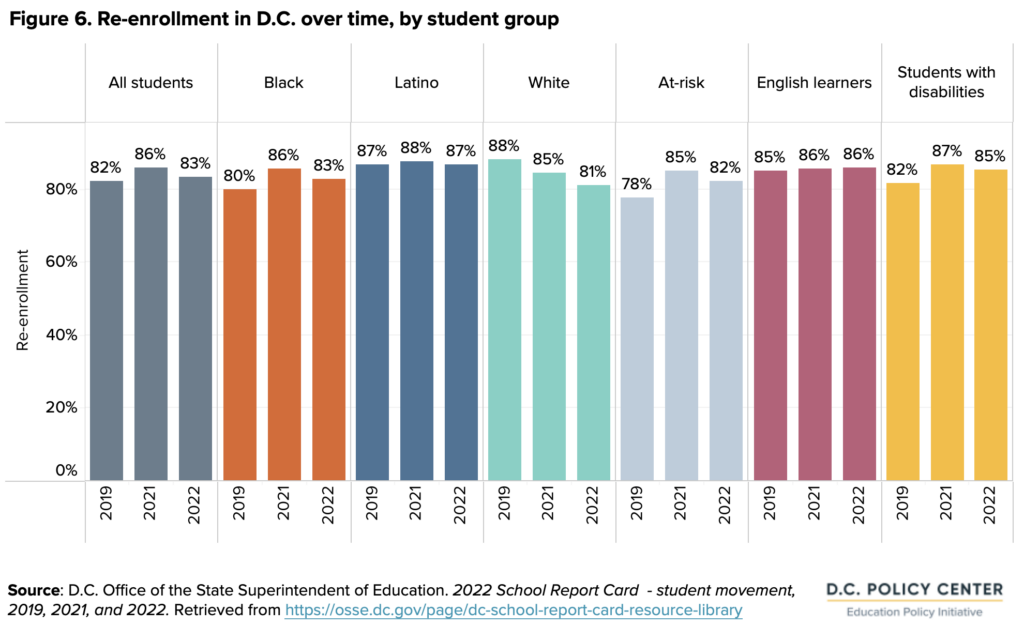
During school year 2021-22, 83 percent of all students re-enrolled at their school, which represented a decrease from the first full pandemic school year of 2020-21 when 86 percent of students re-enrolled. By student group, re-enrollment was slightly higher than or the same as pre-pandemic movement trends.
Adult and alternative learners, and students at special education schools in D.C.
In addition to schools serving students in pre-kindergarten through grade 12, D.C. has schools and programs serving adult learners, alternative learners, and special education students with high levels of need.
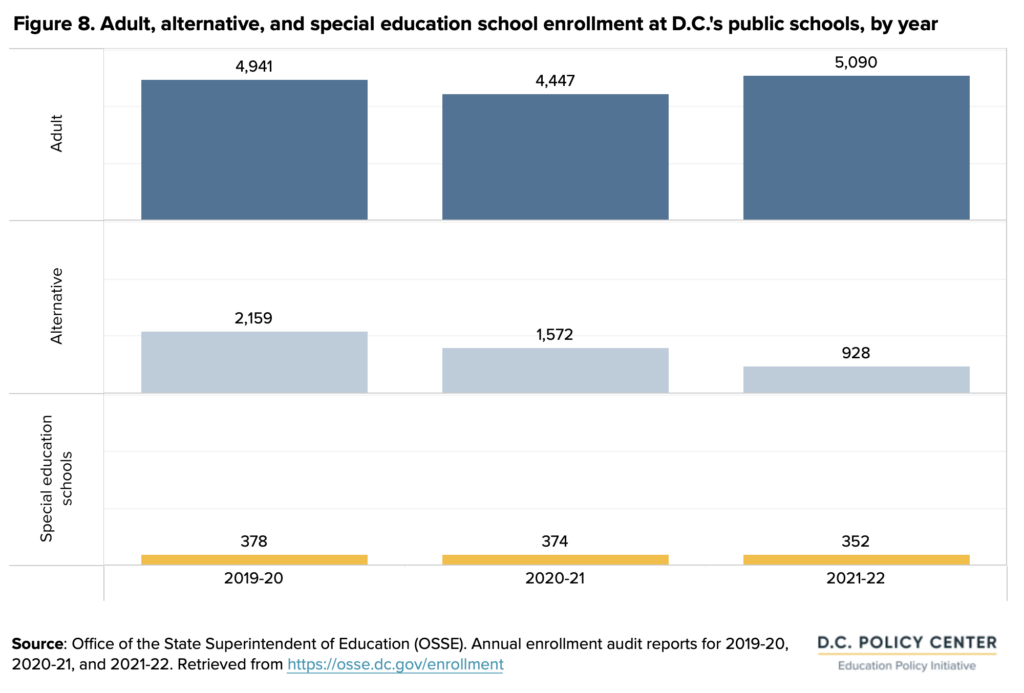
In school year 2021-22, 5,090 adult learners were enrolled in D.C.’s public schools—14 percent more than school year 2020-21 (see Figure 8). Enrollment for alternative learners, on the other hand, has decreased by more than 600 as of school year 2021-22. For both groups (6,018 learners total), enrollment has not bounced back to pre-pandemic levels (7,100 in school year 2019-20). The decline is likely related to the challenges that adult and alternative learners faced in both the transition to a virtual learning format and external challenges related to COVID-19.15
D.C. also offers several options for special education students with high levels of need outside of pre-kindergarten through grade 12 education. Enrollment in these programs declined in school year 2021-22 to 352 students—down from 374 students in school year 2020-21, and 378 students in school year 2019-20.
New, returning, and exiting students by grade, race, and ethnicity
More than a decade of steady annual enrollment growth in D.C. ended during the pandemic. Enrollment in D.C.’s public schools declined slightly in school year 2021-22, and grew by only 111 students in school year 2020-21. This shift is due to two factors: a decline of 2 percent per year in births to D.C. residents beginning in 2016,16 and lower demand for living in D.C. and attending its public schools during the pandemic.
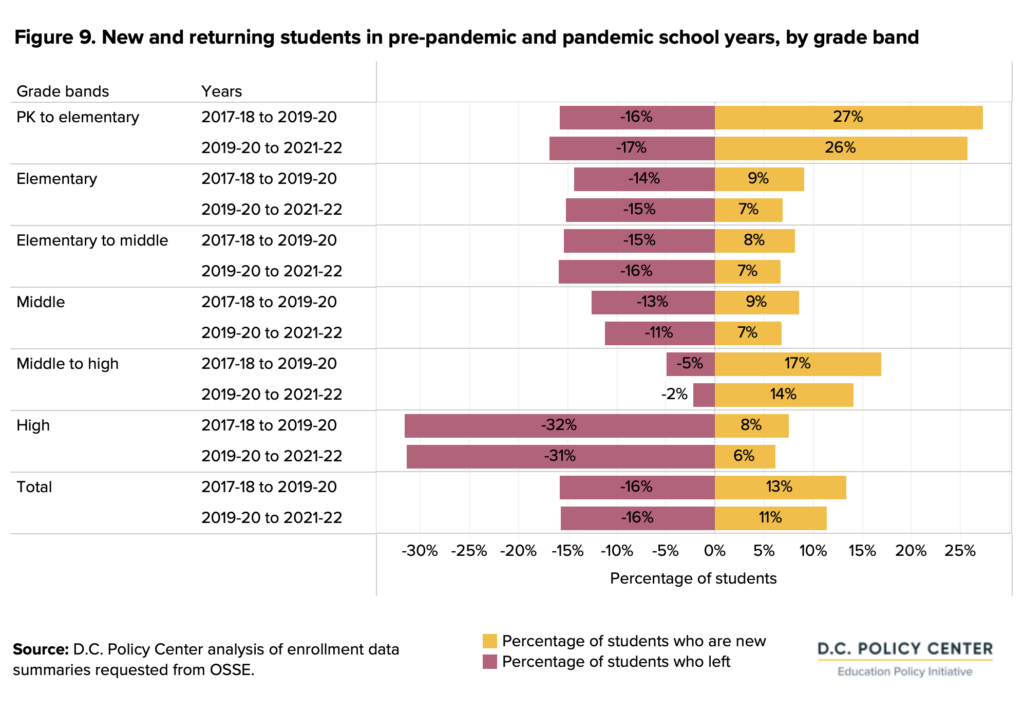
To shed light on this change in demand, we compared the number of students who entered and exited D.C.’s public schools between school years in two periods: before and after the pandemic. Data provided by OSSE show that trends in enrollment demand are mostly driven by fewer new students joining, rather than more students exiting.
New students. Between the pandemic school years of 2019-20 and 2021-22, students were less likely to enter D.C.’s public schools as new students when compared to the pre-pandemic period. Out of the students enrolled in in kindergarten through grade 12 during 2021-22, 11 percent of them had entered D.C.’s public schools as new students in the previous two school years. This is 2 percentage points lower than the 13 percent of students who entered in the pre-pandemic period we looked at (school years 2017-18 and 2019-20).
The middle to high school transition had the largest drop in new students, with 3 percentage points fewer new students between middle and high school grades in 2021-22 compared to the pre-pandemic period.
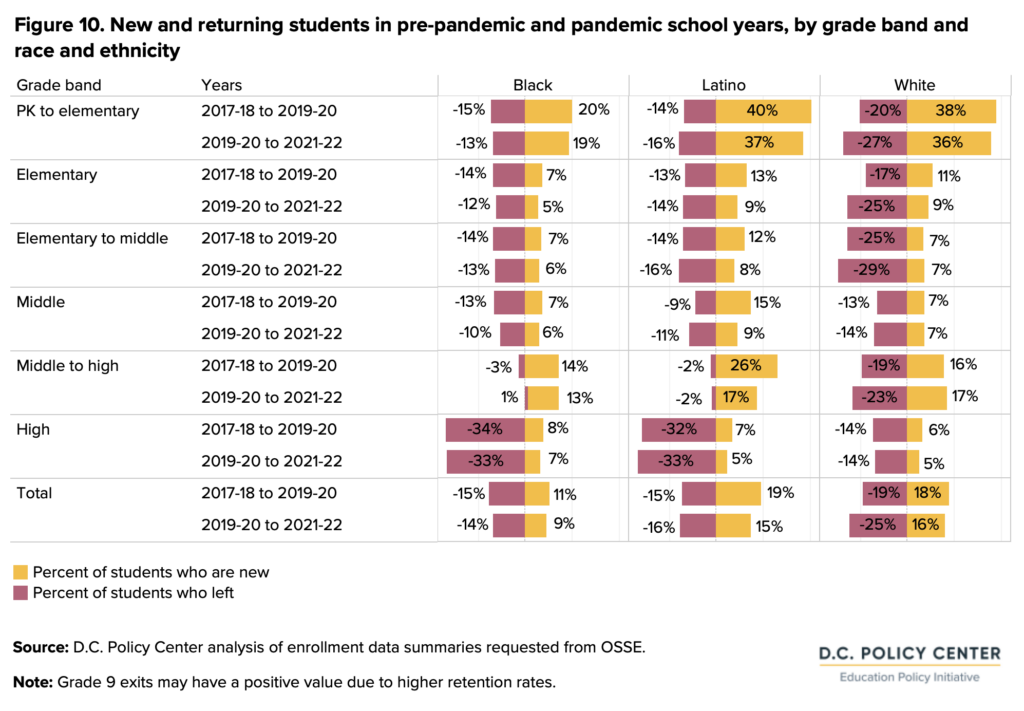
Exiting students. Students exited D.C.’s public schools during the pandemic at the same rates as pre-pandemic: 16 percent of students left D.C.’s public schools in both the pre-pandemic and pandemic periods we examined. However, the rate of exits differed by grade band. Students in pre-kindergarten and elementary school were more likely to leave during the pandemic. Students in middle and high school grades, on the other hand, were more likely to stay compared to pre-pandemic (see Figure 9).
Race and ethnicity. As in the overall picture, there are small differences between pre-pandemic and pandemic exit rates for Black and Latino students. For white students, however, 25 percent of those in pre-kindergarten to grade 10 exited during the pandemic school years. That’s a jump from 19 percent pre-pandemic. The jump in exit rates for white students was especially pronounced in pre-kindergarten to elementary and within elementary school grades. The biggest shift in new enrollment was for Latino students, 15 percent of whom were new during the pandemic school years, compared to 19 percent pre-pandemic. The decrease in Latino students occurred in almost all grade bands (see Figure 10).
Student outcomes
School year 2021-22 marks the return to in-person learning after nearly two years of disruption caused by the COVID-19 pandemic. Thus, it is an important time to take stock of outcomes for D.C.’s public school students around learning, graduation, and postsecondary enrollment.
Results on the first statewide assessment since the pandemic began to show declines compared to pre-pandemic, with larger declines in math and for Black students, Latino students, and students who are designated as at-risk. For high school students, graduation rates continued to improve. However, enrollment in postsecondary, which is the only available measure of outcomes after high school, declined for a third straight year.
“I want every kid to learn so that they have a choice-filled life. But what [our] community went through was very difficult. There was a lot of loss and a lot of illness. It’s really hard to talk about test scores being low because we could always ask questions in hindsight about whether we were virtual for too long or if we should have returned earlier […], but it was a very difficult situation.”
Miriam Darby
Principal, KIPP DC Heights Academy
Learning outcomes
In school year 2021-22, D.C. administered the state assessment, Partnership for Assessment of Readiness for College and Careers (PARCC), for the first time since the pandemic began. While all states and jurisdictions received a waiver to not administer any assessments for school year 2019-20, D.C. was the only jurisdiction to receive the same waiver for an additional year, due to its unusually high share of students learning completely virtually.17 Beyond the adjustment back to in-person classes, COVID-19, absenteeism, and other factors made school year 2021-22 a tough time to catch up on learning.
Learning outcomes declined in school year 2021-22. Compared to the last year the statewide assessment had been conducted (2018-19), the share of students meeting or exceeding expectations in ELA declined from 37 percent to 31 percent. It declined even more in math—from 31 percent to 19 percent. The share of students meeting or exceeding expectations in ELA reverted to the same as five years ago, and in math, rates were lower than in the first year of PARCC, seven years ago.
Learning outcomes were lowest for students who are designated as at-risk and students with disabilities—mirroring, in part, the student groups with the highest rates of chronic absenteeism in the previous school year. Fifteen percent of students designated as at-risk met or exceeded expectations in ELA, and in math, just 6 percent met or exceeded expectations (see Figure 11).
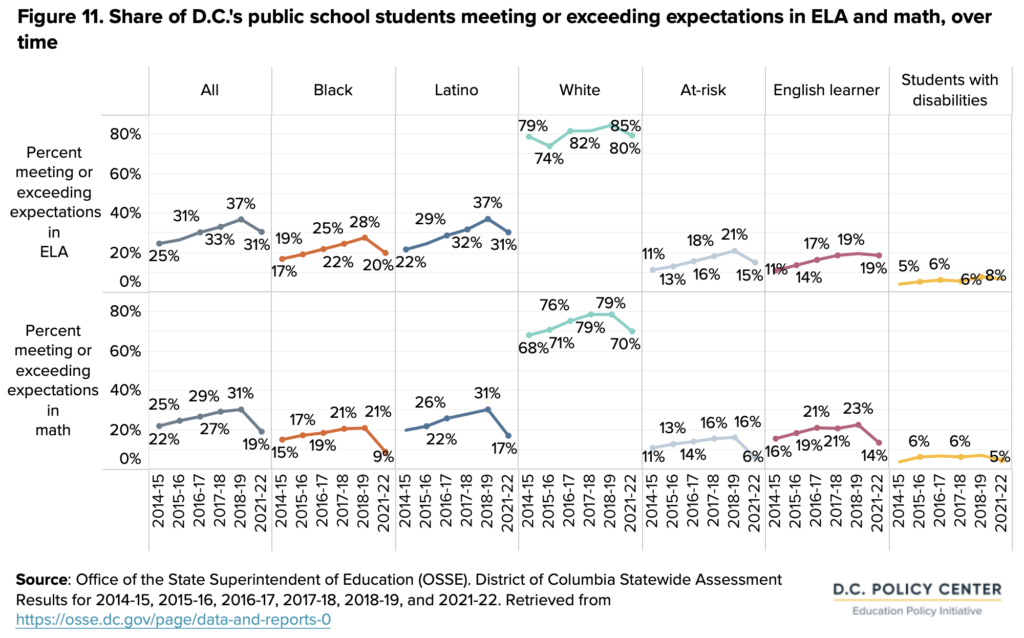
In addition, achievement gaps widened for Black and Latino students, when compared to white students.18
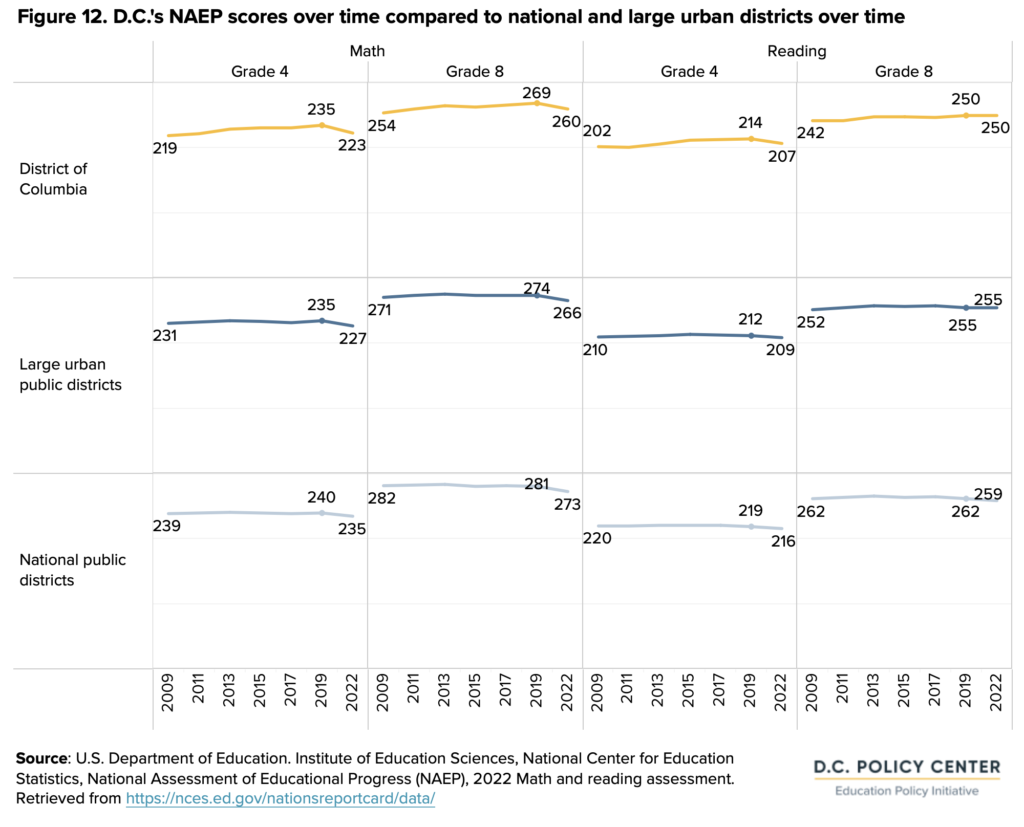
Similar to results on the statewide assessment, scores on the National Assessment of Educational Progress (NAEP)19 released in October 2022 show that overall student performance declined in school year 2021-22 after improving from 2008-09 to 2018-19, especially in math. Math scores declined by 12 points for 4th grade and nine points for 8th grade. Performance declines were smaller for reading, in alignment with national trends, dropping by seven points for 4th grade and staying constant for 8th grade.
In this national context, D.C.’s NAEP scores were lower than both the average for large cities and the national average across 4th and 8th grade in math and reading (see Figure 12). For 4th grade in both math and reading, D.C. experienced a larger score decline than public schools in urban districts or public schools nationwide.
High school outcomes
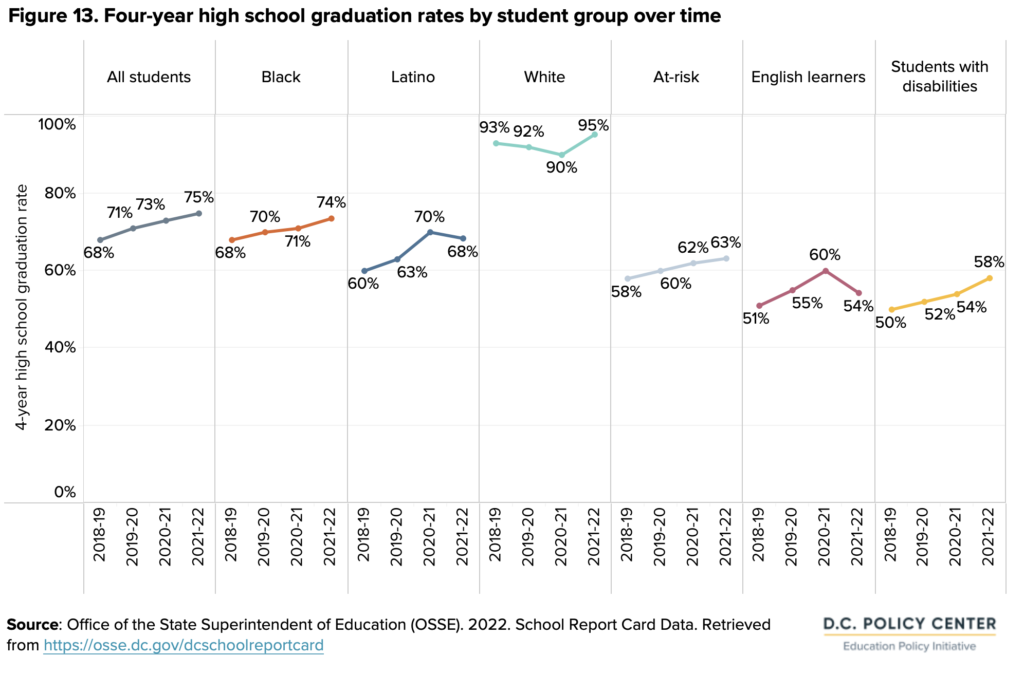
Graduation rates, which have been steadily increasing since the pandemic began, rose again this year by 2 percentage points. The graduation requirements were more stringent for students in school year 2021-22 than during the previous (virtual) school year. The Carnegie unit requirement of a specific number of in-seat instructional hours was reinstated, but there were still fewer requirements than pre-pandemic with an extension of the waiver for 100 hours of community service.2021
In school year 2021-22, 75 percent of the 9th grade cohort that began high school four years prior graduated, up from 73 percent in the previous school year (see Figure 13). Graduation rates improved for most student groups. However, graduation rates declined for English learners, who experienced a decrease by 6 percentage points, and Latino students, who experienced a decrease by 2 percentage points.
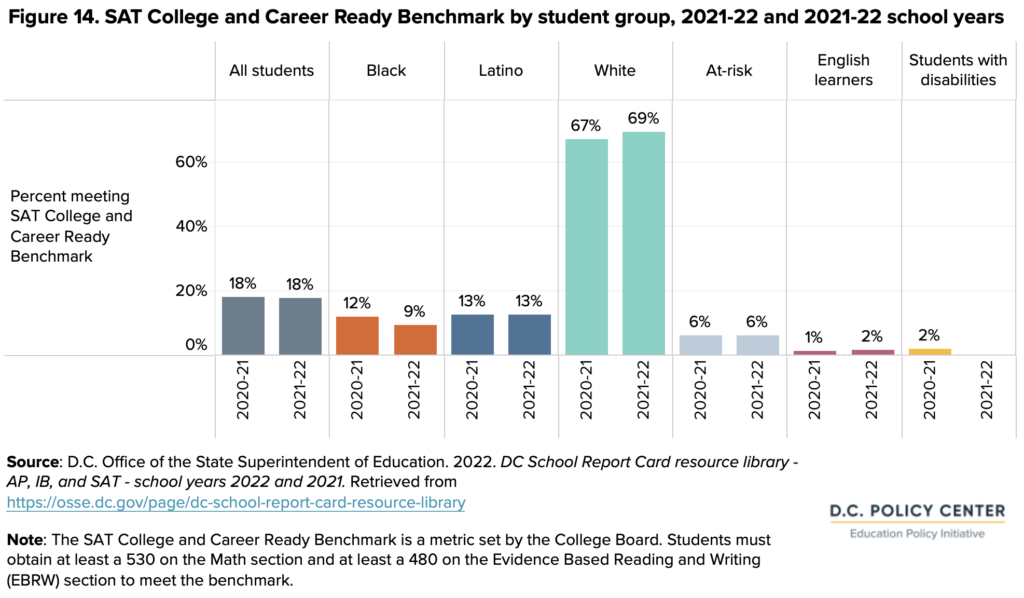
The SAT College and Career Ready benchmark is a metric that measures how well schools are preparing students for college and career. While graduation rates continued to rise, the percentage of D.C. high school seniors who were identified as college and career ready remained at 18 percent for the second year in a row (see Figure 14). However, the year saw a 3 percentage point decline in the readiness of students who are Black, down to 9 percent in school year 2021-22. At the same time, students who are white experienced a 2 percentage point increase, further widening achievement gaps between white students and other student groups.
Postsecondary enrollment
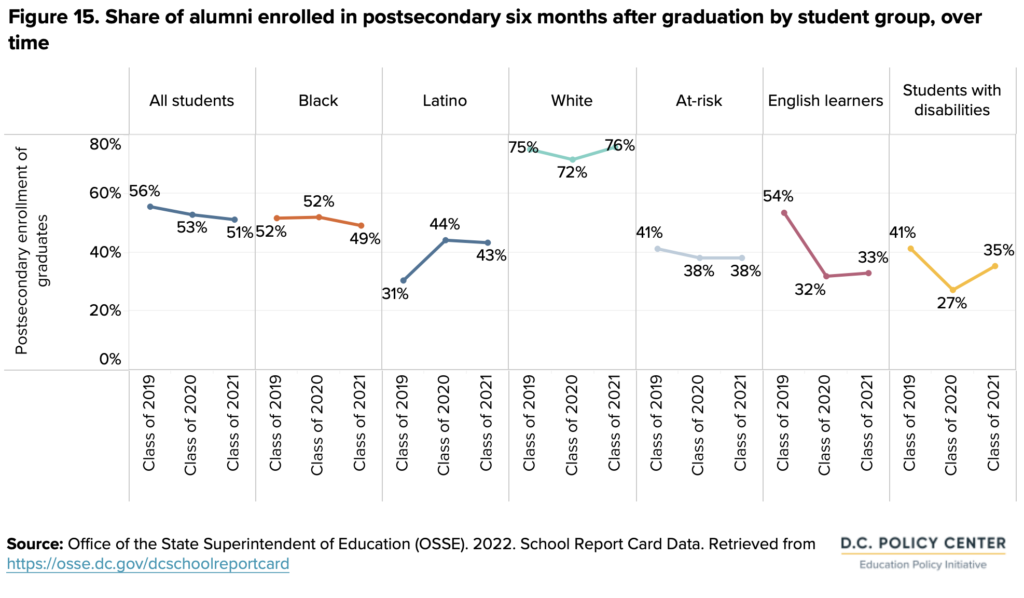
While postsecondary education is not the only path to a successful career, it is the only metric that D.C. tracks for its high school alumni and is therefore an important indicator to consider. Postsecondary enrollment six months after graduation, which has been decreasing since the pandemic began, decreased again by 2 percentage points for the class of 2021 (see Figure 15). This could be due to financial distress related to the pandemic or uncertainty around virtual or in-person learning.22 Postsecondary enrollment decreased the most for Black high school graduates by 3 percentage points.
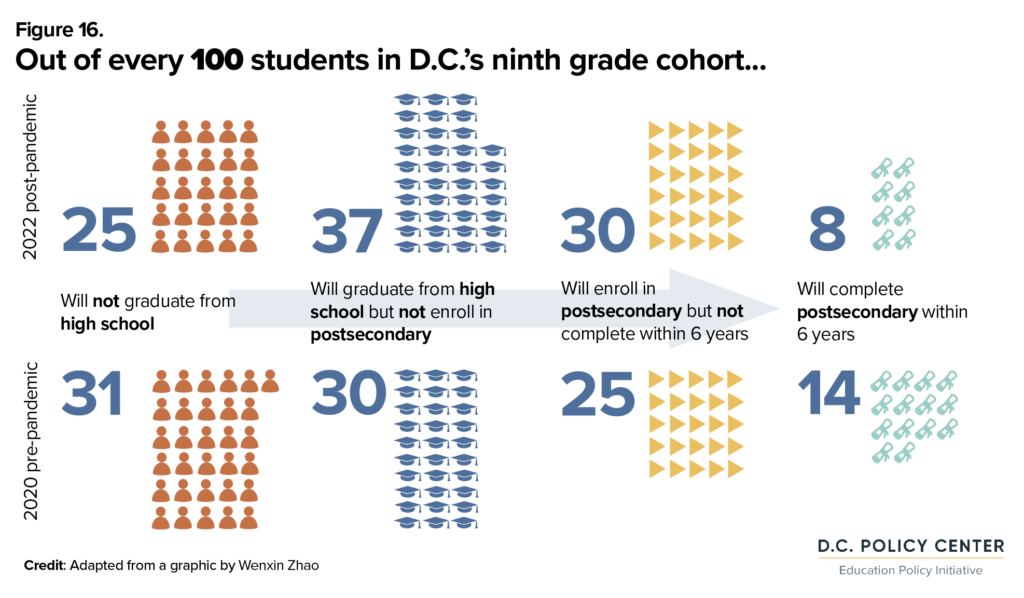
These trends suggest a weakening of college outcomes of D.C.’s public school alumni. Data are not available for those who pursue other training or career opportunities immediately after graduation, but publicly available data suggest that out of every 100 students that enroll in 9th grade, only eight will complete postsecondary education within 10 years, or within six years of graduating from high school—a decline from pre-pandemic, when 14 out of every 100 9th graders would eventually complete postsecondary. Trends starting post-pandemic suggest a larger share of the 9th grade cohort will graduate high school within four years (75 percent, as noted), but fewer will enroll in college (51 percent instead of 53 percent), and even fewer will graduate from postsecondary (22 percent instead of 37 percent—see Figure 16).
Aside from postsecondary enrollment and completion, data are not available for completion of other programs and data on annual income indicate that young adults born and living in D.C. earned $29,000 in 2021.23 School year 2021-22 was a year of renewed investment in high school that can help improve these outcomes: redesign efforts at DCPS, new funding for students who are overage in high school, and more funding for youth employment initiatives.
Access to advanced coursework for high school students
To increase postsecondary participation and to prepare students for postsecondary education,24 high schools across D.C. offer access to advanced coursework. For some types of this coursework, such as Advanced Placement (AP) or International Baccalaureate (IB) classes, passing the course or taking an end-of-year assessment can translate into college equivalency credits.
In D.C., access to advanced coursework as measured by AP and IB access varies across the city.25 On average, D.C. high schools offer 10 AP courses (see Figure 17).
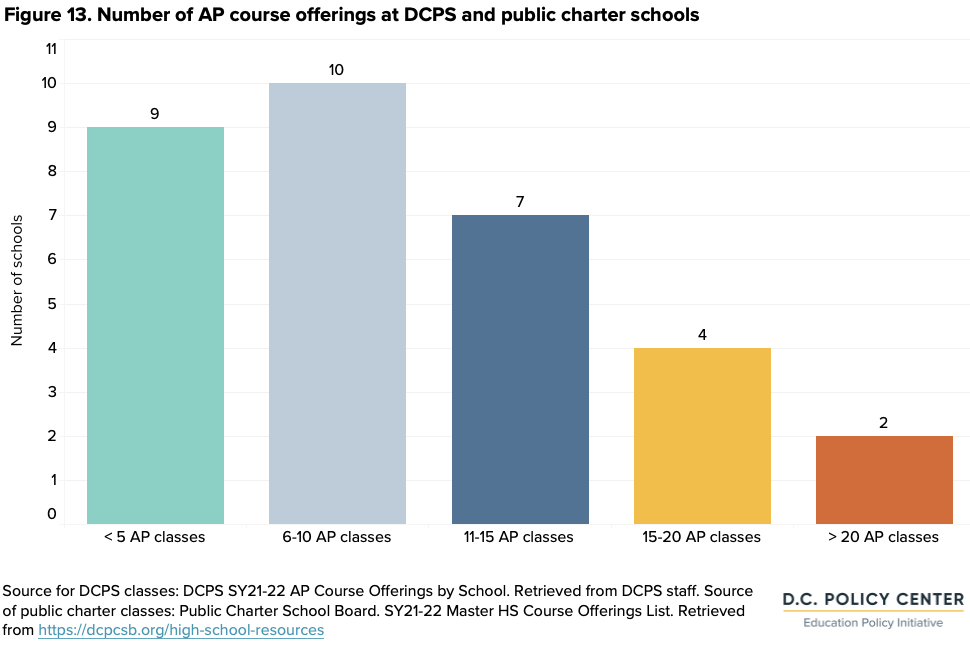
All DCPS comprehensive and application high schools are required to offer at least eight AP courses—at least one in each of the four core subjects.26 Public charter schools do not have the same requirement but most offer more than six classes, with three charters offering more than 15.
Two DCPS high schools and one public charter high school offer the IB program.27 In addition, at least four schools—Bard High School Early College DC, Early College Academy at Coolidge, the Advanced Technical Center, and School Without Walls—partner with colleges to offer pathways to earning transferable college credits.
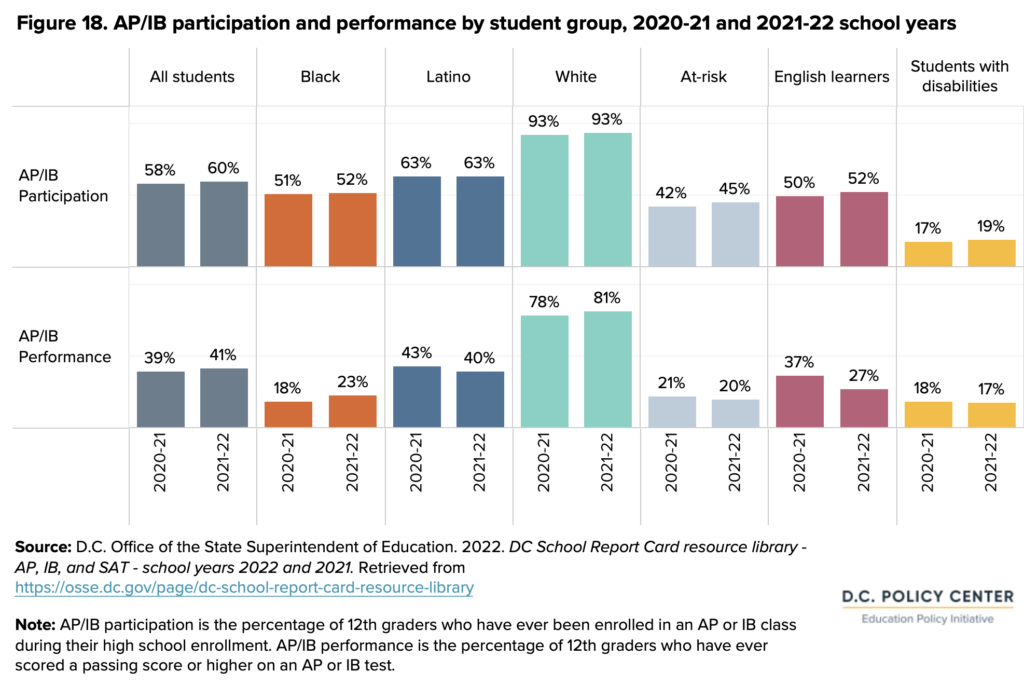
Compared to school year 2020-21, access to AP and IB classes expanded: the share of 12th graders who had ever taken an AP or IB class during high school increased from 58 to 60 percent. Students who are designated as at-risk had the largest increase in access to this coursework.
Similarly, the share of students who had ever received a passing or higher score on an AP/IB test by the time they were in 12th grade increased from 39 percent in school year 2020-21 to 41 percent in school year 2021-22, with an increase of 5 percentage points for Black students, and a large decrease for English learners of 10 percentage points (see Figure 18).
3. The school environment
The school environment in school year 2021-22 was shaped, in large part, by a continued response to COVID-19, as well as programs and services related to pandemic recovery, made possible by a large influx of funding from the federal government.
As of fall 2022, 23 percent of these federal funds had been spent, mostly on programs supporting learning acceleration. Schools also invested heavily in student and staff wellbeing, as well as safe reopening.
Despite these investments, attendance was a challenge amid the return to in-person school and constant new cases of COVID-19, with chronic absenteeism rising to an all-time high of 48 percent. Violent crime across the city also increased, which has been shown to have a negative impact on students’ attendance, academic performance, and wellbeing. Although there were issues with filling teacher vacancies, teacher retention was higher than pre-pandemic levels.
Pandemic recovery
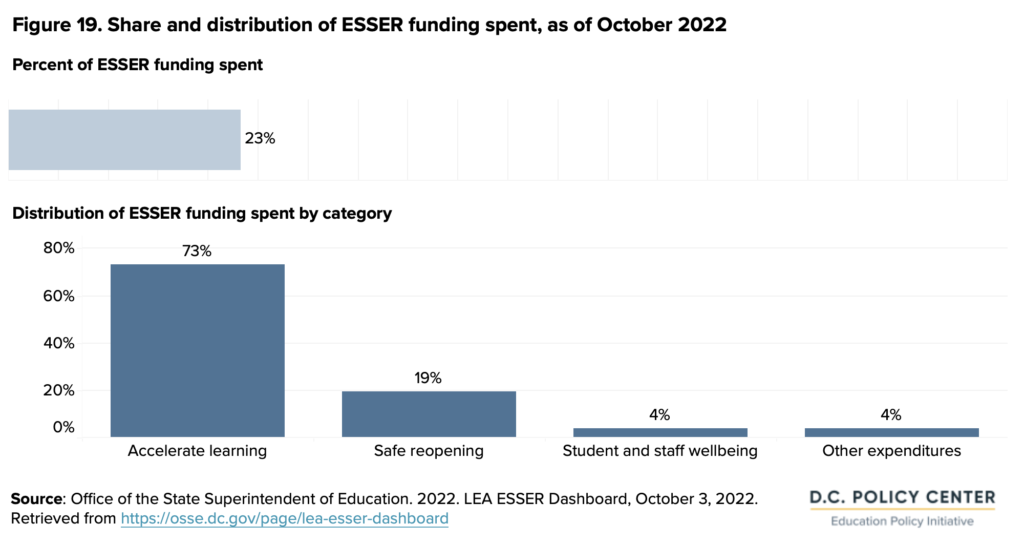
To help schools manage and recover from pandemic-related challenges, LEAs in D.C. received $540 million from the federal government in three rounds of ESSER funds.28 As of October 2022, after three fiscal years during which funds were available, 23 percent of available ESSER funds, or $125.8 million, had been spent. Accelerated learning was the largest category of ESSER spending in D.C.—73 percent of funding spent across all ESSER rounds was classified for this purpose, but there is little detail on what types of accelerated learning activities were supported.
Of the other allowable expenses, 19 percent of funding had been spent on safe reopening, 4 percent on student and staff wellbeing, and 4 percent on other allowable expenditures (see Figure 19).
Learning acceleration
Learning acceleration accounted for the majority of ESSER expenditures, at 73 percent. Expenditure data do not show which activities are included in learning acceleration, but it is likely that schools focused on summer programming, personnel, professional development, and new programs like high-impact tutoring.
As described in the student outcomes section of this report, statewide assessments in school year 2021-22 showed that during the pandemic the system lost most of the learning gains it had made in the five years prior to the pandemic.
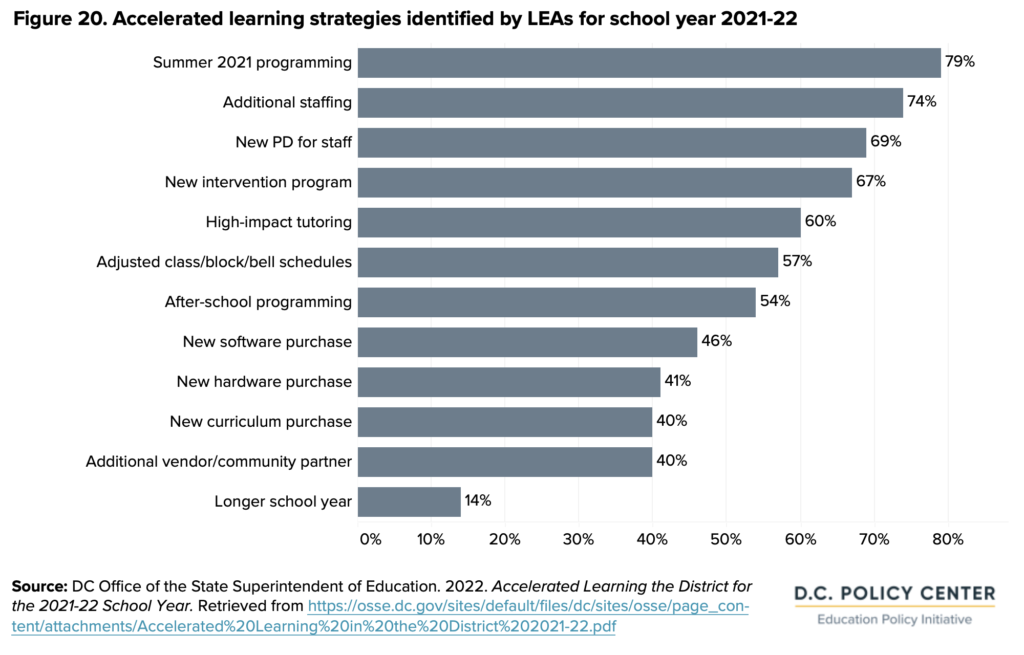
Learning acceleration activities. Continuous Education Plans indicate that the most common accelerated learning strategies included summer 2021 programming (79 percent of LEAs); additional staffing (74 percent of LEAs); new professional development (69 percent of LEAs); and new intervention programs (67 percent of LEAs—see Figure 20).29
The largest category, summer 2021 programming, often included targeted opportunities for students who had been disengaged or lower performing during the previous school year; students who are English learners; and students with disabilities. Programs often offered split-day programming with half the day centered around math or literacy interventions and the other half on non-academic enrichment activities. For LEAs with high school programs, summer programming continued to offer credit recovery opportunities. The majority of the 10 largest LEAs noted in Continuous Education Plans that they had expanded their summer programming as a result of ESSER funding, and that as a result, more students had the opportunity to attend than in the past.
High-impact tutoring
To accelerate learning in school year 2021-22, most schools in D.C. used high-impact tutoring (HIT), a move catalyzed by support from OSSE and CityTutor DC (a coalition of schools, community-based organizations, civic partners, and other stakeholders). HIT aligns with research-backed guidelines and is concentrated, consistent, and stresses the importance of building strong tutor-student relationships. LEAs started HIT programs in their schools either using external providers, employing tutors in-house, or some combination of the two approaches.30
Implementing HIT required a high degree of coordination between systems-level actors, LEAs, schools, and tutoring providers. LEAs and providers both experienced challenges with tutor recruitment and COVID-19 disruptions. Even so, HIT reached approximately 7 percent of students in D.C. since its inception in May 2021 to December 2022, with schools in Wards 1, 7, and 8 more likely to work with external providers.31
WHAT PARENTS ARE SAYING
Forty-five percent of parents who responded to a survey conducted by Parents Amplifying Voice in Education (PAVE, an organization that empowers D.C. families to have voice and choice in education) reported being satisfied with academic tutoring.32
Supports for students in special populations
D.C. provides funding for students who are designated as at-risk,33 students with disabilities, and English learners so that schools can use a variety of strategies to serve their needs. Here are examples of the supports that schools provided in school year 2021-22.
Supports for students designated as at-risk
To support students who are designated as at-risk, public charter schools often hired additional staff, including social workers, counselors, behavioral therapists, social-emotional learning specialists, and family engagement coordinators. They also often provided opportunities outside of traditional school hours, such as out-of-school time opportunities (before and after care; sports, arts, and enrichment activities; and summer school or extended school year programs); wraparound services such as coordinating food distribution and connections to external health and social supports; and transportation.34
For DCPS schools, in school year 2021-22, 10 percent of at-risk funds remained at the central office to support administrative functions and 90 percent was transferred to schools through the Comprehensive Staffing Model, as well as the “Excellence through Equity” (EtE) allocation.35 Uses for EtE included hiring for interventionists, social workers and counselors, instructional aides, afterschool programming, and tutoring support. Funding was also often used to support school partnerships, tutoring programs, technology investments, literacy partners, and academic interventions.
Supports for students with disabilities
With a return to in-person learning, LEAs assessed learning needs for students with disabilities in the fall of 2021. Most LEAs indicated in Continuous Education Plans that they would use results from fall learning assessments, social-emotional and developmental indicators, and parent input to determine the extent of accelerated learning services required for individual students with disabilities. In addition, some LEAs also weighed disengagement during virtual learning and lack of growth of Individualized Education Plan (IEP) goals when assessing accelerated learning needs. And to make it easier to coordinate services, LEAs continued to offer virtual options for conferences, in addition to hybrid options for parent trainings.
Even with these efforts, access to support services for students with disabilities was a frequent concern for parents, with at least one in five calls to the Office of the Student Advocate (OSA) and the Office of the Ombudsman of Public Education related to special education concerns.36 37 Across both offices, calls related to special education were commonly made by parents of students who already had an IEP or a 504 plan in place (30 percent of special education calls from OSA and 76 percent of calls made to the Office of the Ombudsman), in addition to some parents who were interested in new special education plans.
Across both agencies, the top concern reported related to special education services was inadequate service delivery, such as not receiving the number of service hours written into IEPs.
Staffing shortages may have contributed to the complaints regarding service delivery—7 percent of special education teaching positions were vacant as of October 2021.38 This meant, for example, that some students were not receiving speech and language services, or some students had to attend a general education classroom because schools lacked enough staff for a separate special education classroom.
To assist families of special education students, the Office of the Ombudsman expanded their offerings by hiring a dedicated Special Education Assistant Ombudsman. They also launched the DC Special Education Hub in partnership with OSSE which offers one-on-one support, resources, and training to students with disabilities and their families.39
Supports for students who are English learners
LEAs’ Continuous Education Plans largely reflected federal requirements and OSSE guidance for screening English learners during the first 30 days of school.40 To accelerate learning for English learners, most LEAs specified that English learners will receive access to the same opportunities as their peers. Few LEAs specified specific interventions or programs that they planned to provide such as high-impact tutoring, after school programming, summer school, and priority access to out-of-school time programs.
The OSA worked to improve access to information and resources for English learners and their families. In school year 2021-22, the OSA rolled out El Navegador, an inventory of English learner services for students and families across D.C.41
Student and staff wellbeing
Returning to in-person learning, student and educator wellbeing continued to be a major priority districtwide and one of the core ESSER spending categories in school year 2021-22.
Students struggled with their mental health during last school year. In a national survey of health risk behaviors, the share of D.C.’s high school students who reported feeling sad or hopeless increased from 33 percent in school year 2019-20 to 36 percent in school year 2021-22.42 Female students were more likely to report feeling sad or hopeless (48 percent) than their male peers (23 percent).43
School leaders also reported that students experienced a difficult transition back to in-person interactions with both their peers and staff. Students on the State Board of Education’s Student Advisory Committee (SAC) identified stressors beyond COVID procedures, related to the increase and difficulty of schoolwork.44 Only 29 percent of students felt they were always listened to by an adult when seeking mental health help.
School leaders also identified multiple challenges that teachers and school staff experienced while transitioning back to in-person learning. Teachers had to navigate new student behavior issues at the beginning of the year, and they were asked to do more than in previous years, including at times administering COVID-19 tests. In other cases, teachers were called to cover additional classes when coworkers were absent, or to cover vacant positions. In some schools, teachers had to prepare asynchronous work for students who were quarantined at home; in others, teachers taught classes synchronously both in-person to students at school and virtually to students at home. All school leaders identified teacher and staff burnout as an issue they were trying to mitigate during school year 2021-22.
“The biggest challenge for us as a school community was when teachers were out. It impeded normal levels of morale, there were no substitutes available, and teachers got tired of covering for others—at one point the principal had to cover. The ship had to keep sailing even when people were out. If you’re available to support, then you need to support.”
Charlette Butler-Strickland
DCPS Hart Middle School
Addressing student wellbeing. To help improve student wellbeing, the D.C. Department of Behavioral Health (DBH) worked with public schools to provide mental health counselors, as in other years.45 However, staffing and coordination for mental health services proved challenging in places. As of March 2022, 20 schools had vacancies for their DBH-assigned clinicians and 69 had vacancies for mental health positions typically filled by community-based organizations.46 Sometimes, it was difficult for students to know which mental health resources were available.47
WHAT PARENTS ARE SAYING
Fifty-five percent of parents who responded to a PAVE survey reported that they were satisfied with the mental health and social-emotional support in D.C. schools—an increase from 46 percent in the spring of 2021.
All school leaders interviewed emphasized the importance of incorporating social-emotional learning practices into all facets of the school day, and most leaders mentioned offering professional development to teachers and staff to assist in this area. Continuous Education Plans suggested that most LEAs incorporated lessons on social-emotional learning (SEL), relationship building, and mental health awareness into everyday curriculum and activities with specified time set aside in morning meetings, advisories, or smaller groups to focus on lessons. LEAs continued to assign services and supports based on the Multi-Tiered System of Supports (MTSS).48 In addition, several LEAs noted that they had plans to hire additional mental health staff in preparation for school year 2021-22.49
Staff wellbeing. To improve staff wellbeing, several school leaders increased compensation for teachers or offered cash bonuses throughout the year in recognition of increased or changing workloads. Several LEAs also offered more flexible scheduling with abbreviated school days that allowed teachers to participate in professional development or attend to personal matters. One school leader reoriented staff meetings to focus more on teacher wellness by offering activities meant to center mindfulness and to share challenges.
Panorama survey of student wellbeing
DCPS’ Panorama survey, one means of tracking student wellbeing, shows that some measures of student wellbeing did improve during school year 2021-22.
The survey was developed by DCPS in partnership with Panorama Education to measure progress toward the vision that “every student in D.C. will feel loved, challenged, and prepared to participate fully in society.” It has been administered annually since school year 2017-18.50
Students’ overall positive feelings on the survey’s Loved, Challenged, and Prepared Index (LCPI) showed an increase of 3 percentage points from fall 2021 to spring 2022, including +3 percentage point increase in the “Loved” metric, which measures a sense of belonging that students feel; +1 percentage point increase in the “Prepared” metric, which measures the extent that students feel that they can positively influence society; and no change in how challenged students feel as measured by the “Challenged” metric.51
Safe reopening
The COVID-19 pandemic and related policies evolved over the school year. Vaccines became available for children ages 5 to 11 beginning in November of 2021,52 making almost all students in D.C.’s schools eligible for vaccination (outside of those in pre-kindergarten). Even so, D.C. experienced a high of 2,000 new cases per day during the winter with the highly-contagious Omicron variant. This spike had implications for learning disruptions and caused another shift to virtual learning around the holidays, before cases leveled off in the spring (see Figure 21).
In the spring of 2022, with a decline in cases, new guidance from DC Health removed physical distancing requirements in classrooms, eliminated the requirement to submit information on all positive cases, granted more autonomy to LEAs to set individual quarantine policies, and removed indoor and outdoor masking requirements.
Throughout the year, OSSE instituted specific requirements that each LEA had to include in their safe reopening plans, aligned with best practices defined by the Centers for Disease Control and Prevention (CDC). These safe reopening activities represent another main category of ESSER spending (19 percent of funds spent).
Preventative measures. In the fall of 2021, LEAs had to decide how they would implement OSSE’s physical distancing policy in terms of classroom spacing, common spaces, during extracurricular activities, and during morning arrival and afternoon dismissals.
Additionally, LEAs had to describe the specific cleaning protocol they would undertake to ensure that high-traffic areas were sanitized frequently, how proper handwashing would be communicated, as well as where hygienic and PPE materials would be stored. OSSE also required all LEAs to institute a mask requirement for students, staff, and all those visiting school buildings with protocols for special considerations, as well as daily health screenings for students, staff, and visitors to complete before entering school buildings.
For example, at the beginning of the year, DCPS required staff and students to wear a mask in school buildings, participate in random testing for COVID-19, and isolate for 10 days after testing positive or experiencing a COVID-19 exposure. But some social distancing rules were relaxed, and middle and high school students could take classes with multiple cohorts, unlike the previous year.53 Public charter schools were encouraged to follow similar guidelines. In March 2022, DCPS dropped its mask mandate. Individual charter LEAs had autonomy to decide on masking requirements.
Testing and quarantine. LEAs also instituted protocols for how they would approach students and staff who contracted COVID-19 including identifying possible cases, testing procedures, dismissal procedures, and quarantine policies. These plans could be confusing to navigate. At every decision point, LEAs had a variety of policies to follow, notifications to send, quarantines to start, and instruction to continue. In addition to responses to symptomatic cases, DCPS and public charter schools also participated in several asymptomatic testing efforts, including testing 10 percent of students each week and various test-to-return programs in which students had to submit proof of a negative test before returning to school after a longer break.
Policies changed over the course of the year. After the fall, fully vaccinated students and staff at DCPS schools who did not show symptoms no longer had to quarantine, while those who were unvaccinated were still required to quarantine for 10 days.
WHAT PARENTS ARE SAYING
Among parents who responded to a PAVE survey, 61 percent reported that they are satisfied with how schools handled COVID-19 policies. Forty-six percent said that parents felt that instructions regarding quarantine processes provided by their schools were clear.
Implementing these policies and subsequent changes was a challenge. School leaders reported that they heard a lot of confusion and frustration from families and students over quarantine policies. Families expressed disappointment that they did not hear about positive cases soon enough, even with contract tracers in place, at times because families who conducted their own testing did not communicate positive COVID-19 cases to their schools quickly and at other times because of delays in sending notification notices.
The continuously shifting COVID-19 policies also changed the responsibilities and workflow for school leaders. School leaders often had to handle the coordination of policies across their school. Instead of focusing on coaching or advising on instruction, the share of the work done, as identified in school leader interviewed, weighed more heavily on navigating COVID-19 protocols than on student attendance or learning.
Family engagement
During virtual learning in school year 2020-21, parents had a front-row view of their children’s education. Upon students’ return to in-person learning, many parents found themselves experiencing the complete opposite. Every school leader interviewed described how the return to in-person learning was complicated by COVID-19 protocols, one of which meant that parents were not allowed to enter their children’s school building. This reversal was difficult during a year when many schools were attempting to rebuild trust with parents and provide reassurance that their school was taking COVID-19 protocols seriously.
Schools approached family engagement in a few different ways. Several schools continued partnerships with the Flamboyan Foundation, a local foundation with a focus on family engagement, and conducted home visits—either virtually or in-person—prior to and during the school year.
One school offered a virtual tour of the school to show parents all the COVID-19 strategies that the school was utilizing. Several schools hosted outdoor events. All schools tried different communication initiatives such as assigning one staff member to a group of families to hold individualized phone calls or continuing virtual communication platforms that had started in the previous school year.
“Parents couldn’t come into the building, even for arrival. It means a lot for parents to walk their kids in and see their classroom. It strengthens their relationship with the school and families. This year is really different because they’ve brought back parents walking to classrooms… It’s a priority to make everyone feel welcome in their space, strengthening relationships, and galvanizing staff to make the school feel more welcoming.”
Miriam Darby
Principal, KIPP DC Heights Academy
“The goal of schools is to provide a great education to students that reflects what their families aspire for them. When I think about what it means for an organization that prioritizes DEI, we are responsible for elevating the voices of families. We partner with families because they are the people who know more about their child than anyone else.”
Laura Maestas
Chief Executive Officer, DC Prep
“Prior to COVID, we never conducted virtual home visits or conferences. We soon realized that virtual options were easier for some of our parents and increased their ability to engage with us. We’ve learned we need to be open to options like these, and we’re going to be in the mindset and mode going forward where we just want your presence! If it can’t be in-person, then join us virtually—let’s figure out whatever works.”
Rachel Tommelleo
Principal, Center City PCS-Brightwood
Student experience
Changes to the student experience in school year 2021-22 extended beyond the impacts of pandemic recovery efforts and ESSER spending. Students also experienced lower attendance, fewer out-of-school suspensions, more community violence, and ongoing staff shortages.
Attendance
In school year 2021-22, attendance requirements returned to pre-pandemic standards: OSSE adopted in-person instruction as the default mode of attendance, with six hours of instruction per day. There were also new virtual learning requirements: schools were mandated to provide six hours of instruction per day, even in the event of school closures related to COVID-19, and for students who needed to quarantine.5455 This policy presented challenges as schools navigated how best to provide instruction for students who must remain at home in quarantine.
These changes meant that students had to adjust to more stringent attendance policies during school year 2021-22 after having spent less time in school the previous year. Attendance suffered. Chronic absenteeism, or students who were absent for 10 percent or more of the school year, soared to 48 percent in school year 2021-22, up from 29 percent in school year 2018-19 (see Figure 22). This rise in absenteeism was in part due to quarantines—either through exposures in school, or through families instituting quarantines after an outbreak outside of school.
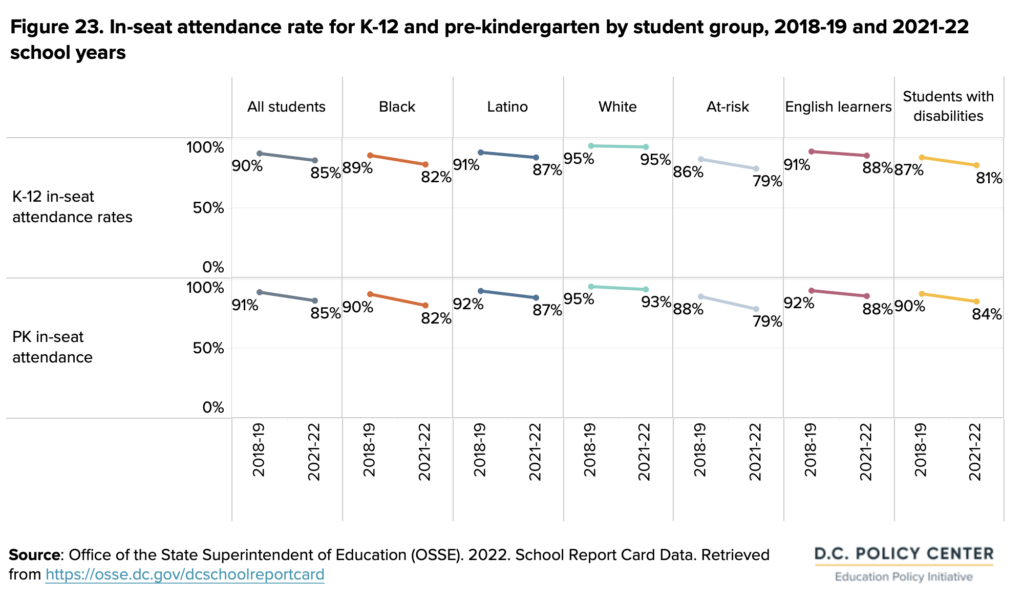
Alongside the increase in chronic absenteeism, in-seat attendance rates for kindergarten through grade 12 students declined to 85 percent in school year 2021-22, down from 90 percent in school year 2018-19 (see Figure 23). In-seat attendance rates (and declines from pre-pandemic levels) were similar for pre-kindergarten students, even though this is not a compulsory age for school. Many school leaders expressed that families and students appeared to attach less importance to attendance or demanded more flexibility in attendance policies that mimicked the policies during virtual learning.
Some school leaders described how difficult it was to spur attendance—despite increased efforts, including celebrations or awards for those who came to school. Schools also had intervention policies for those who were chronically absent, and all school leaders identified more intensive practices such as calling and emailing parents to learn more about the context for absenteeism. However, several school leaders shared that enforcement of attendance policies was a lower priority during the school year, and that they were instead focused on rebuilding trust and relationships with families after a year of virtual learning. School leaders used words like “grace” and “leniency” to describe their approach.
Discipline and school safety
School year 2021-22 is the first year when LEAs and students had to navigate in-person the new out-of-school suspension policies from the Student Fair Access to School Amendment Act of 2018, which aimed to reduce the use of exclusionary discipline, such as out-of-school suspensions, for D.C.’s public schools.56 That legislation established that out-of-school suspension and disciplinary unenrollment were no longer allowed except in cases where a student can be determined to have willfully caused or attempted to cause bodily harm or emotional distress to another student. Additionally, the statute places limitations on the length of time that a student may be subject to out-of-school suspension.57
“[Pre-COVID] we were already in a place where we had shifted our discipline to focus on restorative practices. Last year, using these practices was especially important. We have to be empathetic to what our kids have gone through and doing that well requires a step away from a ‘no excuses culture’. If something happens, we’re employing consequences that make sense, getting at the why of why this is happening, and helping to restore any harm that may have been done. We’ve seen a positive shift in our school culture because of this.”
Rachel Tommelleo
Principal, Center City PCS-Brightwood
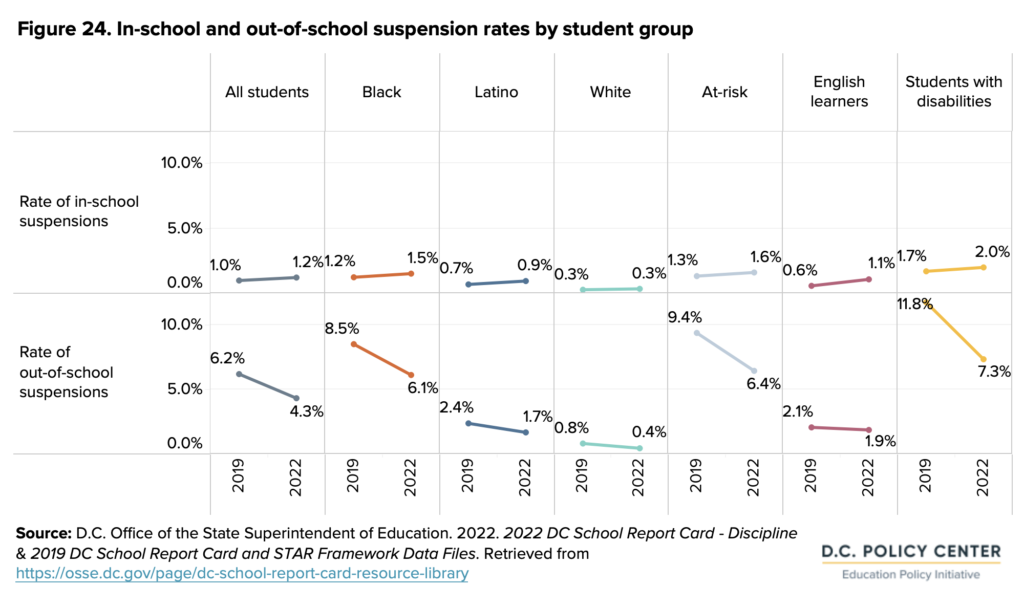
Discipline rates by subgroup and data on incidents. Likely connected to the updated discipline policies that prohibited most out-of-school suspensions, the rate of out-of-school suspensions decreased to 4 percent for school year 2021-22 from 6 percent in school year 2018-19 (the last pre-pandemic school year under the former policy). The rate of in-person suspensions stayed the same (see Figure 24).
Community safety. In addition to safety while at school, student safety while commuting is a concern for many students. Many report that they do not feel safe during their commute to and from school.58 Feelings of safety relate to student attendance: 8 percent of D.C.’s high school students reported that they did not go to school during the fall of 2021 because they felt unsafe at school or on their way to or from school. This share is higher for students who are Black or Latino (9 percent) than for students who are white (3 percent).59
Data also suggest that female students are more concerned for their safety during their trips to and back from their schools. In a student survey conducted by the Office of the Student Advocate in spring of 2022, 39 percent of female students reported experiencing unwanted attention or interactions during their commute. Nineteen percent of male students reported the same.60
Students who live in Wards 7 and 8 also tend to have a longer commute to school, making safety while commuting more of a concern. Across all grade bands, students in Ward 7 and Ward 8 travel, on average, more than three miles to get to school, a mile more than students living in D.C.’s other six wards.61
WHAT PARENTS ARE SAYING
A PAVE survey conducted in the fall of 2021 found that more than 35 percent of parents worry “all the time” about their child’s physical safety and 25 percent worry “all the time” about their proximity to community violence.62
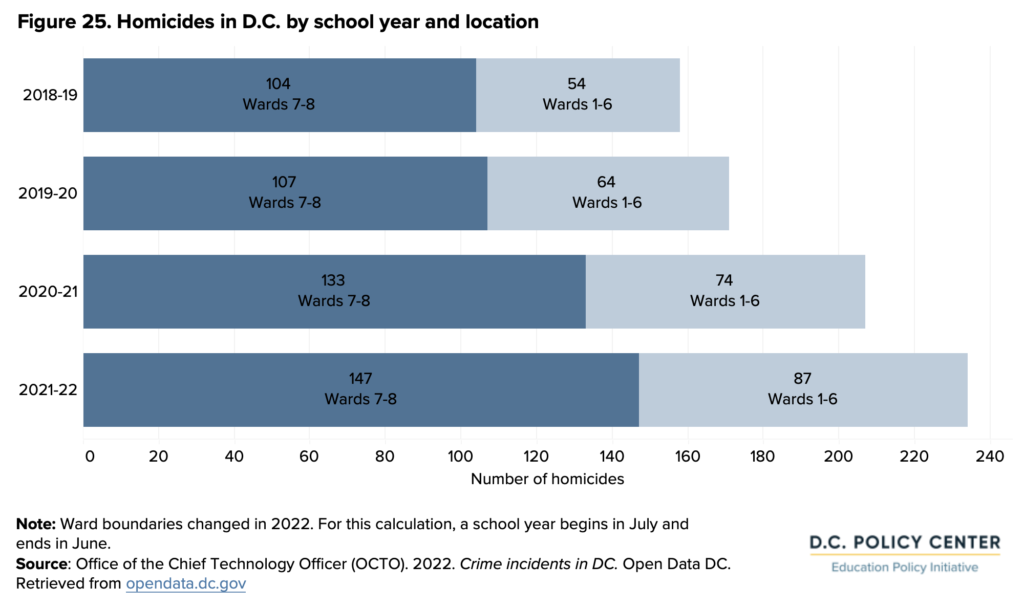
These concerns about community safety were accompanied by another year of increase in violent crime in the District. In school year 2021-22, homicides were up 13 percent over the previous school year. Homicides were disproportionately concentrated in Wards 7 and 8, where 63 percent of the total occurred (see Figure 25). Although these homicides did not occur at school, violent crime close-to-home has been shown to have a negative impact on attendance in D.C.63
Safe Passage to School
D.C.’s Safe Passage Program, which places trusted adults from the community along specific routes to ensure that students get to and from school safely, is one way the city has addressed student safety while commuting.64
Across D.C., 47 schools participate in the program, and Mayor Bowser’s 2021 budget allocated more than $4.3 million during Fiscal Year 2022 to organizations in the community to hire at least 215 more Safe Passage workers. The program is primarily based in Wards 5, 7, and 8, with several schools added more recently in Ward 4. It is very difficult to know the extent to which this program makes communities safer, with some schools and families reporting a positive impact and others asking for more intensive services.65
To complement safe passage routes, the Mayor’s office issued $6.2 million during FY22 to launch DC School Connect, a shuttle service focused on Wards 7 and 8 for some students in grades 1-12.
Teachers
The number of teachers in D.C. is on the rise, but there are disproportionately more white teachers than Black and Latino teachers compared to the city’s student population. And even though teacher retention improved, it was difficult to hire new teachers.
Teacher demographics. In school year 2021-22, there were 8,151 teachers serving across D.C.’s public schools. This represents an increase of 20 percent from 6,796 teachers during the last pre-pandemic year (2019-20).
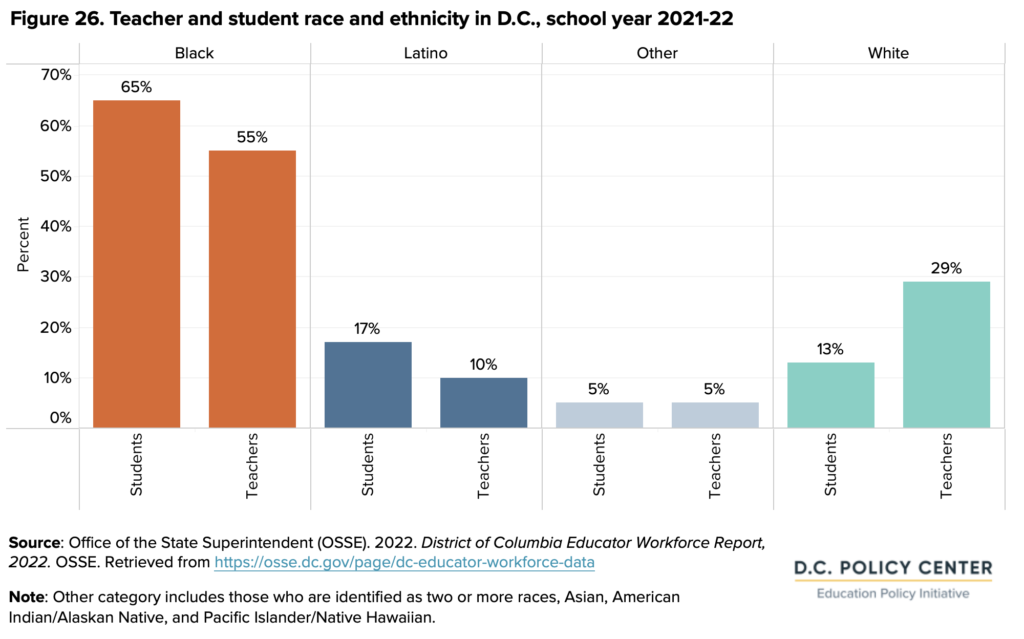
Students benefit from having access to teachers who share their race and ethnicity.66 More than half of all teachers (55 percent) were Black, compared to 65 percent of students. Twenty-nine percent were white compared to 13 percent of students, and 10 percent were Latino compared to 17 percent of students (see Figure 26). While this marks an overrepresentation of white teachers and an underrepresentation of Black and Latino teachers, D.C.’s teacher workforce does have a higher share of teachers who are Black and Latino compared to public school teachers nationwide.67
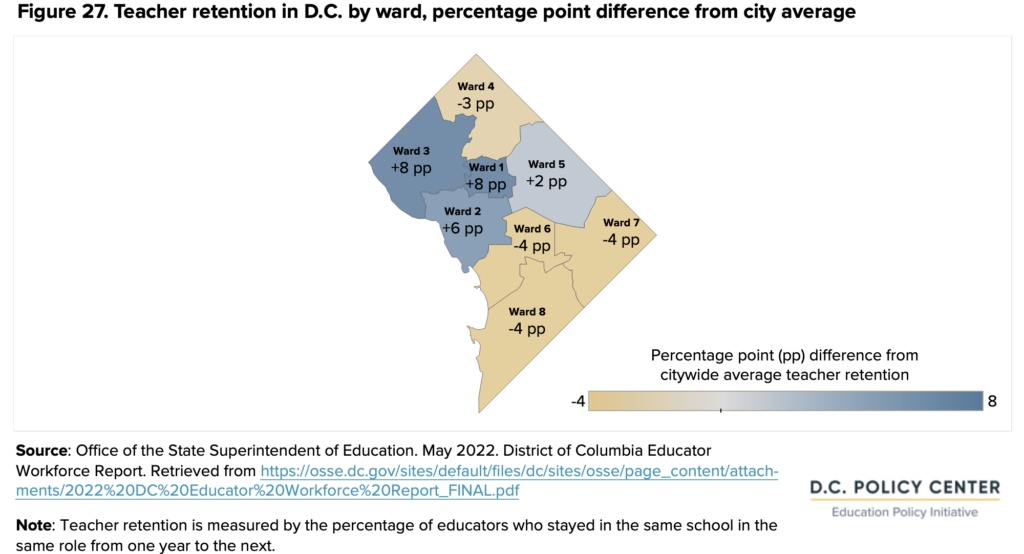
Teacher retention. In school year 2021-22, the retention rate for teachers in D.C.’s public schools, defined as the share of teachers staying in the same position type at the same school, was 74 percent,68 up from 70 percent in school year 2018-19.69An additional 14 percent of teachers stayed in D.C.’s public schools either in the same position at a different public school in D.C. (11 percent), or in a new position (3 percent). Teachers with more than 10 years’ experience and those rated effective had even higher rates of retention: 80 percent of both groups stayed in the same school in the same role. Same-school and same-role retention was also higher at schools in Wards 1, 2, and 3, and lower in other wards (see Figure 27).
Staff shortages. Although retention of existing staff was higher than in previous years, it was harder to hire new teachers. Labor market shortages related to the pandemic tripled the vacancy rate for teaching positions to 6 percent in October 2021,70 compared to 2 percent in October of 2018.71 The highest vacancy rates were seen among ELA teachers (14 percent) and teachers for career and technical education (CTE) (11 percent).
Throughout the school year, many teachers were absent from school, often due to COVID-19 quarantines. Substitutes were harder to come by when teachers were absent: there were about half as many DCPS substitutes in the first quarter of Fiscal Year 2022 (October to December of 2021) than in the first quarter of Fiscal Year 2020.72
In interviews with school leaders, navigating the staffing shortages caused by both long-term vacancies and short-term absences presented daunting challenges. During these absences, substitute teachers were often not available, so other teachers had to be called on to fill absences. Staffing shortages became so severe over the course of the year that several school leaders asked members of the central office to step in to substitute. Several school leaders described how teachers filling in for others can lead to burnout and resignations, making staff shortages even more acute.
Affecting new hiring, school leaders described how, after a year of virtual learning, teachers were looking at their own work differently. During virtual learning, teachers had experienced a more flexible work schedule, fewer incidences when they had to manage student discipline processes, and other benefits they associated with working from home, including not having to commute and generally having more control over their daily schedule. Teachers began to reevaluate other work opportunities, which school leaders report has led to resignations following schools’ return to in-person learning. In a survey of DCPS and public charter teachers conducted by the Washington Teachers Union and EmpowerEd, flexible scheduling options was ranked as the most impactful action to prevent turnover.73
4. Looking ahead to school year 2022-23
School year 2022-23 has brought some changes, including a new school-based accountability framework on the horizon for all schools, a revised attendance policy, a new preference in the common lottery for students designated as at-risk, a reconsideration of vaccine policies, and continued ESSER spending.
Amended accountability framework
For school year 2022-23, the Office of the State Superintendent for Education (OSSE) amended the accountability framework with a focus on equity with more emphasis on outcomes for economically disadvantaged students, better measures of growth in learning during high school and for English learners, and strengthening measurement of five-year graduation rates and dual enrollment participation, including other changes.74 Notably, the proposed accountability framework will remove the STAR rating that all schools currently receive as a singular calculation of school performance. Instead, OSSE will generate scores for student and school performance that will be reported at the grade band and school levels.
Attendance policy revisions
In July 2022, the State Board of Education (SBOE) and OSSE collaborated on and passed a resolution to redefine the percentage of time that students must attend school to be counted as present or absent beginning in school year 2022-23. Previously, students had to attend 80 percent of the school day to be marked as present, a policy referred to as the 80/20 rule. The new policy adopts a 60/40 rule which shifts this percentage of time present down to 60 percent of the school day. This change is designed to allow schools to spend more resources on engaging students who are absent for entire school days.75
Equitable access to schools
Starting in school year 2022-23, 24 public charter and DCPS schools offered an equitable access option for students designated as at-risk through the common lottery either through reserving seats or adding a preference. In its first year, 400 applicants received a match through the equitable access option.76 All reserved seats were in common entry grades (PK3, PK4, kindergarten, and grades 5, 6, and 9), with the majority of seats (66 percent) offered in pre-kindergarten grades.77
“Last year, a lot of programming felt different. Students couldn’t have reading time together on the carpet. They had to sit at desks all day which changes the energy of the classroom. We also couldn’t do the whole school events that create really intentional positive moments in school. This has such an impact on the school experience. Now [in 2022-23] it’s much better. Kids can partner up with their desks, read together, they don’t have to wear masks, and we can do whole school events again.”
Miriam Darby
Principal, KIPP DC Heights Academy
Vaccine policy changes
During the height of the COVID-19 crisis, many families delayed seeking preventative care, including well-child visits, which led to a decline in routine childhood vaccinations.78 As of September 2022, 25 percent of students were non-compliant in their routine pediatric vaccinations, and 46 percent of children over age 12 had not received a COVID-19 vaccine.79
Because of challenges related to making appointments and submitting proofs of vaccination, OSSE extended the deadline for enforcement several times throughout the year and ultimately delayed enforcement of the COVID-19 vaccine requirement until school year 2023-24.80
ESSER funding
Looking ahead, D.C. plans to continue expanding access to high-impact tutoring (HIT) in school year 2022-23 and to evaluate results. In fiscal years 2022, 2023, and 2024, OSSE will invest $39 million in scaling up and supporting HIT. In school year 2022-23, 61 percent of LEAs intend to provide HIT and OSSE plans to serve 4,000 students.
ESSER funds will continue to infuse the school system with a large amount of funding in a short period of time. ESSER I-CARES totals $37.8 million and ends in September 2022. ESSER II-CRRSA totals $154.8 million and ends the following September in 2023. ESSER III-ARP is more than double the previous round at $347.8 million and must be spent by September 2024.
Because this infusion happens over such a short period of time, is not clear how LEAs will sustain the programs or improvements that they have invested in from the program.
5. Conclusion
D.C. is still uncovering the full reverberations of the pandemic and its impact on student outcomes and resources.
As D.C. continues to navigate this period of immense change and uncertainty, it is necessary to continuously take stock of recovery and guide efforts toward progress and change. So far, outcomes data indicate that while the return to in-person learning and innovations for recovery represent big strides in school year 2021-22, pain points remain.
School year 2021-22 represented a big step toward recovery even while COVID-19 was still impacting day-to-day operations:
- 100 percent of students returned to in-person learning. In school year 2021-22, 100 percent of students (aside from those with medical exemptions) were expected to return for in-person learning, compared to 21 percent who experienced any weekly in-person learning in school year 2020-21.
- Schools in D.C. have received $540 million in ESSER funding. As of fall of 2022, they had spent 23 percent of these funds, with 73 percent of spending dedicated to learning acceleration.
- COVID-19 continued to impact school year 2021-22, with an average of 317 COVID-19 cases per day in D.C. and a spike of up to 2,000 cases in the winter.
- The teacher retention rate rose to 74 percent. At the same time, it was harder to hire new teachers with a fall teacher vacancy rate of 6 percent, three times higher than in the fall of 2018.
Students were still recovering socio-emotionally and figuring out how to reengage with school.
- Chronic absenteeism rose significantly.During school year 2021-22, chronic absenteeism, or the percentage of students missing 10 percent or more of the school year, rose to 48 percent (up from 29 percent in school year 2018-19).
- Mental health challenges persisted. In a national survey of health risk behaviors, the share of D.C.’s high school students who reported feeling sad or hopeless increased to 36 percent in school year 2021-22, up from 33 percent in school year 2019-20.81
Outcomes show that recovery is still incomplete.
- Test scores declined. On state assessments, the percentage of students who met or exceeded expectations in ELA dropped from 37 to 31; in math, it dropped from 31 to 19. For students designated as at-risk, the percentage of students who met or exceeded expectations in ELA dropped from 21 to 15; in math, it dropped from 16 to 6.
- Although graduation rates are up, postsecondary completions are down. In school year 2021-22, 75 percent of students graduated from high school in four years, compared to 73 percent in the previous year. It is estimated that out of every 100 ninth graders, eight will now complete postsecondary within six years of high school graduation, compared to 14 pre-pandemic.
In addition to what we already know, there is also pressure as D.C. plans for the future of education and navigates new uncertain challenges for both students and staff. The level of resources available for education will change when ESSER funds expire in 2024. For students, high school is a critical transition to evaluate, both at the beginning in grade 9 and after graduation to postsecondary or career. On staffing, although teacher retention has improved, hiring is more difficult, which could mean additional staffing challenges as current teachers leave.
With so much change and uncertainty, D.C. needs to continuously evaluate recovery efforts in the coming years, set bold goals especially around achievement and postsecondary outcomes, and make changes when things are not working. This could mean more frequent systemwide monitoring of indicators that have declined, like attendance. Or it could mean reporting new metrics, like early literacy indicators or early career outcomes. While individual LEAs and schools are already tracking indicators, up-to-date and responsive data at the systems level will give a better indication of how D.C.’s public school system is recovering and progressing toward goals.
Student priorities and perspectives
The D.C. Policy Center shared the findings from this report with a group of D.C. public high school students. Reflecting on their lived experiences, students ranked the findings by importance. Four themes about the 2021-22 school year emerged:
🎒 School safety and community violence
Students wanted to feel safe in their communities, at school, and during their commutes—but they did not.
🧠 Mental health
As they returned to in-person class after a year of virtual learning, the stress and shock of the transition took a toll on students’ mental health. Many students continued navigating household responsibilities they had shouldered during virtual learning. Others returned to the unfamiliar surroundings of different school buildings than where they had attended before the pandemic.
✅ Equitable resource distribution and access to opportunity
Students who live in Wards 7 and 8 have less access to some resources. They face greater challenges when navigating their neighborhoods, and in accessing educational opportunities.
✏ Academic performance
Academic performance was negatively impacted by virtual learning, returning to in-person classes, and COVID-19 quarantines. Challenges such as loss of family, lack of social interaction, community violence, and poor mental health contributed to the decline in academic performance.
Where students want to see investments
Reflecting on their priorities, the students we spoke to identified four areas in which they’d like to see more investments:
🚌 More and safer school transportation
Students asked for more city-provided transportation to school. They also want Safe Passage—a program that places trusted adults from the community along specific student commute routes—expanded.
❤️🩹 More quality mental health supports
Including mental health days for students who are struggling.
🧑🏫 More teachers to lessen teacher burden
Students want to see more teachers hired, to help lessen teacher burnout and decrease the need for virtual instructors.
🎭 More access to creative curriculum in all 8 wards of the city
Students requested more universal access to a broader range of curriculums, including trade-based, technology-focused, artistic, and specialty curricula.
6. Data and information sources
The D.C. Policy Center is grateful to present and analyze publicly-available data from the following key sources for this report.
DC Public Charter School Board
The DC Public Charter School Board (DC PCSB) is an independent government agency that authorizes and provides oversight to the 135 public charter schools which are managed by 69 independently-run LEAs. State of D.C. Schools references DC PCSB’s “Report on the at-risk funding and estimated next year at-risk spending plan in DC Public Charter Schools” and their high school course listings.
DC SBOE Report of the Student Advisory Committee, 2021-22
The D.C. State Board of Education’s (SBOE) Student Advisory Committee is a group of D.C. public and charter high school students who meet monthly to discuss issues related to D.C. schools. Their 2021-22 report is a summary of their main projects: a city-wide survey and work done around COVID-19.
District of Columbia Public Schools
District of Columbia Public Schools (DCPS) is the local public school system for the District of Columbia. State of D.C. Schools references resources related to how DCPS utilizes at-risk funding and a listing of AP classes offered at DCPS high schools.
Elementary and Secondary School Emergency Relief (ESSER) Funding
The Elementary and Secondary School Emergency Relief (ESSER) Fund provides emergency funds for elementary and secondary schools in response to COVID-19. Funds are awarded by the U.S. Department of Education and administered by OSSE. OSSE provides resources for grant applicants and reports funding allocations for the three rounds of funding – ESSER I-CARES, ESSER II-CRRSA, and ESSER III-ARP.
Government of the District of Columbia
The D.C. government provides information on reopening metrics, COVID-19 updates, COVID-19 guidance for schools, and vaccination data. The D.C. government also prepares a budget that includes projected student enrollment.
My School DC
My School DC is the common application and common lottery for the District’s public school options. Historic lottery data was used to examine the impact of equitable access designated seats and an equitable access preference during school year 2022-23.
Office of the Chief Technology Officer (OCTO)
The Office of the Chief Technology Officer (OCTO) is the main technology organization of the D.C. government and manages many of its Open Data initiatives. State of D.C. Schools uses the dataset “Crime incidents in D.C.” to analyze the number of homicides by ward for school years 2018-19, 2019-20, 2020-21, 2021-22.
Office of the Deputy Mayor for Education (DME) EdScape
This tool was launched in 2019 and provides interactive visualizations and downloadable datasets that cover these topics: population and students, public schools, public school facilities, enrollment patterns, and neighborhood factors. State of D.C. Schools includes information from these datasets:
- Where public school students live
- Public school enrollment by race and ethnicity
- Public school enrollment by special need categories
- Trends in enrollment by sector
- Student commute patterns
Office of the Ombudsman for Public Education Annual Report
The 2022 Annual Report from the Office of the Ombudsman for Public Education details the cases and concerns raised by families during school year 2021-22 including communication and engagement, safety, and special education. The report also includes recommendations for the State Board of Education regarding school discipline policies, IEPs, OST options for students with disabilities, and school communication.
Office of the Student Advocate 2022 Annual Report
The Office of the Student Advocate, housed within the D.C. State Board of Education, helps families navigate the public education system in D.C. by providing guidance and resources. The 2022 Annual Report includes data on the amount and type of requests for assistance, disaggregated by school sector, race/ethnicity, grade band, and ward.
Office of the State Superintendent (OSSE) District of Columbia Educator Workforce Report 2022
Released in May 2022, OSSE’s District of Columbia Educator Workforce Report details the state of the city’s educator workforce including: an education landscape snapshot, demand for teachers, educator supply and pipeline, and mobility and retention of school professionals.
OSSE District of Columbia Statewide Assessment results
OSSE publishes the results of the PARCC exam, a districtwide assessment that is administered to all students yearly. The PARCC exam was not administered during school years 2018-19 and 2019-20. This report uses data from the following school years: 2014-15, 2015-16, 2017-18, and 2021-22.
OSSE Enrollment Audits
Annually, OSSE conducts an enrollment audit to determine the number of students at each public school in the District. These files contain the audited enrollment by school and grade. State of D.C. Schools includes information from these datasets:
- 2019-20 School Year Enrollment and Data
- 2020-21 School Year Enrollment and Data
- 2021-22 School Year Enrollment and Data
OSSE Adjusted Cohort Graduation rates
OSSE published statewide graduation rates by school for DCPS and public charter schools. The process for reporting graduation requirements changed in school year 2017-18. Graduation policies changed due to COVID-19 for school years 2019-20, 2020-21, and 2021-22. State of D.C. Schools includes information from these datasets:
- 2018-19
- 2019-20
- 2020-21
- 2021-22
OSSE DC School Report Card
First published for school year 2017-18, the OSSE DC School Report Card presents key school-based information and STAR ratings for all of D.C.’s public schools. The report cards provide an overall rating and more than 150 data points to communicate how a school is doing with all of its students, in addition to information about the school itself. State of D.C. Schools includes information from these datasets:
- AP, IB, and SAT
- Discipline
- Graduation and College Enrollment
- Student Movement
Office of the State Superintendent (OSSE) Continuous Education and Health and Safety Plans
All Local Education Agencies (LEAs) in D.C. were required to complete Continuous Education Plans (CEPs) and Health and Safety Plans prior to school year 2021-22. The plans collectively included information on safe reopening, COVID-19 health protocols, student and staff wellbeing, learning acceleration, and distance learning protocols.
US Department of Education, Institute of Education Sciences, National Center for Education Statistics
The National Assessment of Educational Progress (NAEP) is a congressionally mandated large-scale assessment that measures performance in various subject areas. The most frequently tested subjects are math and reading and data is released for students in grades 4 and 8. State of D.C. Schools uses data for District of Columbia Schools for the following school years:
- School year 2008-09
- School year 2010-11
- School year 2012-13
- School year 2014-15
- School year 2016-17
- School year 2018-19
- School year 2021-22
Endnotes
- D.C. Policy Center. 2022. State of D.C. Schools, 2020-21. D.C. Policy Center. Retrieved from https://www.dcpolicycenter.org/publications/state-of-dc-schools-20-21/
- LEAs are individual school districts. In D.C., there are 69 LEAs, including District of Columbia Public Schools (DCPS) and 68 public charter LEAs that function as independently run nonprofit organizations.
- DC Office of the State Superintendent of Education (OSSE). 2022. District of Columbia Educator Workforce Report. OSSE. Retrieved from https://osse.dc.gov/sites/default/files/dc/sites/osse/page_content/attachments/2022%20DC%20Educator%20Workforce%20Report_FINAL.pdf
- DC Office of the State Superintendent of Education (OSSE). 2022. District of Columbia Educator Workforce Report. OSSE. Retrieved from https://osse.dc.gov/sites/default/files/dc/sites/osse/page_content/attachments/2022%20DC%20Educator%20Workforce%20Report_FINAL.pdf
- DC Office of the State Superintendent of Education (OSSE). 2023. DC Youth Risk Behavior Survey (YRBS). Retrieved from https://osse.dc.gov/service/dc-youth-risk-behavior-survey-yrbs
- Mikva Challenge is a student advocacy non-profit.
- DC Office of the State Superintendent of Education (OSSE). 2021. DCPS – SY2021-22 Continuous Education Plan. Retrieved from https://osse.dc.gov/sites/default/files/dc/sites/osse/page_content/attachments/LEA_2021_CE%26SRP_District%20of%20Columbia%20Public%20Schools_District%20of%20Columbia%20Public%20Schools.pdf
- Coffin, C. and Rubin, J. 2022. Declining births and lower demand: Charting the future of public school enrollment in D.C. D.C. Policy Center. Retrieved from https://www.dcpolicycenter.org/publications/enrollment-decline/
- Rubin, J. and Coffin, C. 2022. D.C.’s changing public school enrollment: Trends by ward. D.C. Policy Center. Retrieved from https://www.dcpolicycenter.org/publications/trends-by-ward/
- The D.C. Policy Center report, Declining births and lower demand: Charting the future of public school enrollment in D.C. goes into greater explanation of these factors. Coffin, C. and Rubin, J. 2022. Declining births and lower demand: Charting the future of public school enrollment in D.C. D.C. Policy Center. Retrieved from https://www.dcpolicycenter.org/publications/enrollment-decline/
- Coffin, C. and Rubin, J. 2022. Declining births and lower demand: Charting the future of public school enrollment in D.C. D.C. Policy Center. Retrieved from https://www.dcpolicycenter.org/publications/enrollment-decline/
- D.C. Policy Center. 2022. 2022 State of Business Report: Doing Business Under the New Normal. DC Chamber of Commerce. Retrieved from https://www.dcpolicycenter.org/publications/2022-business-report-executive-summary/
- The number of students who are SNAP eligible increased by one percent from school year 2020-21 to school year 2021-22 and the number of those who are TANF eligible increased by 2 percent over the same time period–an increase of approximately 450 and 500 students respectively. LEAs with fewer than 10 students in any category were not included in the analysis. For more information, visit: DC Office of the State Superintendent of Education (OSSE). 2022. Council oversight hearings, FY21 Question 56 – At-risk students. Retrieved from https://www.dropbox.com/sh/a9c91dqy6nmas9t/AADU5A-SP3yPXC7qPFA_K06ma/.2022%20Past%20Hearings/3.3.22%20Performance%20(Education%20Government)/OSSE/2022%20OSSE%20Performance%20Attachments?dl=0&subfolder_nav_tracking=1
- While the number of students who were identified as English learners increased by 4 percent between the two school years, the number of students who exited English learner status, referred to as “monitored students”, decreased by 22 percent. For more information, visit: DC Office of the State Superintendent of Education (OSSE). 2022. Council oversight hearings, FY21 Question 44–English Language Learners. Retrieved from https://www.dropbox.com/sh/a9c91dqy6nmas9t/AADU5A-SP3yPXC7qPFA_K06ma/.2022%20Past%20Hearings/3.3.22%20Performance%20(Education%20Government)/OSSE/2022%20OSSE%20Performance%20Attachments?dl=0&preview=Q44+-+English+Learners.xlsx&subfolder_nav_tracking=1
- Baird, A.S., Fragale, J. & Smith, D. 2021. D.C.’s adult learners during the pandemic: Results from the Fall 2020 survey. D.C. Policy Center. Retrieved from https://www.dcpolicycenter.org/publications/adult-learners-pandemic-survey/
- Coffin, C. and Rubin, J. 2022. Declining births and lower demand: Charting the future of public school enrollment in D.C. D.C. Policy Center. Retrieved from https://www.dcpolicycenter.org/publications/enrollment-decline/
- Blad, E. & Ujifusa, A. 2021. Biden Education Department Approves One Request to Cancel State Tests But Rejects Others. Education Week. Retrieved from https://www.edweek.org/policy-politics/biden-education-department-approves-one-request-to-cancel-state-tests-but-rejects-others/2021/04
- D.C. Policy Center. 2022. State of D.C. Schools, 2020-21. D.C. Policy Center. Retrieved from https://www.dcpolicycenter.org/publications/state-of-dc-schools-20-21/
- The 2022 National Assessment of Educational Progress (NAEP) is the first national standardized test release to capture some of the impacts of COVID-19. NAEP scores provide a comparison point between different cities and jurisdictions so we can place D.C. in a national context.
- OSSE is currently exploring whether this requirement should be reinstated for future school years or if the program should be reworked. For more information, visit: DC Office of the State Superintendent of Education (OSSE) and DC Public Charter School Board. Application questions for school year 2021-22 Continuous Education Plans (CEPs), 2021-22 Health and Safety Plans, and 2020-21 Assessment Data Collection. Retrieved from https://osse.dc.gov/sites/default/files/dc/sites/osse/page_content/attachments/2021-22%20Continuous%20Education%20Plans%20%28CEPs%29%20Application%20Questions_7.2.21.pdf
- DC State Board of Education (DC SBOE). 2022. DC SBOE Working Session – Meeting Minutes. Retrieved from https://simbli.eboardsolutions.com/SB_Meetings/ViewMeeting.aspx?S=9000&MID=9321&T=1
- Meghjani, T. 2020. “D.C. Voices: Transitioning to postsecondary school or the workforce during the pandemic.” D.C. Policy Center. Retrieved from https://www.dcpolicycenter.org/publications/pandemic-transition/
- Ruggles, S., Flood, S., Goeken, R., Schouweiler, M., and and Sobek, M. IPUMS USA: Version 12.0 American Community Survey 2021 1-Year Estimates. Minneapolis, MN: IPUMS, 2022. https://doi.org/10.18128/D010.V12.0
- Chatterji, R., Campbell, N., and Quirk, A. 2021. Closing advanced coursework equity gaps for all students. Center for American Progress. Retrieved from https://www.americanprogress.org/article/closing-advanced-coursework-equity-gaps-students/
- Source on AP course offerings from DCPS – District of Columbia Public Schools email communication. Data pulled from enrollment data by DCPS. 2022. The 2021 Family Guide to DCPS High School includes AP classes that were offered in the past or where a teacher may be trained. Retrieved from https://enrolldcps.dc.gov/sites/dcpsenrollment/files/page_content/attachments/SY21-22_DCPSHSBooklet_FINAL%28English%29.pdf.pdf. Source for AP course offerings from public charter schools – DC Public Charter School Board. SY21-22 Master HS Course Offerings List. Retrieved from https://dcpcsb.egnyte.com/dl/Rpe1agnP9I
- District of Columbia Public Schools (DCPS). 2022. Advanced and Enriched Instruction. Retrieved from https://dcps.dc.gov/page/advanced-and-enriched-instruction
- Benjamin Banneker High School (DCPS), Eastern High School (DCPS), and District of Columbia International School (public charter) offer the IB program. Source: My School DC – The Public School Lottery. 2022. School Finder SY2023-24. Retrieved from https://www.myschooldc.org
- Office of the State Superintendent of Education (OSSE). 2022. LEA ESSER Dashboard. Retrieved from https://osse.dc.gov/page/lea-esser-dashboard
- Office of the State Superintendent of Education (OSSE) 2022. Accelerated Learning the District for the 2021-22 School Year. Retrieved from https://osse.dc.gov/sites/default/files/dc/sites/osse/page_content/attachments/Accelerated%20Learning%20in%20the%20District%202021-22.pdf
- District of Columbia Public Schools (DCPS). 2022. “District of Columbia Public Schools Continuous Education Plan for the 2021-2022 School Year.” DCPS. Retrieved from https://dcps.dc.gov/sites/default/files/dc/sites/dcps/page_content/attachments/DCPS-2021-2022-CEP-April-2022-Update.pdf
- CityTutor DC. 2022. Establishing Roots: Implementing citywide high-impact tutoring in DC. Retrieved from https://issuu.com/citybridgeeducation/docs/final_ctdc_white_paper_2022
- PAVE. 2021. Back to School Survey Fall 2021. Retrieved from https://dcpave.org/wp-content/uploads/2021/12/FINAL-Back-to-School-Survey-Nov-2021.pdf
- The at-risk designation has a weight of 0.24, which translated to $2,981 per student added to the Uniform Per Student Funding Formula (UPSFF) in school year 2021-22. In addition, LEAs received an additional $745 (0.06 weight) for overage high school students.
- DC Public Charter School Board (DC PCSB). 2022. Report on the at-risk funding and estimated next year at-risk spending plan in DC Public Charter Schools. Retrieved from https://dcpcsb.egnyte.com/dl/HJF35Bqqdm/FY_2022_At-Risk_Report_FINAL.pdf
- District of Columbia Public Schools (DCPS). 2022. At-Risk Funding. Retrieved from https://dcpsbudget.com/budget-model/at-risk-funding/
- 28 percent of all families who called have a child with one or more disabilities. Primary topic area percentages are calculated from calls from this group. Office of the Student Advocate. Office of the Student Advocate 2022 Annual Report. Retrieved from https://studentadvocate.dc.gov/sites/default/files/dc/sites/studentadvocate.dc.gov/2022-Annual-Report-OSA.pdf
- DC Office of the Ombudsman for Public Education. 2022 Annual Report. https://educationombudsman.dc.gov/sites/default/files/dc/sites/educationombudsman/DCO%202022%20Annual%20Report.pdf
- Office of the State Superintendent of Education (OSSE0. 2022. District of Columbia Educator Workforce Report. Retrieved from https://osse.dc.gov/sites/default/files/dc/sites/osse/page_content/attachments/2022%20DC%20Educator%20Workforce%20Report_FINAL.pdf
- DC Office of the Ombudsman for Public Education. 2022. 2022 Annual Report. Retrieved from https://educationombudsman.dc.gov/sites/default/files/dc/sites/educationombudsman/DCO%202022%20Annual%20Report.pdf
- DC Office of the State Superintendent of Education (OSSE). 2022. 2021-22 Continuous Education Plans. Retrieved from https://osse.dc.gov/page/2021-22-lea-continuous-education-plans
- DC Office of the Student Advocate. 2022. Office of the Student Advocate 2022 Annual Report. Retrieved from https://studentadvocate.dc.gov/sites/default/files/dc/sites/studentadvocate.dc.gov/2022-Annual-Report-OSA.pdf
- DC Office of the State Superintendent of Education (OSSE). 2023. DC Youth Risk Behavior Survey (YRBS). Retrieved from https://osse.dc.gov/service/dc-youth-risk-behavior-survey-yrbs
- DC Office of the State Superintendent of Education (OSSE). 2023. DC Youth Risk Behavior Survey (YRBS). Retrieved from https://osse.dc.gov/service/dc-youth-risk-behavior-survey-yrbs
- Student Advisory Committee for the DC State Board of Education. Annual Report for School Year 2021-22. Retrieved from https://sboe.dc.gov/sites/default/files/dc/sites/sboe/publication/attachments/2022-07-20-Report-FINAL-SY2021%E2%80%9322%20SAC%20Annual%20Report.pdf
- DC Office of the State Superintendent of Education (OSSE). 2022. Supporting mental health in schools. Retrieved from https://osse.dc.gov/page/supporting-mental-health-schools
- Department of Behavioral Health. 2022. Updated CBO and DBH Clinicians Master List. Retrieved from https://dbh.dc.gov/node/1500291
- Rubin, J. 2022. D.C. Voices: D.C. schools ramped up mental health resources during the pandemic. How well do these services address student needs? D.C. Policy Center. Retrieved from https://www.dcpolicycenter.org/publications/dc-voices-mental-health-services-for-students/
- This means that school-based staff assess students’ needs based on whether their needs are aligned to Tier 1, which is general instruction that all students receive, Tier 2, more targeted interventions, or Tier 3, more intensive and individualized interventions. Students at all tiers may be connected to school-based mental health staff or with external partner organizations depending on their needs.
- DC Office of the State Superintendent of Education (OSSE). 2022. 2021-22 Continuous Education Plans. Retrieved from https://osse.dc.gov/page/2021-22-lea-continuous-education-plans
- District of Columbia Public Schools. 2022. 2022 Panorama Survey Report. Panorama Survey. Retrieved from https://dcps.dc.gov/surveys
- “Loved” measures sense of belonging, “challenged” measures level of rigorous expectations, and “prepared” is a combination of perseverance, self-management, and self-efficacy. District of Columbia Public Schools. 2022. 2022 Panorama Survey Report. Panorama Survey. Retrieved from https://dcps.dc.gov/surveys
- Food and Drug Administration. 2021. FDA authorizes Pfizer-BioNTech COVID-19 vaccine for emergency use in children 5 through 11 years of age. Retrieved from https://www.fda.gov/news-events/press-announcements/fda-authorizes-pfizer-biontech-covid-19-vaccine-emergency-use-children-5-through-11-years-age
- Government of the District of Columbia and District of Columbia Public Schools. 2021. “Back to School Update”. Government of the District of Columbia, Muriel Bowser, Mayor. Retrieved from https://coronavirus.dc.gov/sites/default/files/dc/sites/mayormb/release_content/attachments/Back-to-School-Updated-Presentation_8-18-2021.pdf
- DC Office of the State Superintendent of Education (OSSE). 2022. Guidance: Collecting attendance for the 2021-22 School Year. Retrieved from https://osse.dc.gov/sites/default/files/dc/sites/osse/page_content/attachments/Attendance_Guidance_SY2021-22_FINAL.pdf
- DC Office of the State Superintendent of Education (OSSE). 2022. Guidance: Collecting attendance for the 2021-22 School Year. Retrieved from https://osse.dc.gov/sites/default/files/dc/sites/osse/page_content/attachments/Attendance_Guidance_SY2021-22_FINAL.pdf
- DC Office of the State Superintendent of Education (OSSE). 2022. State of Discipline – 2020-21 School Year. Retrieved from https://osse.dc.gov/sites/default/files/dc/sites/osse/page_content/attachments/2020-21%20Discipline%20Report_FINAL_0.pdf
- The limits are 5 consecutive days for K-5 students, 10 consecutive days for students in grades 6-12, and 20 cumulative days per school year for all students. DC Office of the State Superintendent of Education (OSSE). 2021. 2021-22 School Year LEA Discipline Data Collection Guidance. Student Discipline Data Collection Guidance. Retrieved from https://osse.dc.gov/publication/student-discipline-data-collection-guidance
- D.C. State Board of Education. 2021. “ D.C. Board of Education Focuses on Safe Passage” Retrieved from https://sboe.dc.gov/fr/node/1559101
- DC Office of the State Superintendent of Education (OSSE). 2023. DC Youth Risk Behavior Survey (YRBS). Retrieved from https://osse.dc.gov/service/dc-youth-risk-behavior-survey-yrbs
- DC Office of the Student Advocate. 2022. Office of the Student Advocate 2022 Annual Report. Retrieved from https://studentadvocate.dc.gov/sites/default/files/dc/sites/studentadvocate.dc.gov/2022-Annual-Report-OSA.pdf
- Brown, A. 2022. D.C. Voices: Safe Passage program and student commutes. D.C. Policy Center. Retrieved from https://www.dcpolicycenter.org/publications/safe-passage/
- PAVE. 2021. Back to School Survey Fall 2021. Retrieved from https://dcpave.org/wp-content/uploads/2021/12/FINAL-Back-to-School-Survey-Nov-2021.pdf
- DC Office of the State Superintendent of Education (OSSE). 2019. District of Columbia Attendance Report: School Year 2018-19. OSSE. Retrieved from https://osse.dc.gov/publication/dc-attendance-report-2018-19-school-year
- Brown, A. 2022. D.C. Voices: Safe Passage program and student commutes. D.C. Policy Center. Retrieved from https://www.dcpolicycenter.org/publications/safe-passage/
- Lumpkin, L. and Davies, E. 2023. “Critics of D.C.’s ‘Safe Passage’ question if school commutes are safer.” The Washington Post, 29 January 2023. Retrieved from https://www.washingtonpost.com/education/2023/01/29/dc-schools-safe-passage-school-commute/
- Figlio, D. 2017. The importance of a diverse teaching force. The Brookings Institution. Retrieved from https://www.brookings.edu/research/the-importance-of-a-diverse-teaching-force/
- Note: Data are from 2017-18, the last year that nationwide data is reported from NCES. In that year, 7 percent of teachers were Black, 9 percent of teachers were Latino, and 79 percent of teachers were white. National Center for Education Statistics. 2020. National Teacher and Principal Survey. Retrieved from https://nces.ed.gov/surveys/ntps/tables/ntps1718_fltable01_t1s.asp
- DC Office of the State Superintendent of Education (OSSE). 2022. District of Columbia Educator Workforce Report. OSSE. Retrieved from https://osse.dc.gov/sites/default/files/dc/sites/osse/page_content/attachments/2022%20DC%20Educator%20Workforce%20Report_FINAL.pdf
- DC Office of the State Superintendent of Education (OSSE). 2019. District of Columbia Teacher Workforce Report. OSSE. Retrieved from https://osse.dc.gov/sites/default/files/dc/sites/osse/page_content/attachments/DC%20Educator%20Workforce%20Report%2010.2019.pdf
- DC Office of the State Superintendent of Education (OSSE). 2022. District of Columbia Educator Workforce Report. OSSE. Retrieved from https://osse.dc.gov/sites/default/files/dc/sites/osse/page_content/attachments/2022%20DC%20Educator%20Workforce%20Report_FINAL.pdf
- DC Office of the State Superintendent of Education (OSSE). 2019. District of Columbia Teacher Workforce Report. OSSE. Retrieved from https://osse.dc.gov/page/dc-educator-workforce-data
- DC Office of the State Superintendent of Education (OSSE). 2022. District of Columbia Educator Workforce Report. OSSE. Retrieved from https://osse.dc.gov/sites/default/files/dc/sites/osse/page_content/attachments/2022%20DC%20Educator%20Workforce%20Report_FINAL.pdf
- Washington Teachers Union and EmpowerEd. 2021-22. DC Educator Survey. Retrieved from https://www.weareempowered.org/uploads/2/6/1/4/2614188/dc_educator_survey_results_show_plummeting.pdf
- DC Office of the State Superintendent of Education (OSSE). 2022. Every Student Succeeds Act. Retrieved from https://osse.dc.gov/essa
- DC State Board of Education (DC SBOE). State Board of Education resolution to approve the District of Columbia’s amendments to the compulsory education and school attendance regulations SR22-3. SBOE. Retrieved from https://sboe.dc.gov/sites/default/files/dc/sites/sboe/publication/attachments/2022-07-20-SR22-3-SIGNED-To%20Approve%20the%20District%20of%20Columbia%E2%80%99s%20Amendments%20to%20the%20Compulsory%20Education%20and%20School%20Attendance%20Regulations.pdf
- Coffin, C. 2022. Chart of the week: Equitable access seat matches in D.C.’s common lottery for school enrollment. D.C. Policy Center. Retrieved from https://www.dcpolicycenter.org/publications/equitable-access-seat-matches-in-dc-common-lottery-for-school-enrollment/
- Coffin, C. 2022. Chart of the week: Equitable access seat matches in D.C.’s common lottery for school enrollment. D.C. Policy Center. Retrieved from https://www.dcpolicycenter.org/publications/equitable-access-seat-matches-in-dc-common-lottery-for-school-enrollment/
- Meghjani, T. 2021. D.C. Voices: Data suggest a decline in routine vaccines during COVID-19. D.C. Policy Center. Retrieved from https://www.dcpolicycenter.org/publications/routine-vaccinations/
- Lumpkin, L. 2022. Thousands of D.C. Students still behind on vaccinations as deadline looms. Washington Post. Retrieved from https://www.washingtonpost.com/education/2022/10/07/dc-schools-vaccination-requirement/
- The enforcement of pediatric immunizations remained as a requirement. DC Office of the State Superintendent of Education (OSSE). Letter to LEA leaders – vaccination enforcement update. Retrieved from https://osse.dc.gov/sites/default/files/dc/sites/osse/page_content/attachments/FINAL_COVID%20Vaccination%20Enforcement%20Delay%20Letter_11.10.22.pdf
- DC Office of the State Superintendent of Education (OSSE). 2023. DC Youth Risk Behavior Survey (YRBS). Retrieved from https://osse.dc.gov/service/dc-youth-risk-behavior-survey-yrbs