
The D.C. Policy Center’s State of D.C. Schools, 2018-19 report highlighted where D.C.’s traditional public and public charter schools have made progress as well as where targeted improvements are still necessary. Learning outcomes can be examined in the same way – student achievement on D.C.’s state assessment is on the rise, but large achievement gaps persist between student groups. A close analysis of achievement gaps shows that the city is a long way from every student reaching his or her full potential.
Achievement gaps in D.C.
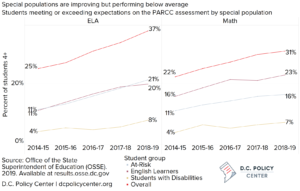
Between school years 2014-15 and 2018-19, overall student performance on the PARCC state assessment[1] improved significantly in both subjects with the share of students meeting or exceeding expectations increasing by 12 percentage points in English Language Arts (ELA) and 9 percentage points in Math. The share of students meeting or exceeding expectations in six subgroups (Black, Latino, and white students, as well as at-risk students,[2] English learners, and students with disabilities) increased as well, with Latino students showing the greatest growth: 15 percentage points in ELA and 11 points in Math. These gains are noteworthy and an important demonstration of progress in the District, but this success is tempered by persistent achievement gaps.
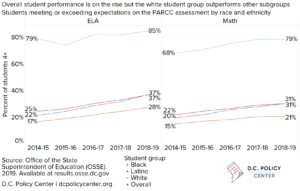
In the D.C. Policy Center’s State of D.C. Schools report, achievement gaps were measured as the difference in test scores between the student group of interest and the highest-scoring student group, which was white students in D.C. in school year 2018-19. This method of measurement conveys the large and consistent disparity in performance between white students – who only represented 12 percent of pre-kindergarten to grade 12 students last school year – and other subgroups.
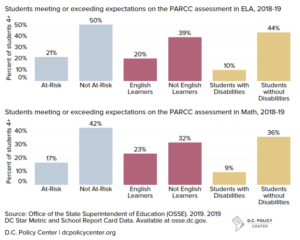
Another method of measuring achievement gaps is by comparing subgroups to their counterparts (for example, the difference between outcomes for at-risk students and not at-risk students). This method provides valuable insights, especially when used to examine gaps for at-risk students, English learners, and students with disabilities. Since these groups may include white students, comparing them to the white student group as done in the method mentioned above isn’t as direct a measurement. In 2018-19, students with disabilities exhibited the greatest achievement gaps: 34 percentage points wide in ELA and 27 percentage points in Math.
Achievement gaps for at-risk students in D.C.
At-risk students make up 45 percent of the public school student population in the District, but only 21 percent are meeting or exceeding expectations in ELA and only 17 percent are doing the same in Math. In the chart below, each bubble represents a school, and if the bubble is above the line, at-risk students outperform not at-risk students. 159 of the 189 schools represented on the chart below achieve better outcomes for not at-risk students than they do for at-risk students in ELA and 164 achieve better outcomes for not at-risk students than they do for at-risk students in Math. At 30 schools such as KIPP DC – Promise Academy PCS, at-risk students outperform or perform just as well as not at-risk students in ELA. 23 schools such as Whittier Education Campus achieve the same in Math.
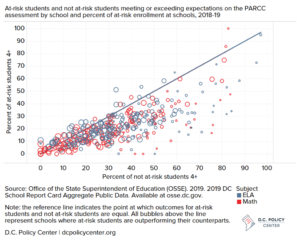
Many schools in D.C. are making progress in their efforts to close achievement gaps. Some schools – including KIPP DC – Promise Academy PCS and Whittier Education Campus – serve a high at-risk population and have combined Math and ELA proficiency rates that are dramatically higher than those of similar schools. These schools are identified by EmpowerK12 as Bold Performance Schools. Bold Improvement Schools, also identified by EmpowerK12, are those that enroll a large share of at-risk students and are closing the achievement gap at a rate that is ten times faster than other schools in the city and nationally. Finally, “leveler” schools, recognized by the D.C. Policy Center, are meeting high targets for growth in learning outcomes as defined by the state report card.
The availability of data that is disaggregated by student group on the state report card will allow us to continue monitoring achievement for at-risk students as well as for students of every subgroup. It will also allow the city to continue recognizing schools that are succeeding at improving learning outcomes for all students.
Feature photo by Ted Eytan (Source)
Tanaz Meghjani is an Education Analyst at the D.C. Policy Center’s Education Policy Initiative.
About the data
DC SCHOOL REPORT CARD RESOURCE LIBRARY
https://osse.dc.gov/page/dc-school-report-card-resource-library
First published for the 2017–18 school year, the OSSE DC School Report Card provides an overview of all DC public schools. It provides more than 150 data points to communicate how well a school is doing and how its students are performing. This post includes information from these datasets:
- 2019 DC STAR Metric and School Report Card Data
- 2019 DC STAR Framework Data
THE PARTNERSHIP FOR ASSESSMENT OF READINESS FOR COLLEGE AND CAREERS (PARCC) RESULTS
https://osse.dc.gov/page/2018-19-parcc-results-and-resources
This dataset contains the official assessment performance results for the PARCC and Multi-State Alternate Assessment tests in English Language Arts and Math. It also provides detailed information, showing multiple levels of results for specific groups of students for all grades within a school and for individual grades. This post uses information from the following datasets:
- Detailed 2018-19, 2017-18, and 2016-17 PARCC and MSAA Performance Results
- Detailed 2016-17, 2015-16, and 2014-15 PARCC and MSAA Performance Results
Notes
Discrepancies in data are due to the use of multiple sources.
[1] The Partnership for Assessment of Readiness for College and Careers (PARCC) is the District’s annual assessment of English Language Arts (ELA) and Mathematics. It measures each student’s ability to understand complex texts, engage in evidence-based writing, and problem solve – skills necessary to succeed in college and beyond.
[2] In D.C., students are considered to be at-risk for academic failure for funding purposes if they receive food stamp or public benefits, are involved in the foster care system, experience homelessness, or are over-age in high school.