APPENDIX III – METHODOLOGY AND DATA SOURCES
The analysis presented in this study relies on a combination of data sources, including administrative data from the District of Columbia government, data from private sources, and other publicly available data from the U.S. Census. The basic information on the rental stock is gleaned from the Integrated Tax System Public Extracts and housing characteristics tracked by tax assessors and made publicly available through three separate Computer Assisted Mass Appraisal (CAMA) data sets: one for residential buildings, one for condominiums, and one for commercial buildings The data are mapped using the Common Ownership Lot spatial file available from the District’s open data repository. The District’s Real Property Tax Assessment dataset tracks condominium units individually, and not entire buildings, since each condominium unit has a unique owner. These units have been compiled into different condominium buildings by using the Condo Regime file, which is also publicly available.
It is important to note that the housing and household picture presented in this report reflects the findings based on available data, but it is extremely hard to paint a completely accurate picture of housing units and households in the District due to the fluid natures of both. Characteristics of housing units change all the time, through vacancies, subdivisions, and the ways units are shared sometimes by multiple households and sometimes by a single household. Households change, too, though marriage, divorce, or other events.[1] The best we can do is take a snapshot, which is what is report does, but continuously be remindful of the limitations of such snapshots.
Also, in some cases, it is hard to reconcile Census data based on the American Community Survey with the District’s administrative data on housing. While the overall numbers of housing units estimated in this study are close to those estimated by the Census, there are bigger gaps for rental housing. This study estimates that there are approximately 207,000 units in the District, that are potentially rental, including vacancies. Of these, about 72,000 units are in the shadow rental market as according to tax records they are not owner-occupied. In contrast, the Census Bureau estimates that there are 164,000 renter households in the District. That would imply about 43,000 units are vacant at any given time. This is about 20 percent rental housing—a much higher vacancy rate than what the Census predicts (about 10 percent). Further, the vacancy rate in apartment buildings is now hovering around 7 percent. That means more than half the units in the shadow rental market not occupied by their owners are vacant. That seems like a very big number, which makes it hard to reconcile the renter household estimates by the Census with the D.C. Policy Center’s estimates of rental units. Furthermore, excluded from this count are units that operate illegally—without a Certificate of Occupancy—which would further increase the discrepancy. This author cannot offer a way of reconciling these numbers.
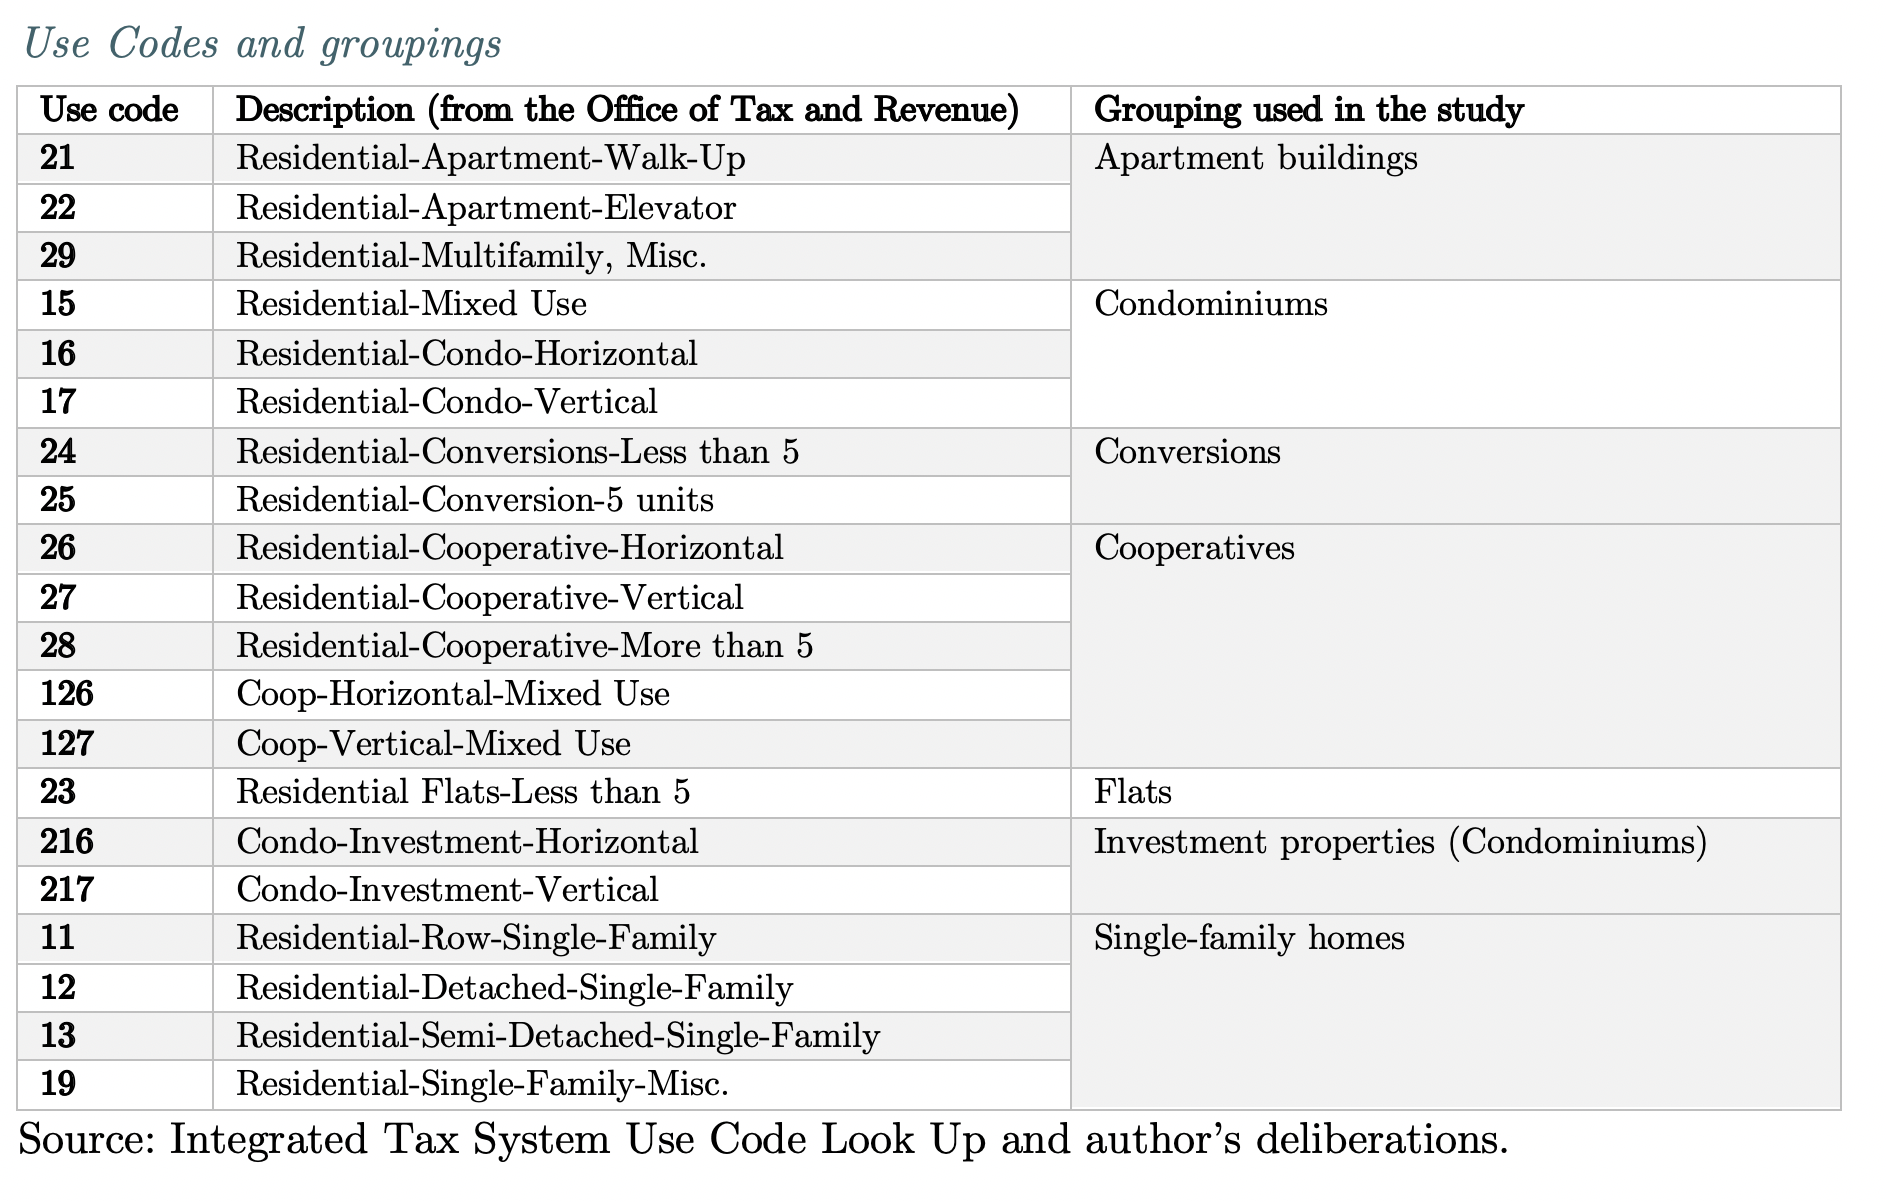
Classification of units by use type
The study uses the city’s own classification of property types to classify units into different groups of housing. The Office of Tax and Revenue assigns each tax unit a use code and a related description, which can be found in the Integrated Tax System Use Codes Lookup file available at opendata.dc.gov. The codes selected for this study, their short descriptions, and their grouping used in the study, are presented below.
Determination of rental and owner-occupied stocks
The District’s Real Property Tax Database tracks homeowners who qualify for homestead deduction, which exempts a certain amount of the value of a home from real property taxes. The Integrated Tax System Public Extract tracks these units by assigning a homestead code (HSTCODE in the database) of 1 (for homestead properties) and 5 (for homestead properties owned by low-income seniors and disabled individuals who also qualify for a tax rate cut).
The study makes the following assumptions:
- All units that do not receive a coding of 1 or 5 are potentially available for rent. This can include vacant units.
- All units in rental apartment buildings are potentially available for rent, even when they are vacant.
- All units that are in cooperatives are owner-occupied. While tax rolls do not track individual units in cooperative buildings or their occupancy status, by design, most cooperatives ban or limit rental use in their buildings.
Estimating the number of units in multi-family buildings
The real property tax database tracks taxable entities. In the case of single-family homes, the taxable entity and the housing unit are the same. However, in multi-family buildings, additional steps are necessary to estimate the total number of units in a building. The estimation process varies for condominiums, rental apartments, and cooperatives.
Each condominium unit is a separate taxable entity, so counting condominium units is relatively easy. What is necessary is to assign them to a single building. To do so, this analysis used additional data from the District’s Office of Tax and Revenue and the Office of the Chief Technology Officer. These include the Condo Regime File, which assigns units to different condominium entities; and the Condo Relate Table, which assigns the unique Square Suffix Lot (SSL) identifier for each taxable condominium to a Condo Regime identifier, and each Condo Regime to a lot in the District. The latter is done through MAT_SSL (the Approval Lot Identifier assigned by the Office of Tax and Revenue), which can then be matched with SSL each in the Common Ownership Lots spatial dataset for mapping with other types of housing. Researchers were unable to map all these condominiums using the common ownership lots. The full set of condominium buildings (including those that no longer exist) can also be mapped using the Condo Approval Lots spatial file.
For rental apartment buildings, this analysis drew on three sources of data: The first one is the Computer Assisted Mass Appraisal(CAMA) datafile for residential units, which sometimes record the number of units in each rental apartment building. CAMA data was the primary source, when available. For buildings that do not have this information in the CAMA dataset, the next source was CoStar, a private data source. But even CoStar does not have the total number of units for all buildings. When this information was not available, researchers used the Address Residential Units datafile, which is a part of the Master Address Repository, for condominiums and rental apartments. This dataset separates the street address and the unit address for each unit in a multi-family property. For condominiums, it also provides the SSL identifier but for apartment buildings, since the unit is not the taxpayer, no SSL identifier is presented. Researchers matched street addresses to estimate the number of units in a building.
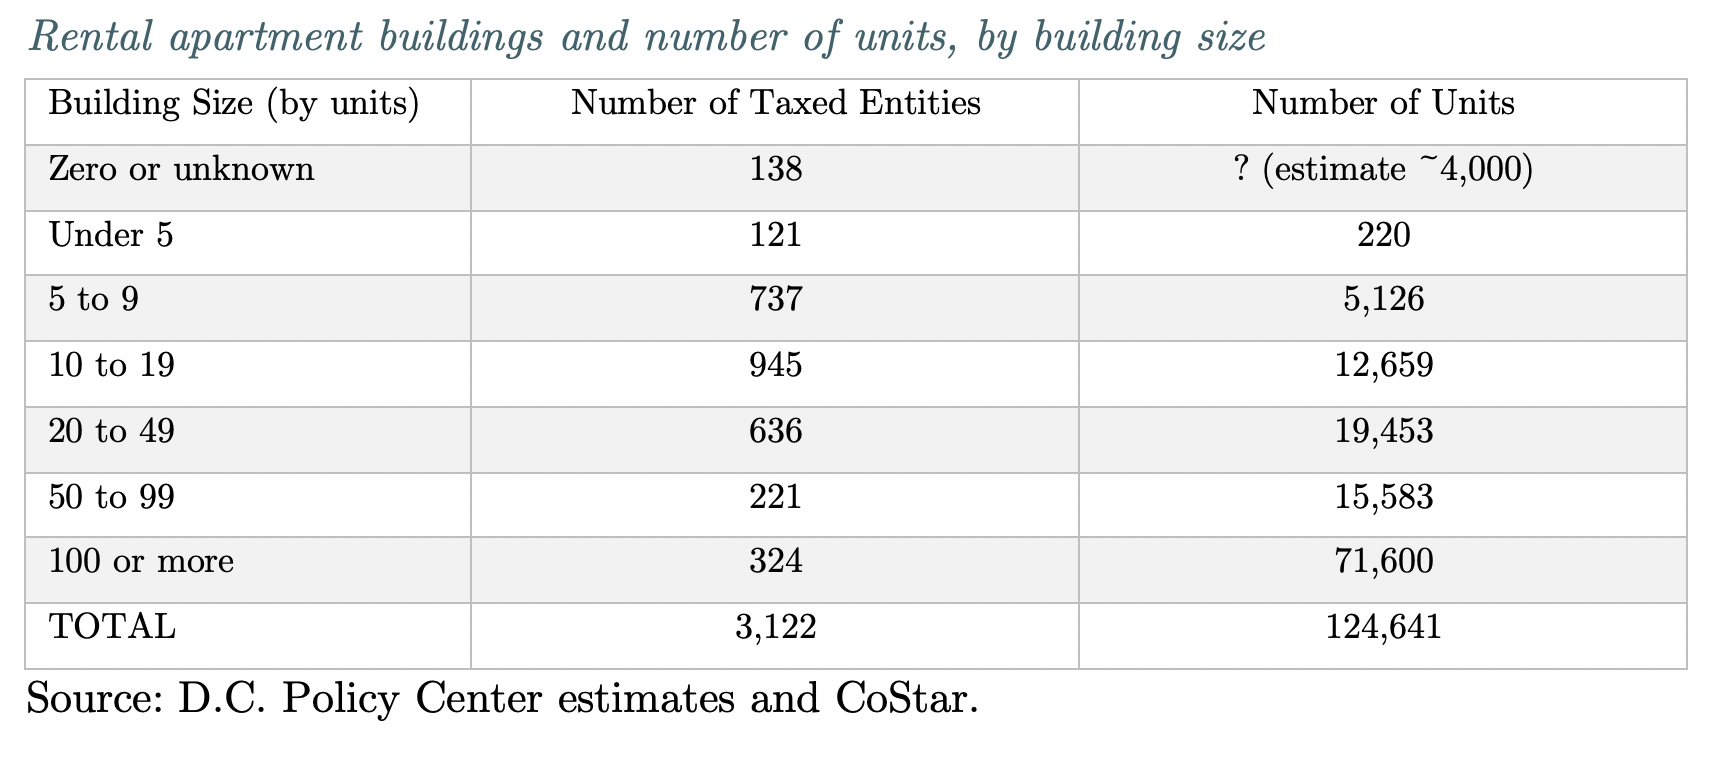
This exercise produced an estimated number of units for 2,984 of the 3,121 rental apartment buildings in the District. It is not known how many units are in the remaining 138 buildings. If these buildings are of average size, then this analysis is missing about 4,000 units.
Estimation of units by size in multi-family buildings
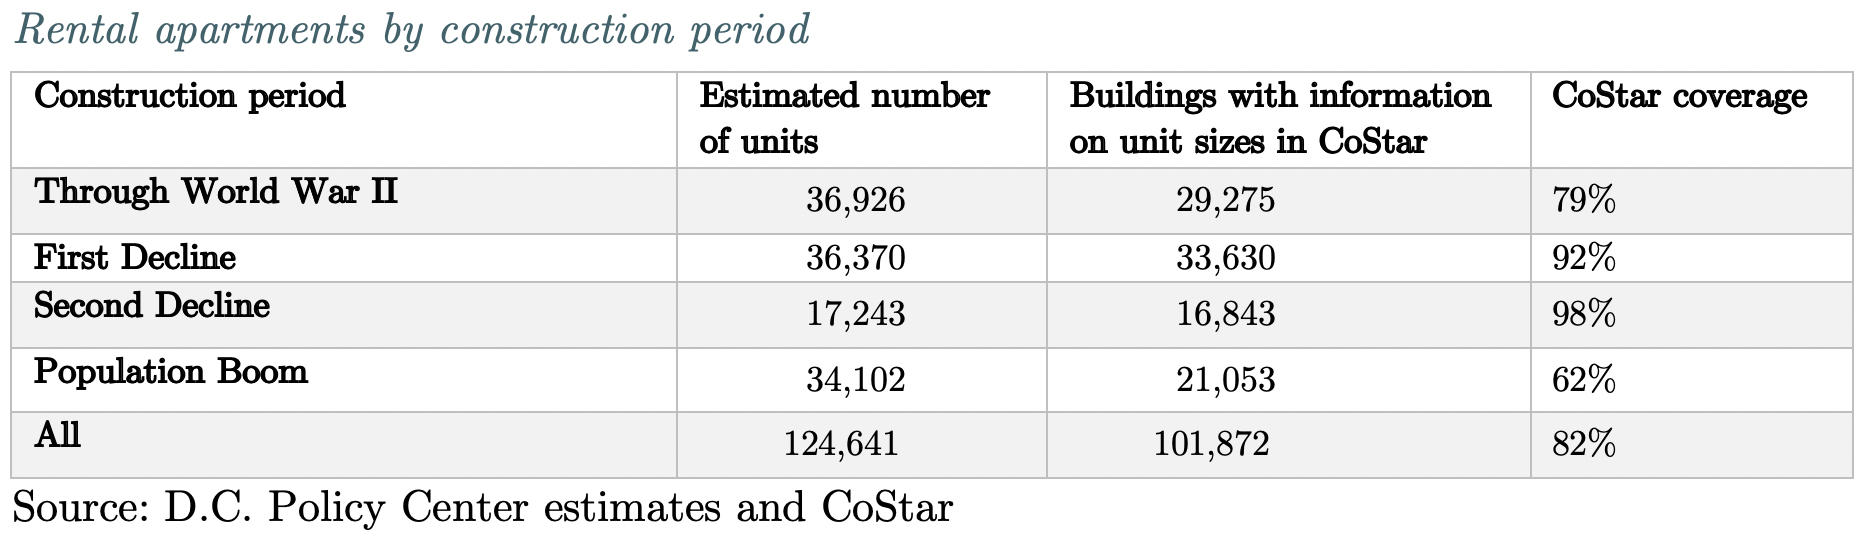
There is no administrative data on the size of units in rental apartment buildings, by number of bedrooms. For this, researchers turned to CoStar, which partially covers this information. The table below compares the number of units estimated through the methodology described in the previous section, and the number of units for which CoStar has bedroom information. Overall, researchers were able to estimate the data on the number of bedrooms for 82 percent of all rental apartment units. However, this share changes over different periods. For buildings built before World War II, data are available for 79 percent of all units. The information is more robust for the two periods of decline with information on the number of bedrooms in units covering 92 percent and 98 percent of total number of units respectively for the First Decline and the Second Decline periods. The data are thinnest for the buildings built since 2000. For this period, an estimated 34,100 units have been constructed, but information on bedroom sizes is only available for 21,000 units, or 62 percent of the total.
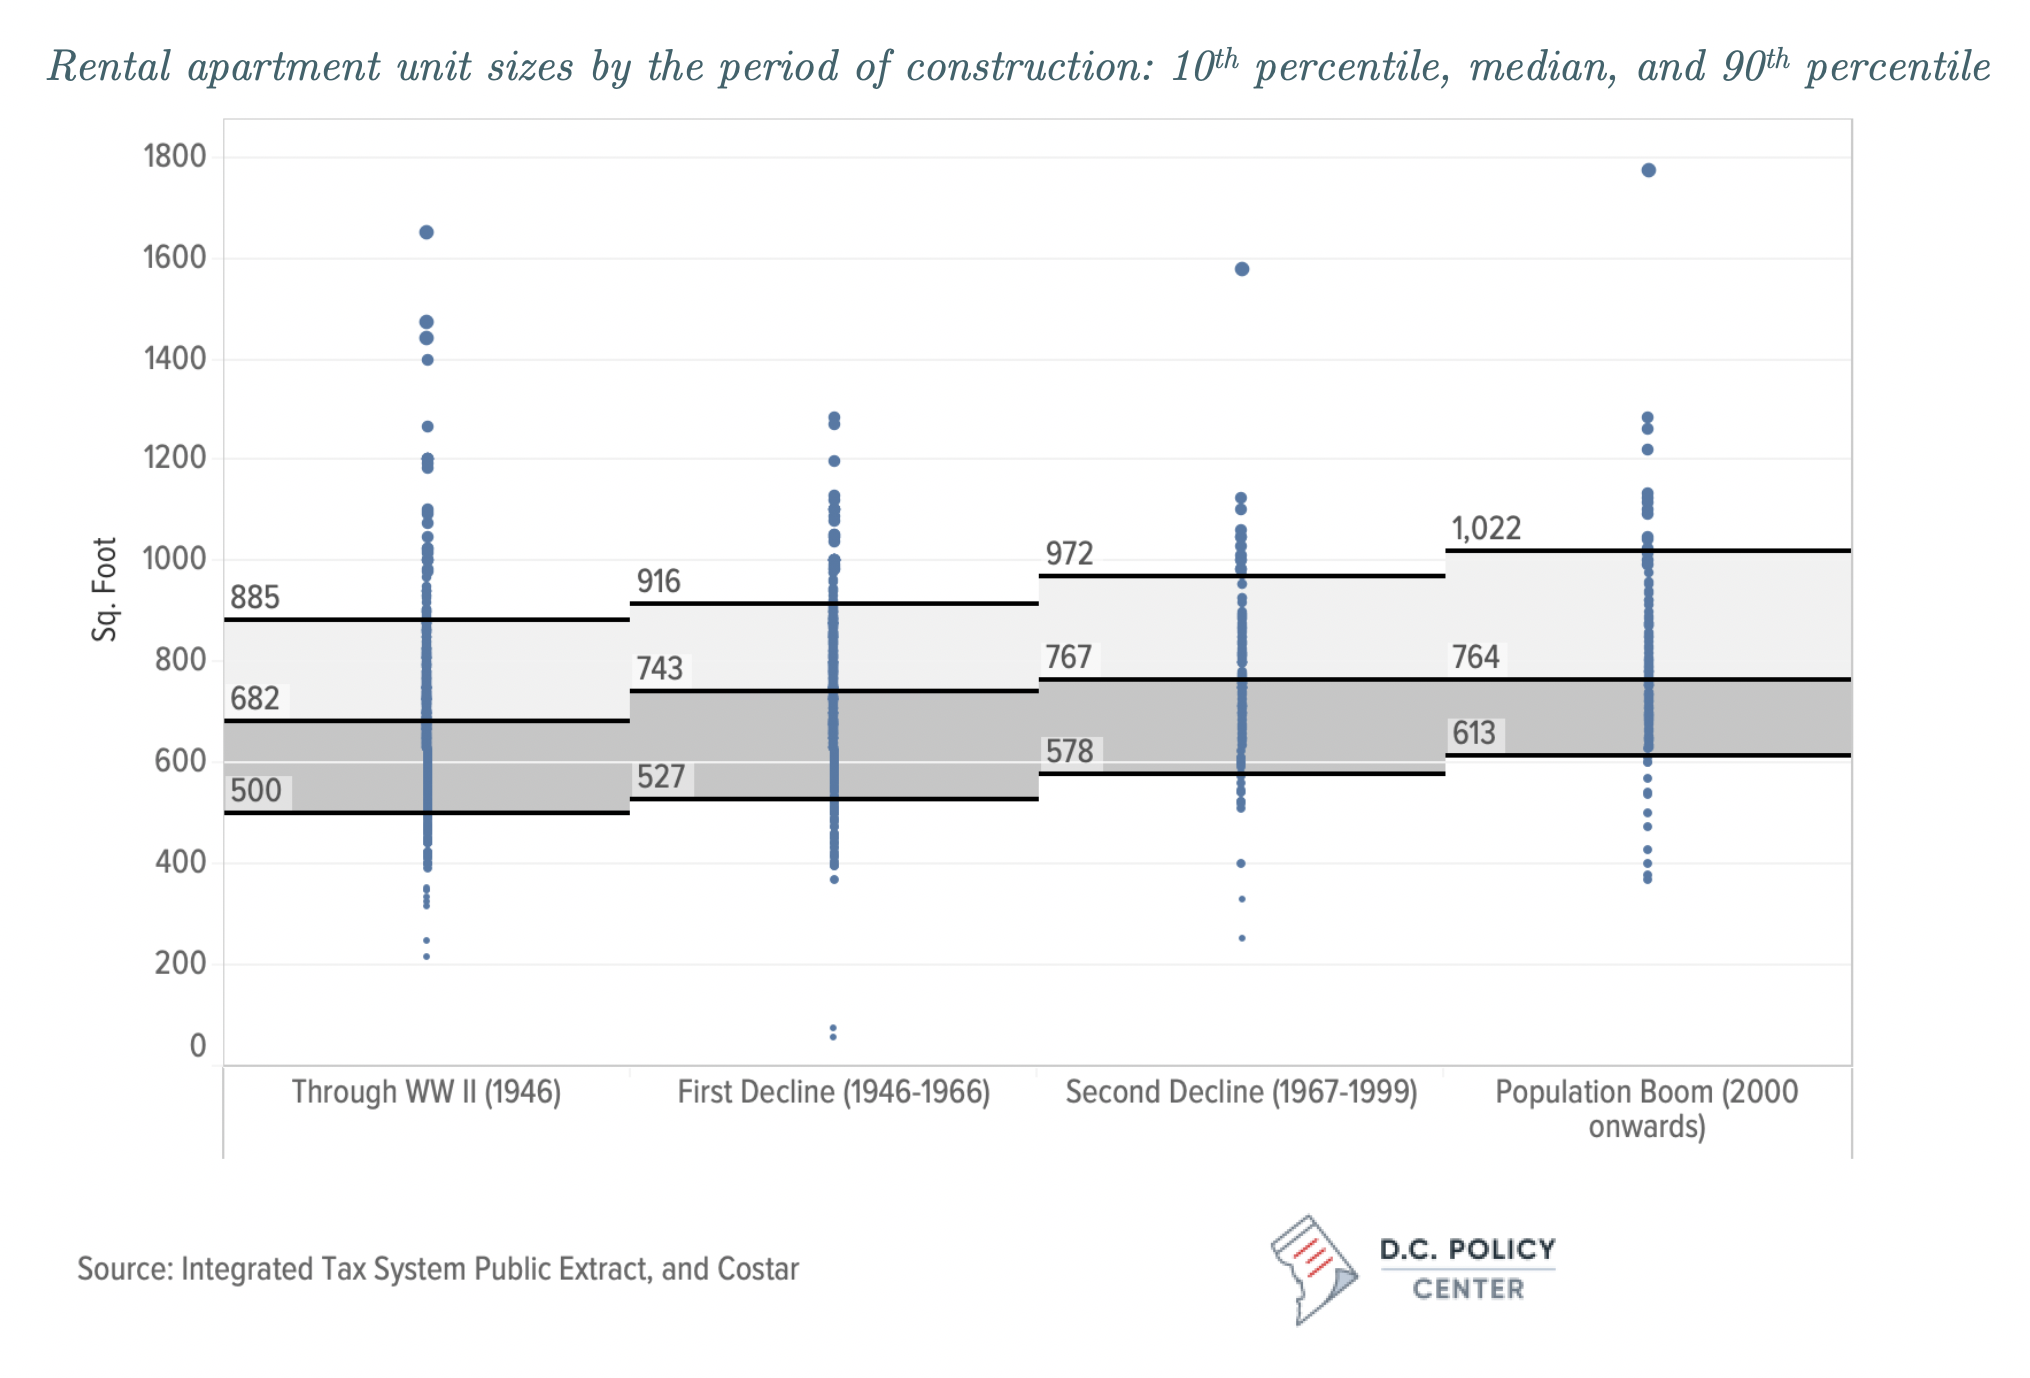
CoStar also provides information on average unit size by square footage in a building but does not break it down any further. Data on average unit sizes is available for 1,159 buildings with 101,800 units. Among these units, the median unit size is 725 square feet. Interestingly, according to CoStar data, unit sizes have been increasing over time: for units built before World War II, the median size was 682 square feet, but 90 percent of the units were smaller than 885 square feet and 90 percent were larger than 500 square feet. For units built after 2000, the 10th percentile, median, and 90th percentile figures are 613 square feet (largest of all periods), 764 square feet (second largest since the period of the Second Decline), and 1,022 square feet (nearly 140 square feet larger than what this figure was before World War II). There is less certainty about this data since it is an average of averages, and there is even less data available on average unit sizes for units built since 2000. For this recent period, the general perception is that unit sizes have been becoming somewhat smaller. For these reasons, the relevant chart is only presented as a reference point here in the appendix, rather than in the main report.
Estimation of rents by unit size in multi-family buildings
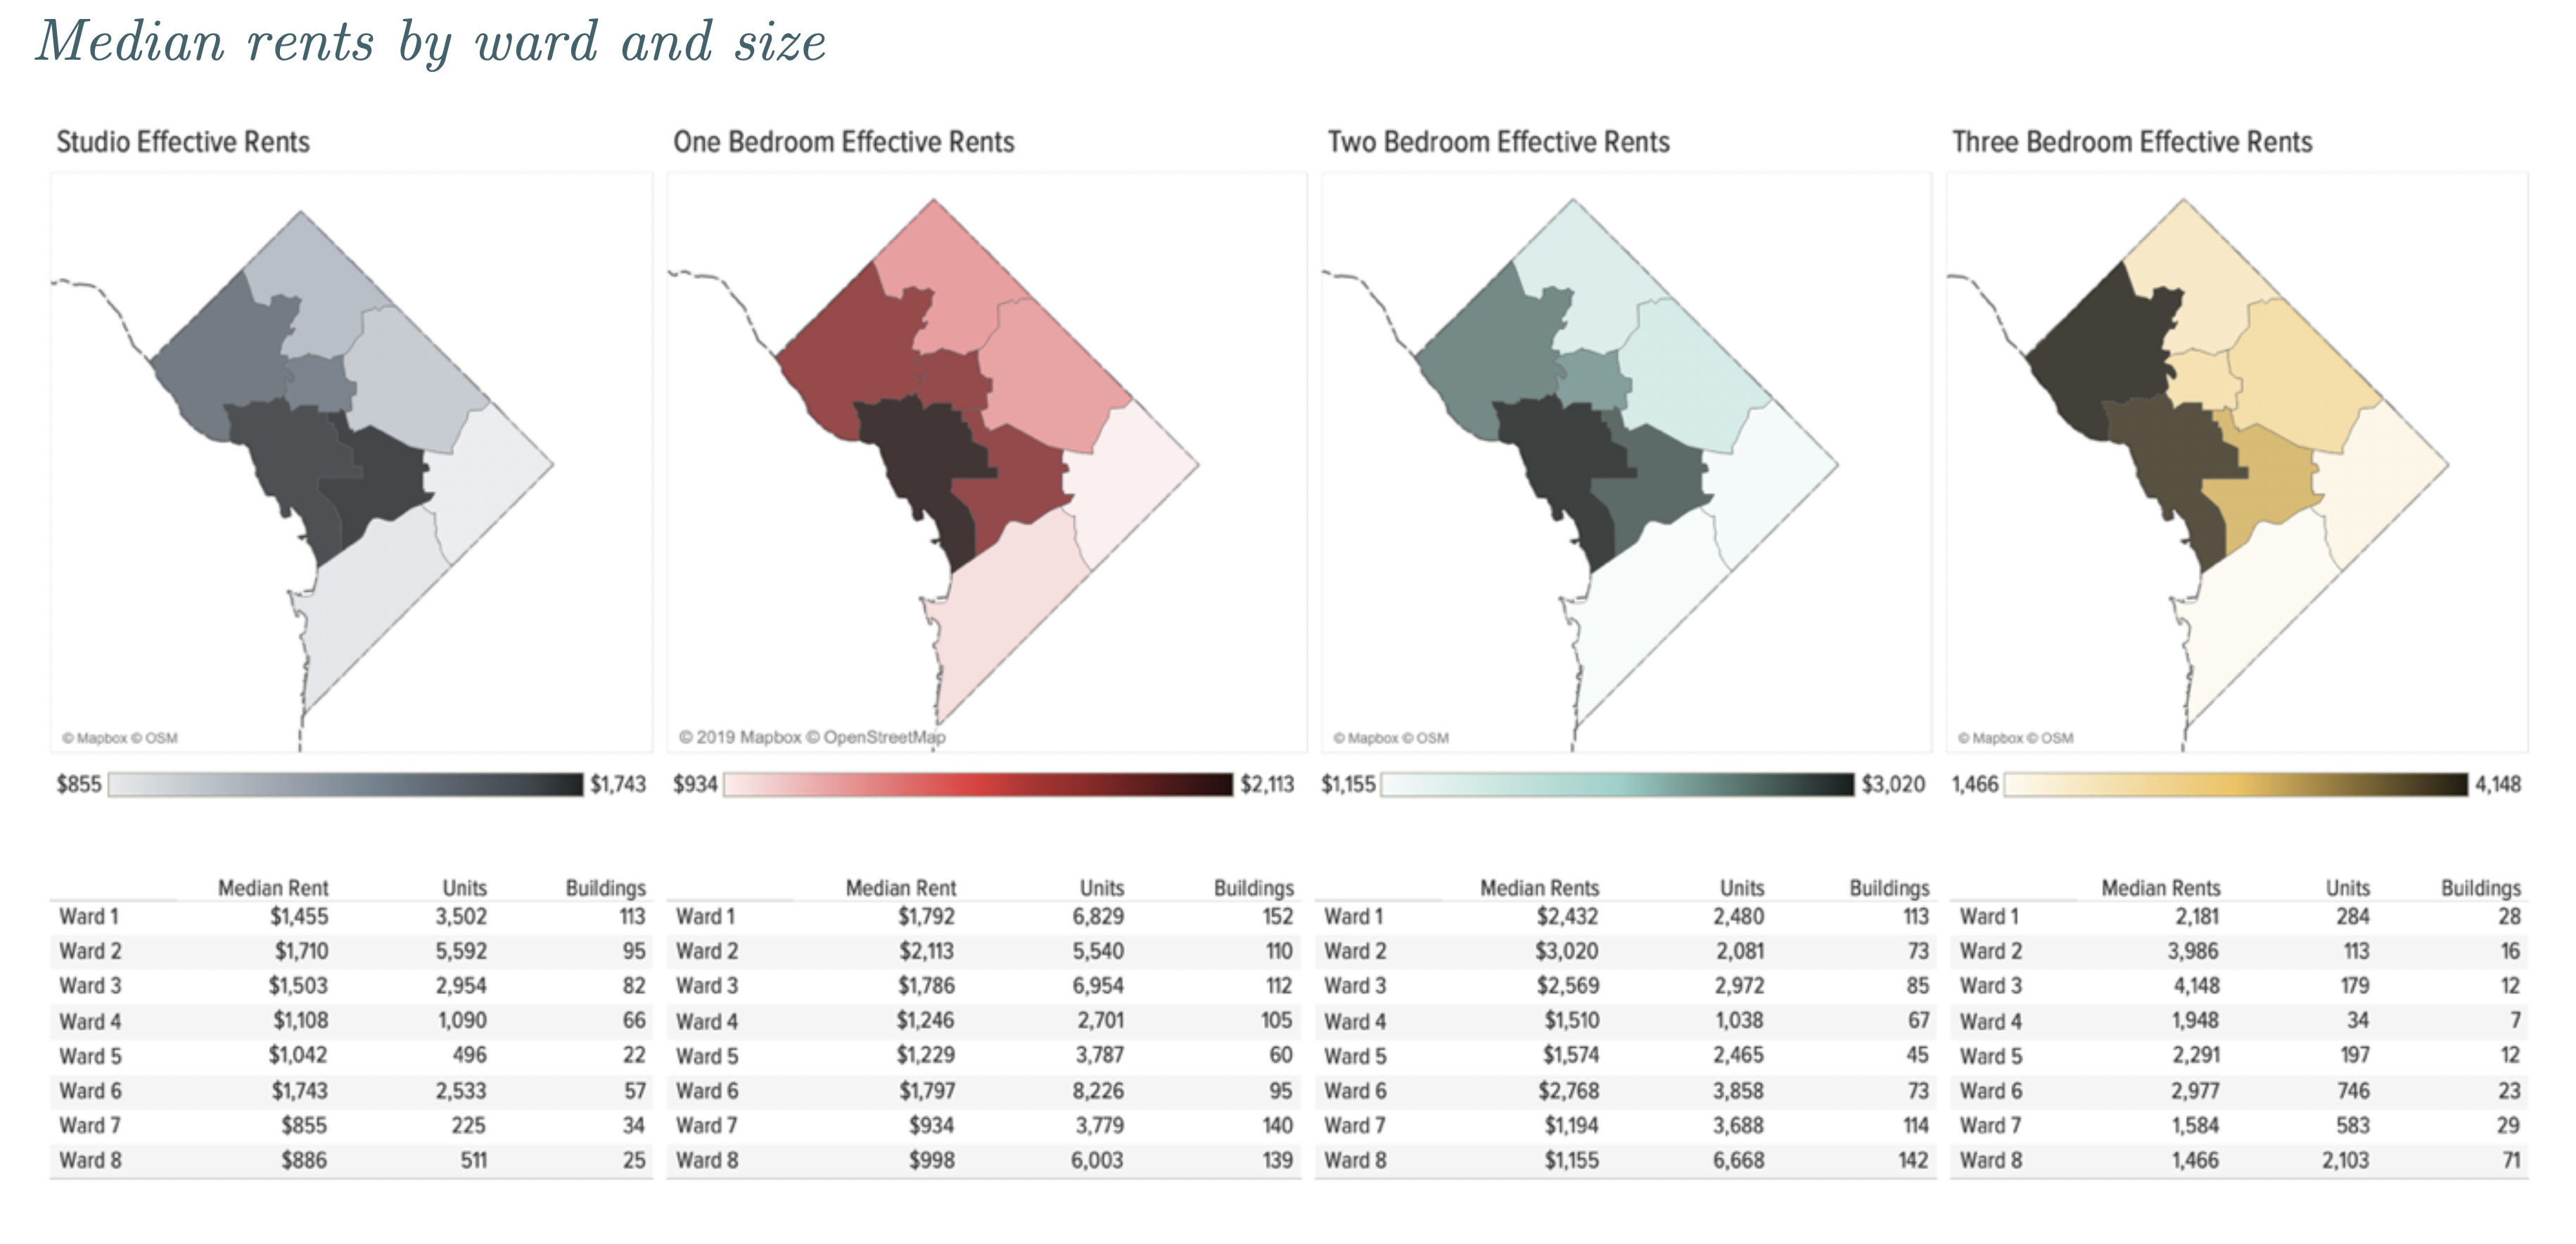
As previously mentioned, the CoStar database is estimated to track 64 percent of all rental apartment units in the District of Columbia. Coverage is strongest in Ward 3 (95 percent of all units), and weakest in Ward 6 (45 percent of all units) and Ward 8 (49 percent). CoStar’s coverage is even weaker for rent data: the units for which CoStar has rent information (averaged across the building in which the unit is located) are only 57% of the units that are tracked by administrative data (approximately 71,000 units). Rent coverage is, once again, strongest for Ward 3 at 81 percent and weakest for Ward 6 at 39 percent. Rent information is available for only half of the rental units in Wards 4 and 6, and less than half in Wards 7 and 8 (in addition to Ward 5).
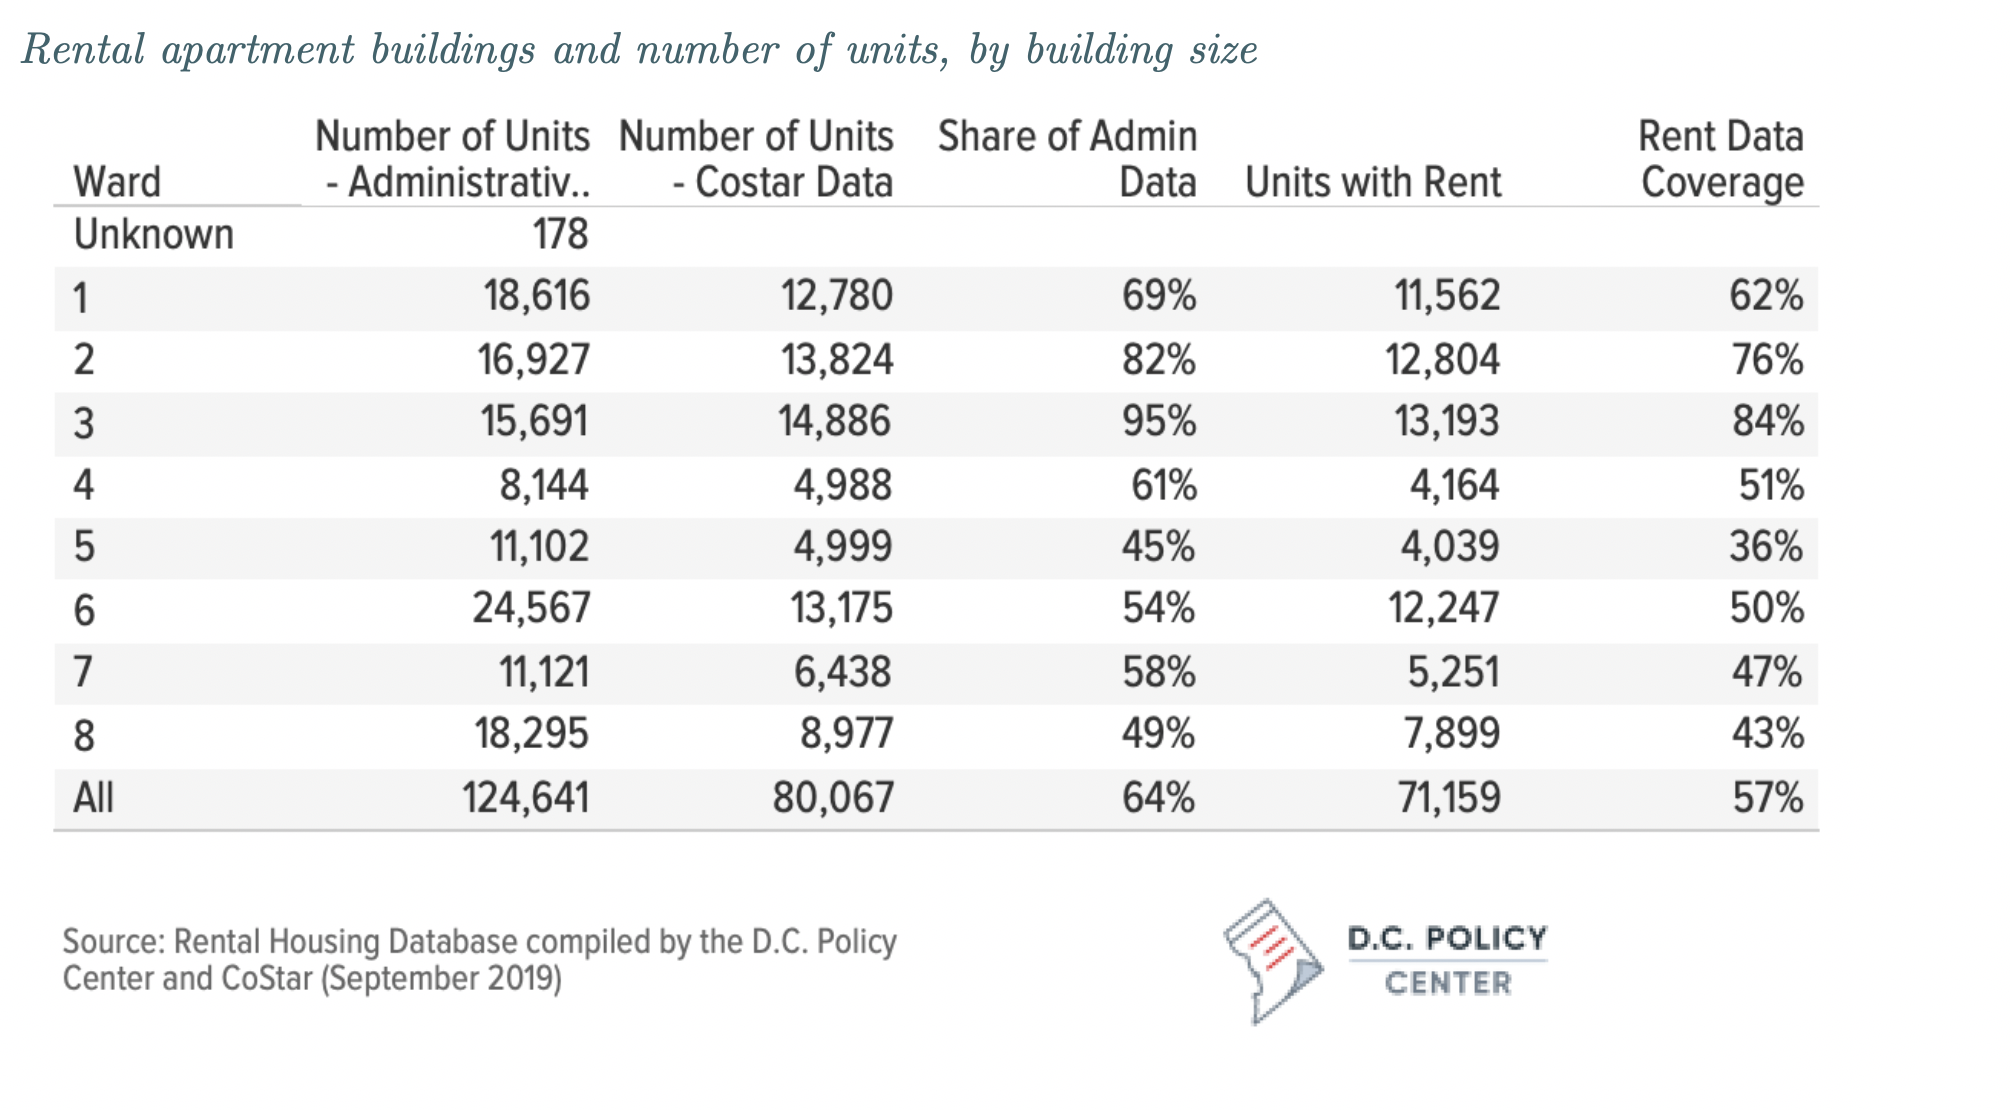
Rent information by unit size can be particularly elusive for some types of apartments in certain wards. For example, rent information for studios draws from fewer than 500 units in Wards 5 and 8, and only 225 units for Ward 7. Similarly, rent data on three-bedroom units rely on fewer than 200 units in Wards 2, 3, 4, and 5.
Estimation of the number of rent-controlled units
The definition of the rental stock subject to rent control is in part built on exemptions for which data are not always available. To that end, once researchers compiled the dataset of all rental units, they accounted for the following exemptions:
- Publicly owned properties or those receiving public assistance:
- What we could do: We excluded all properties that are owned by the D.C. government or are receiving a tax exemption because the property is owned or managed by a nonprofit with an affordability mission. This eliminated 17,400 units in 487 different buildings. Of these, 5,200 are public housing units, and the remainder are owned by exempted nonprofits. We did not include in this count housing units owned by exempt nonprofits that are not focused on housing affordability.
- What we could not do: The Rental Housing Act exempts buildings that receive other forms of housing support (excluding local rent subsidies). The analysis does not incorporate this exemption since landlords are not required to remain in these programs, and once they stop receiving federal housing vouchers, they are subject to rent control.
- Properties that received their building permits after 1975:
- What we could do: We used the “Actual Year Built” information in the District’s CAMA database to identify buildings that fall under this criterion. When this information was not available from CAMA, we used information from CoStar. Following Tatian and Williams (2011), we also separately tracked buildings built in 1976 and 1977, as these buildings could have received their building permits before December 31, 1975.
- What we could not do: The law also includes in the rent-controlled stock any new unit added to an existing structure built before 1980. We implicitly tracked this by looking at current units but did not have a way of explicitly identifying such units. The law also requires that units in a new structure built after demolishing a rent-controlled building be subject to rent control (unless there are more units in the new building). We have no means of tracking this.
- Housing accommodation of 4 or fewer rental units:
- What we could do: We limited our analysis to rental apartment buildings with five or more
- What we could not do: We did not investigate whether buildings with fewer than four units have owners that own more than four units in multiple dwellings. Tatian and Williams (2011) find this to be a relatively small number. In their analysis, which uses mailing addresses of owners to determine the applicability of rent control laws, they find potentially 1,900 units subject to rent control owned by owners with five or fewer units in their portfolio. The researchers do not know how many own four or fewer units (this information is not provided in their report), but the analysis included some owners with five units.)
- Exemptions for which we could not account:
- Cooperatives with four or more units but fewer than four shareholders. The analysis excluded all cooperatives, because most of cooperatives strictly limit rental use of properties.
- Buildings under rehabilitation programs with support from the Department of Housing and Community Development.
Assessment of the rents in shadow rental market properties
To estimate the affordability of shadow rental market properties, we followed the methodology developed in an earlier D.C. Policy Center report, Taking Stock of the District’s Housing Stock, which is briefly summarized here.
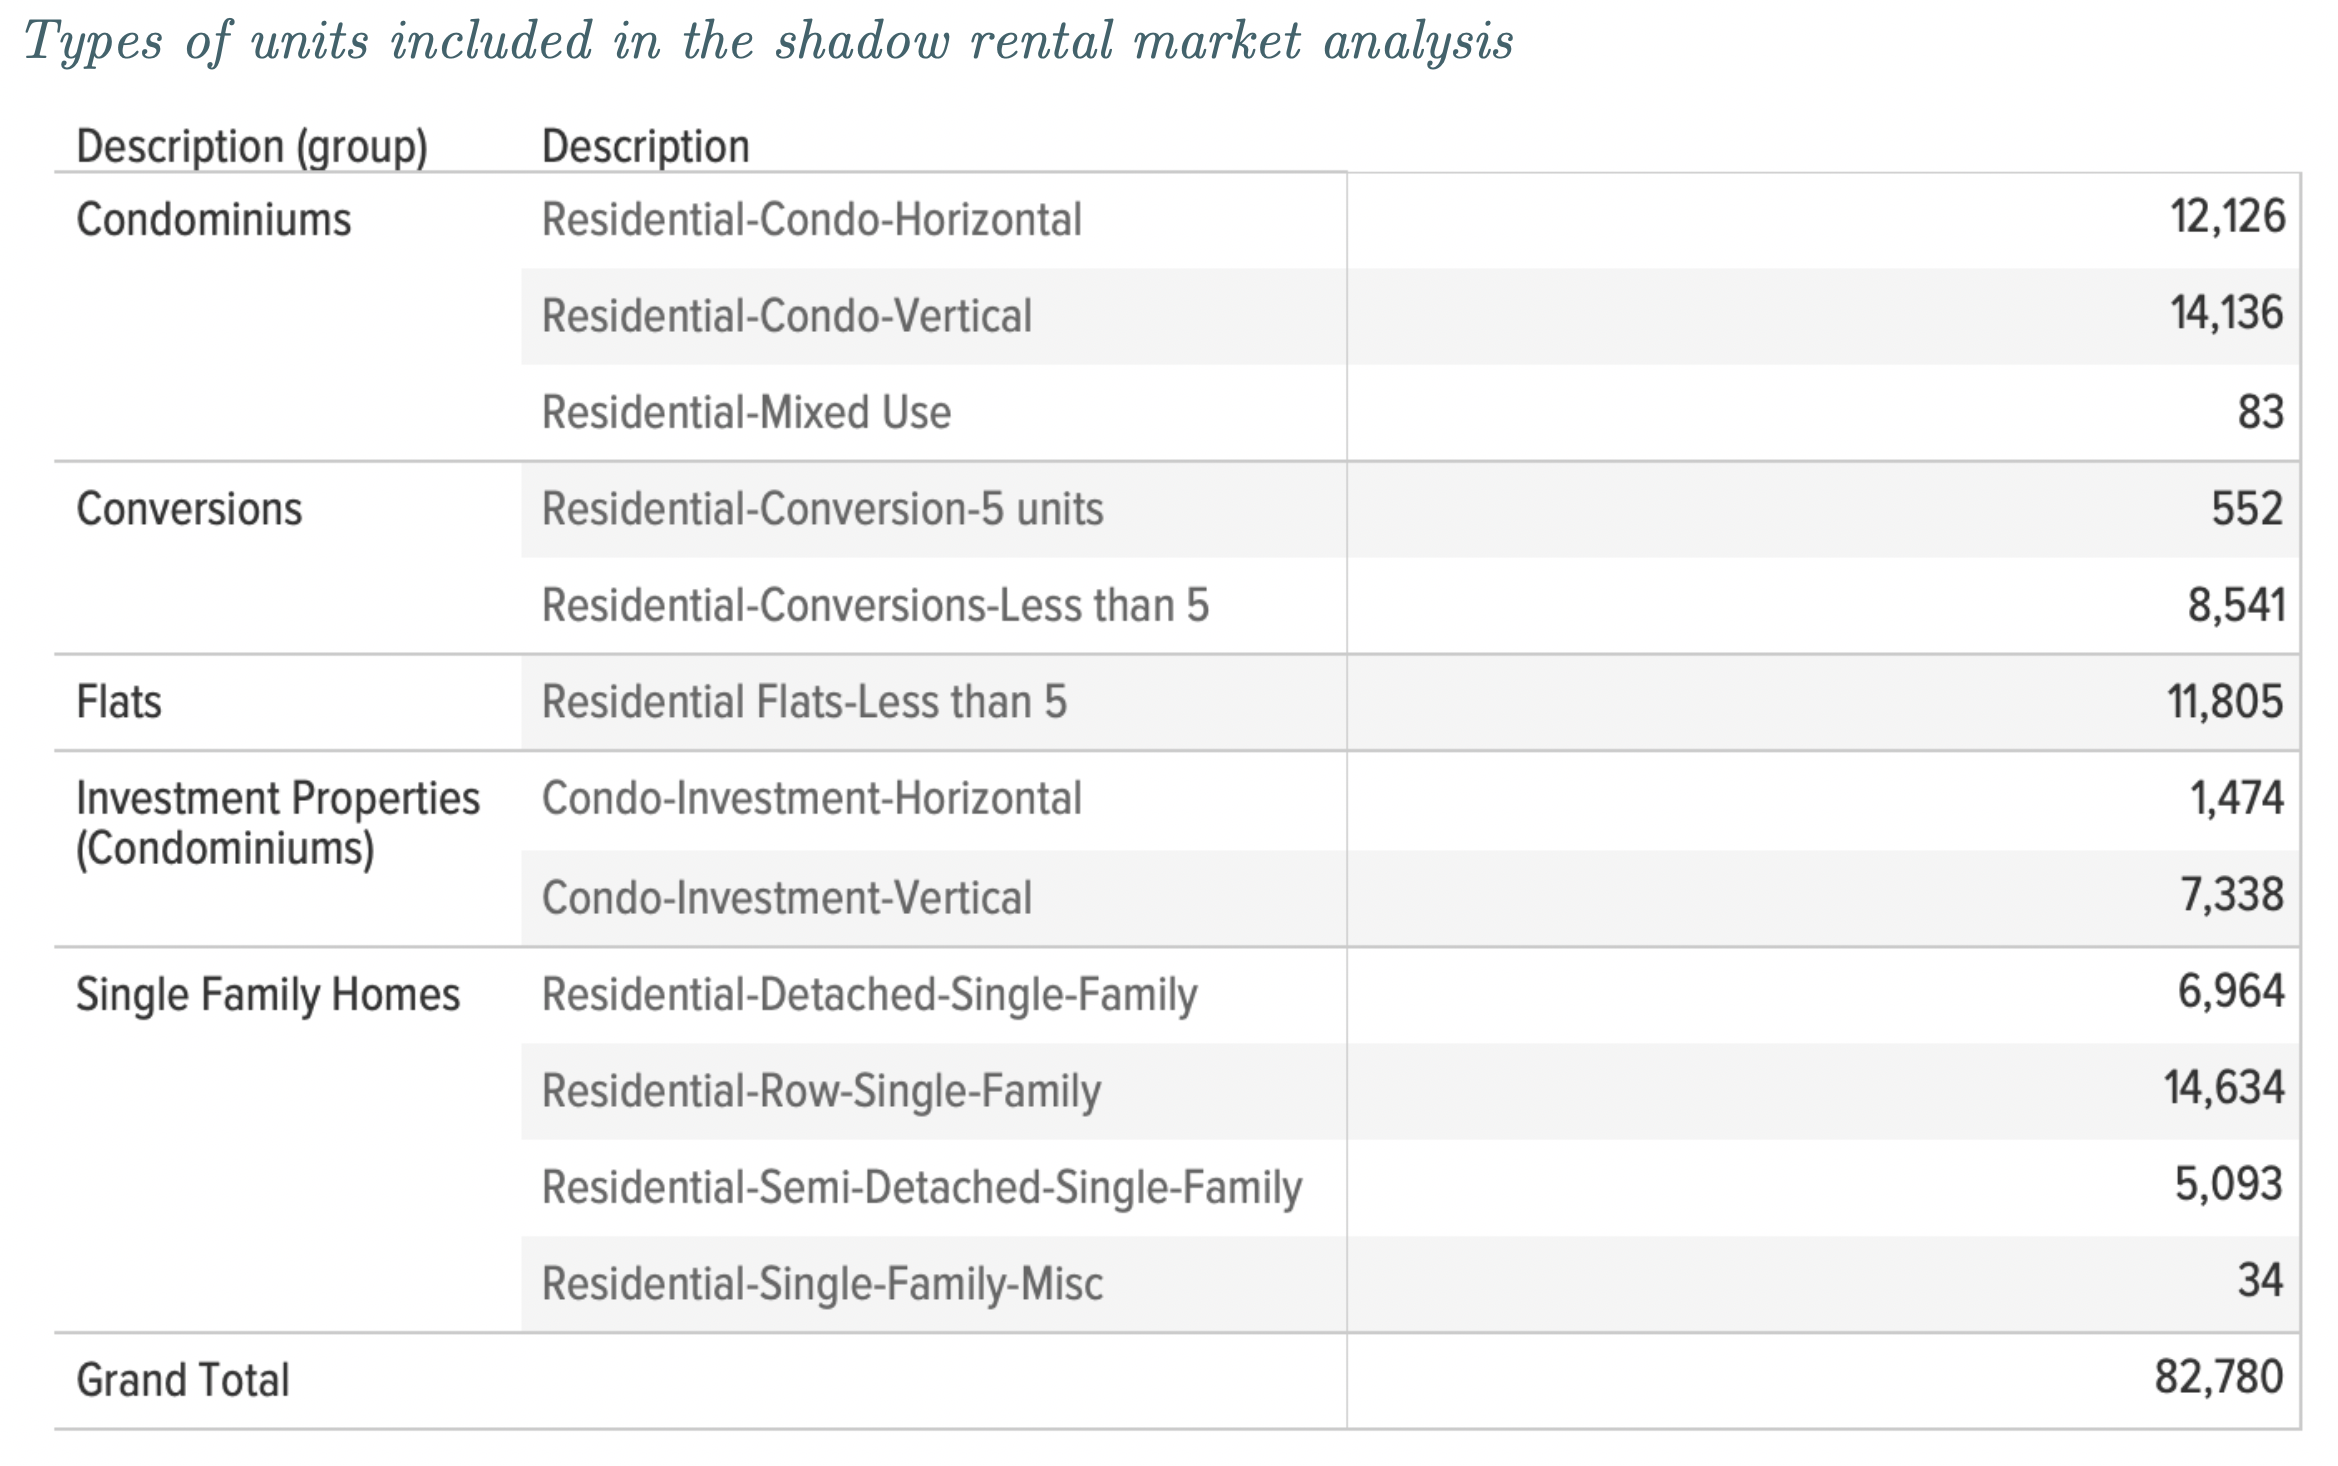
The shadow rental market includes units that are generally constructed with the intent of being owner-occupied. These include single-family homes, condominiums, conversions, flats, and investment properties. According to administrative records from the tax office, there are, however, 82,780 such properties that are not actually occupied by their owners.
We based the affordability estimates on the capacity of each unit. This required us to identify the number of bedrooms in each unit and then ascribe them to the appropriate household size. We assumed that a studio apartment would be appropriate for a single-person household, a one-bedroom unit can house a household of two at most, a two-bedroom unit can hold a household of three, and a household of four or more would have to be in a unit with a minimum of three bedrooms.
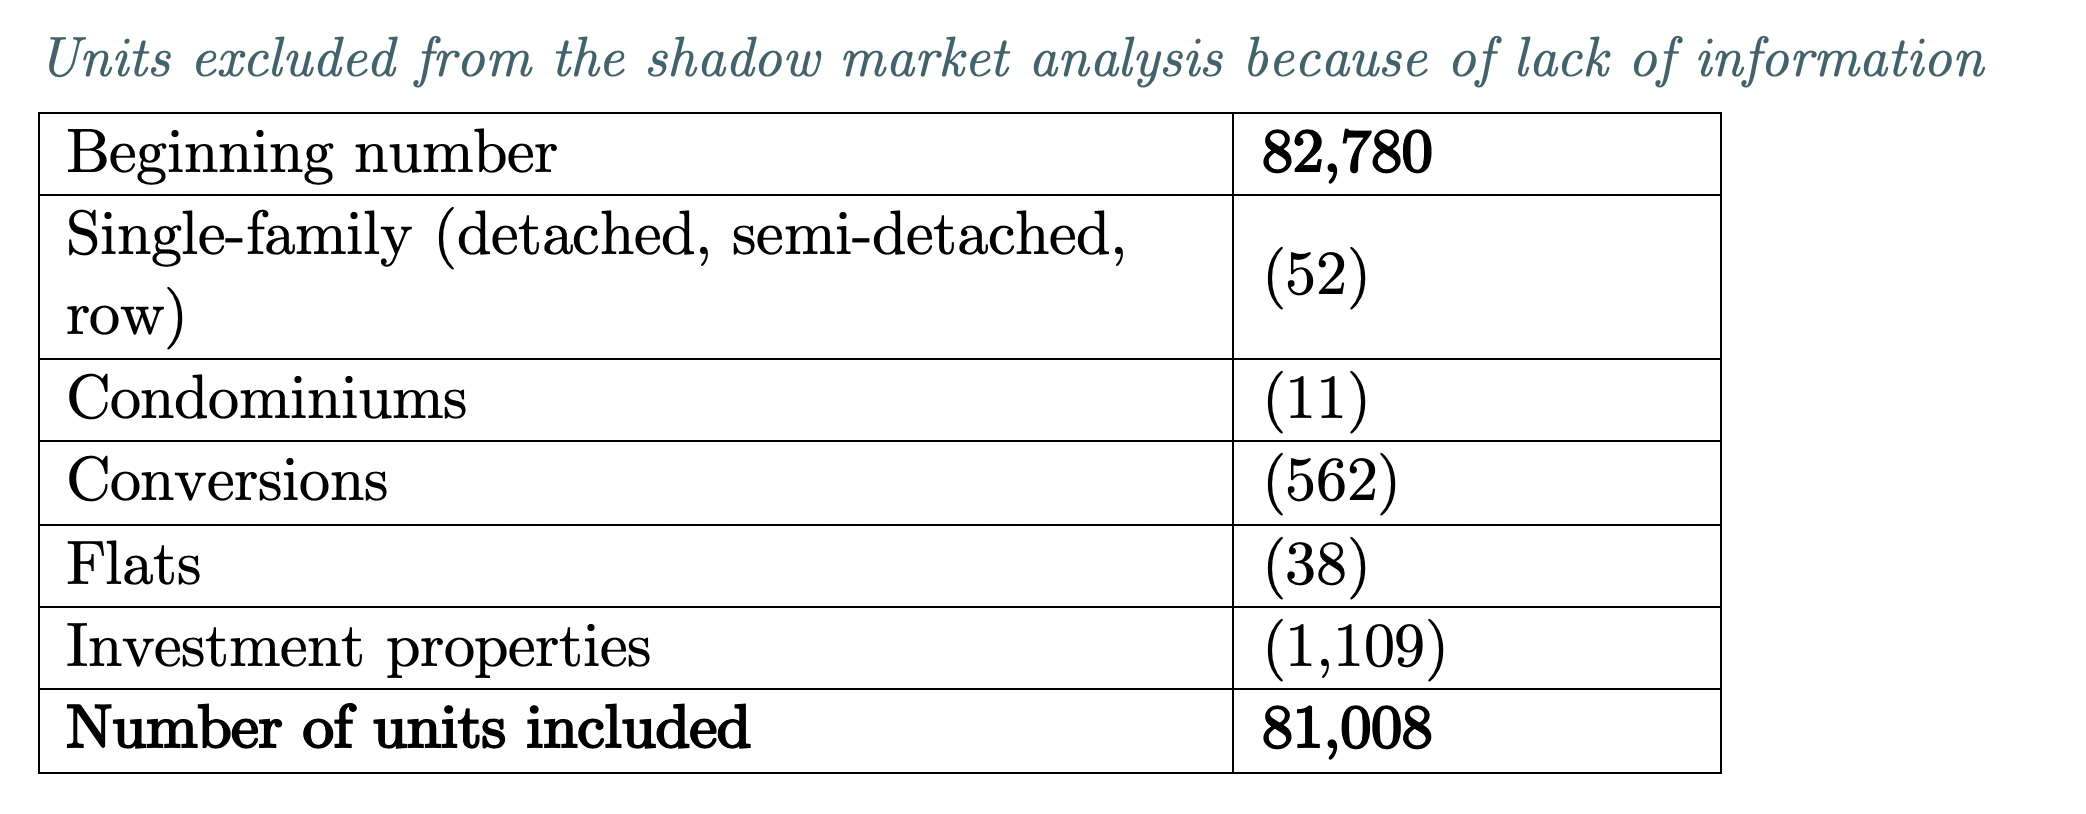
While CAMA data provides bedroom information for most units, when this information was missing, we estimated the number of bedrooms based on unit size: we assumed that the average size of a room is 400 square feet. We reduced the number of rooms calculated in this manner by one to account for living space. Using this methodology, we were able to include 81,008 of the 82,780 units in our analysis.
To estimate the rents for each unit, we used taxable assessment information. We assumed that the assessments correctly capture the operating income from the unit when it is rented out. We then used a cap rate of 5.4 percent to estimate the net operating income from each unit—the market cap rate reported by CoStar for Washington, D.C. multi-family residential buildings. We divided this by 12 to estimate the monthly rent.
To determine affordability, we compared the annual rent expenditure to the Area Median Income by each household size. We also compared this figure to the median renter income in the neighborhood to elaborate on the share of income residents spend on rent. We compared this to ACS to check our estimate. ACS reports the estimated median gross rent as a share of median household income (both owners and renters) for 174 Census Tracts. This “burden” metric does not differentiate between rental apartments and units in the shadow rental market. Our estimates for “burdens” which compares our estimated rents for the shadow rental market to the median household income reported for the census tract by ACS are within the error margin of ACS estimates for 82 of the tracts. The interested reader can request this data from the authors.
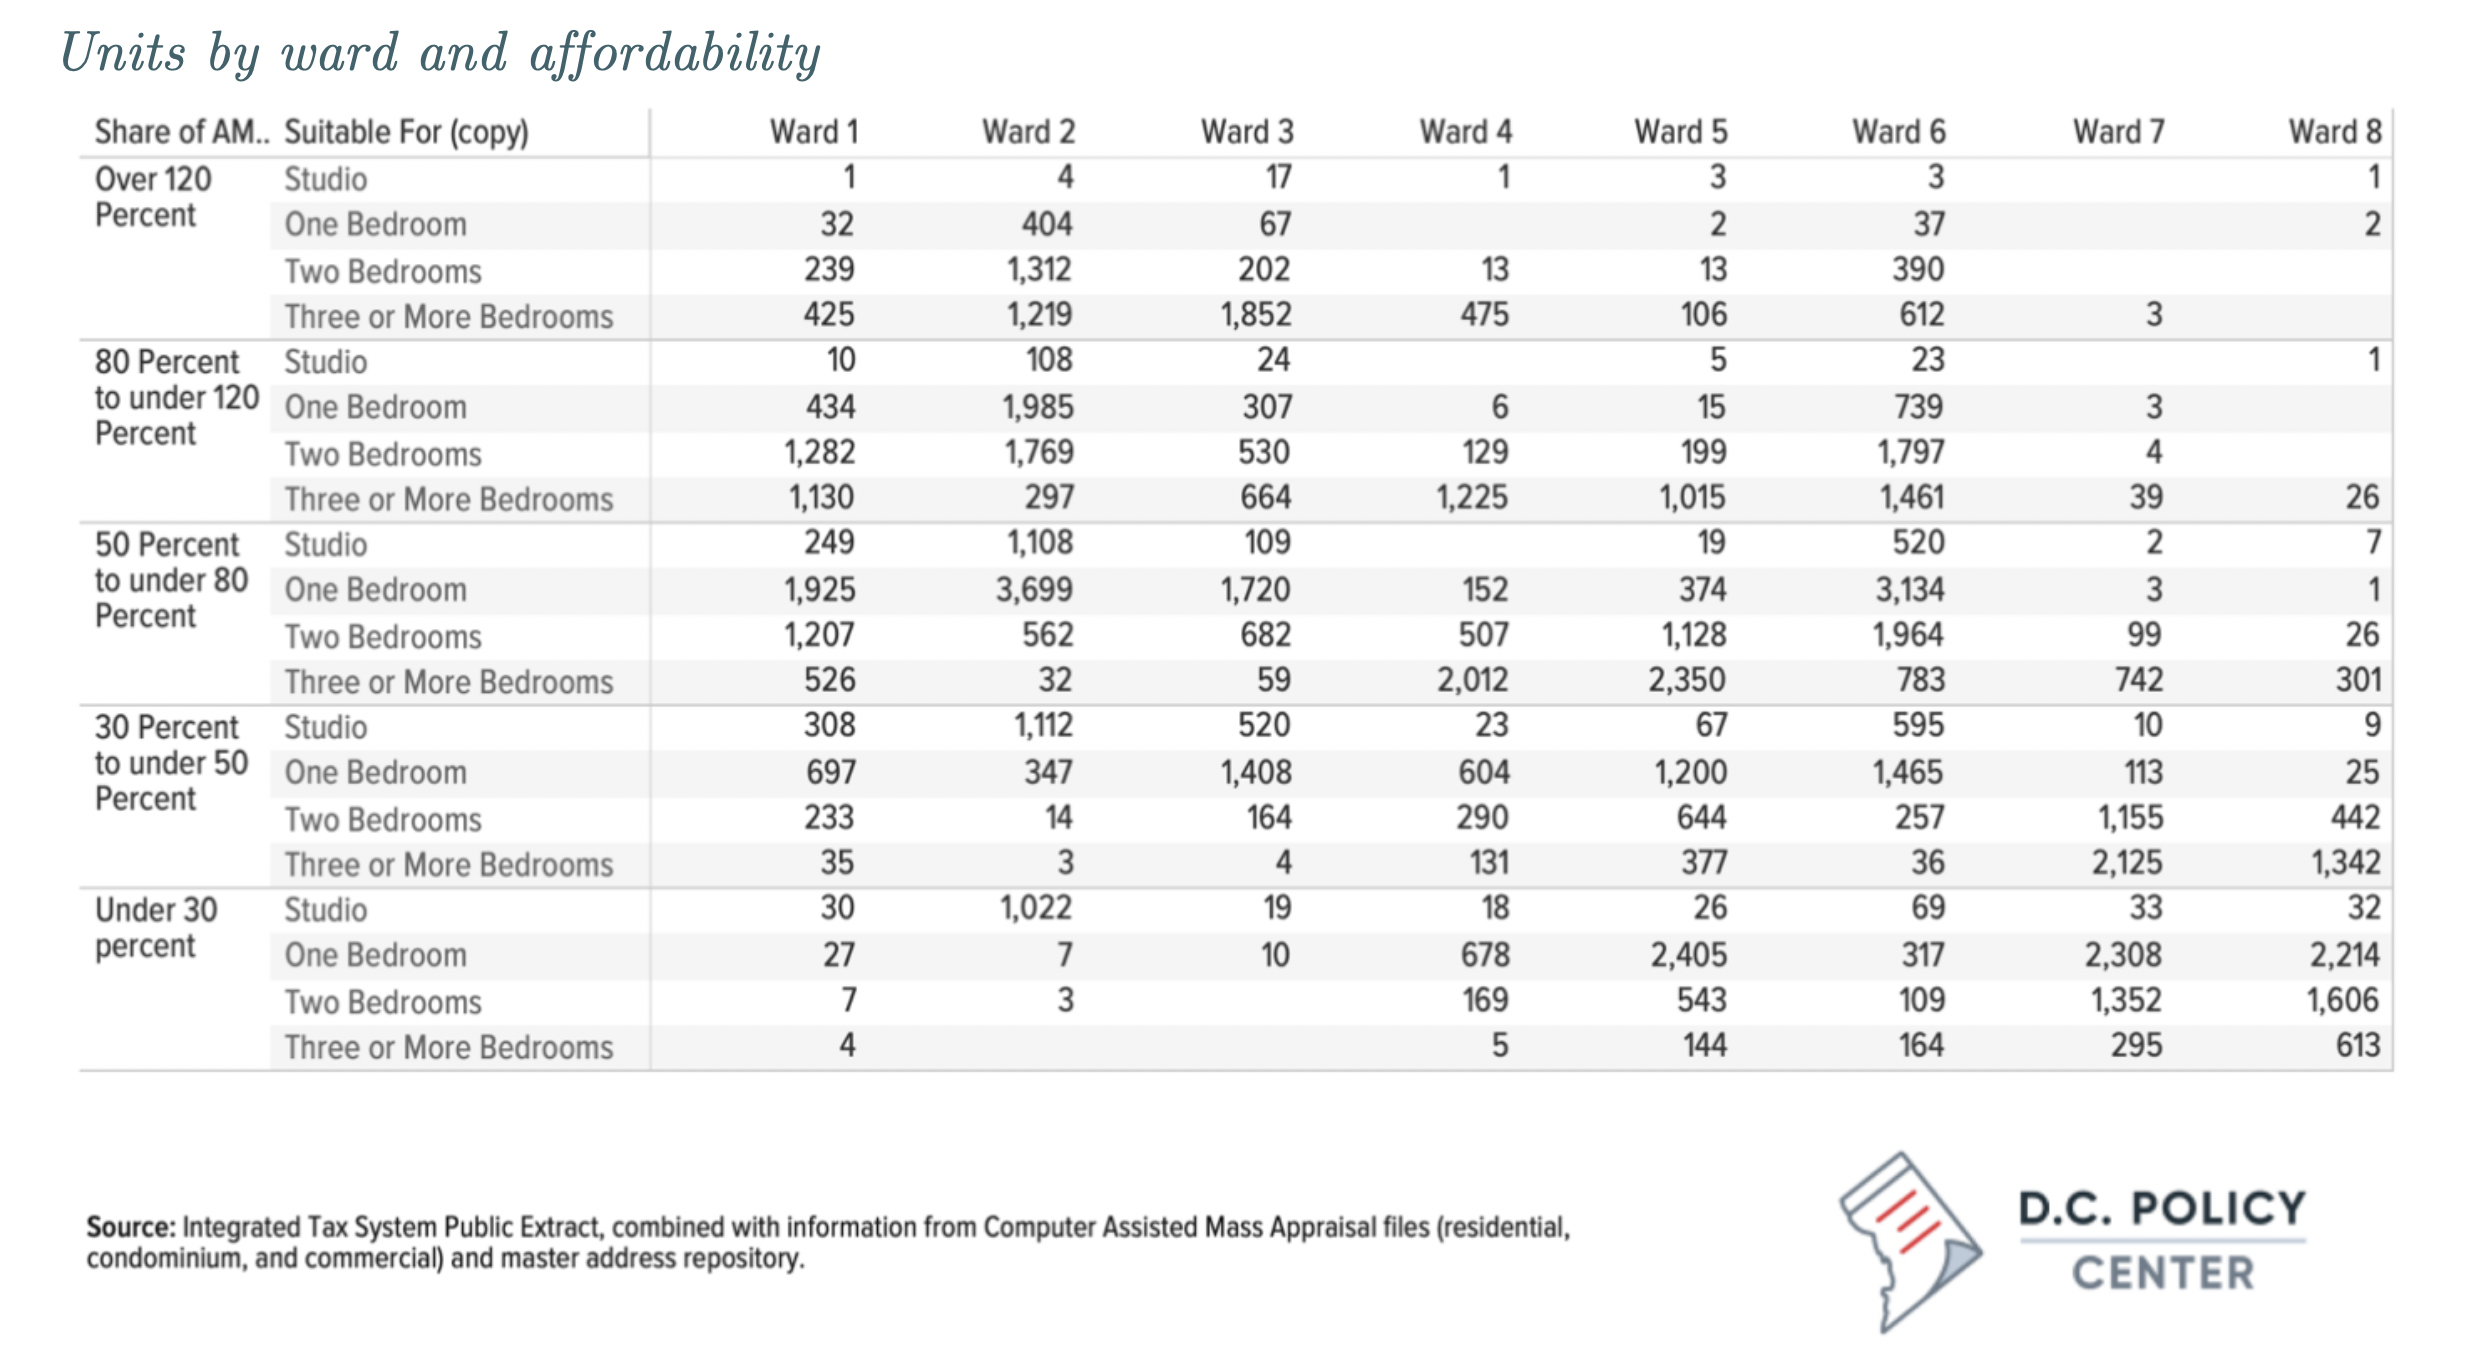
The table below presents the number of units by size and affordability level at the ward level.
Displacement models
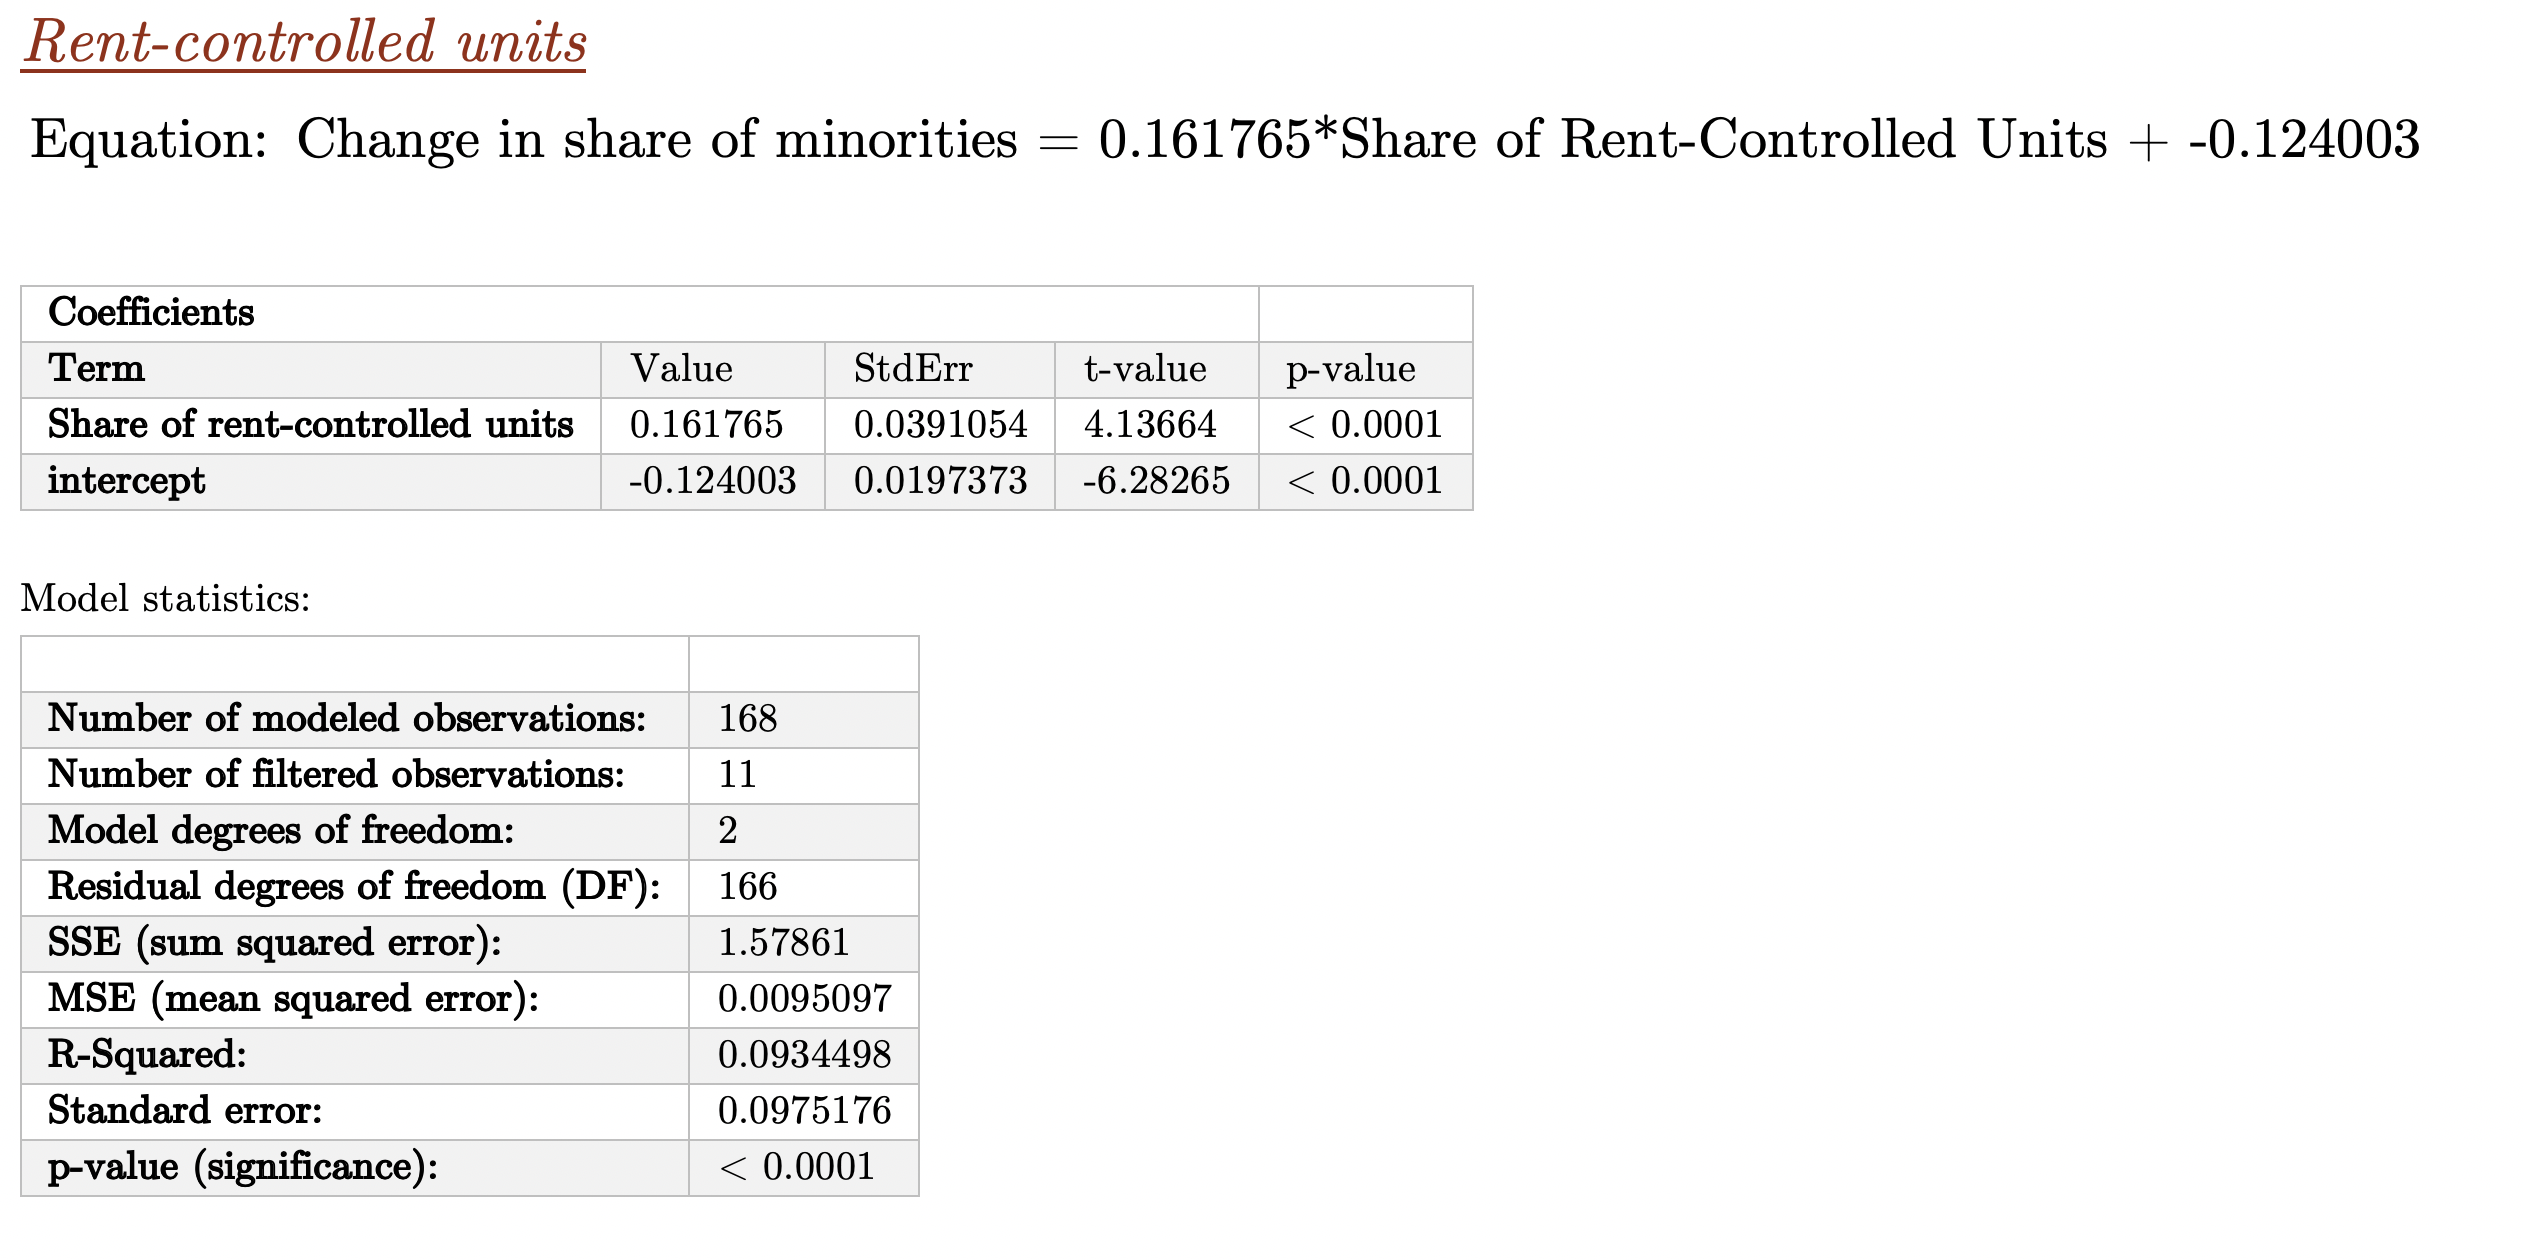
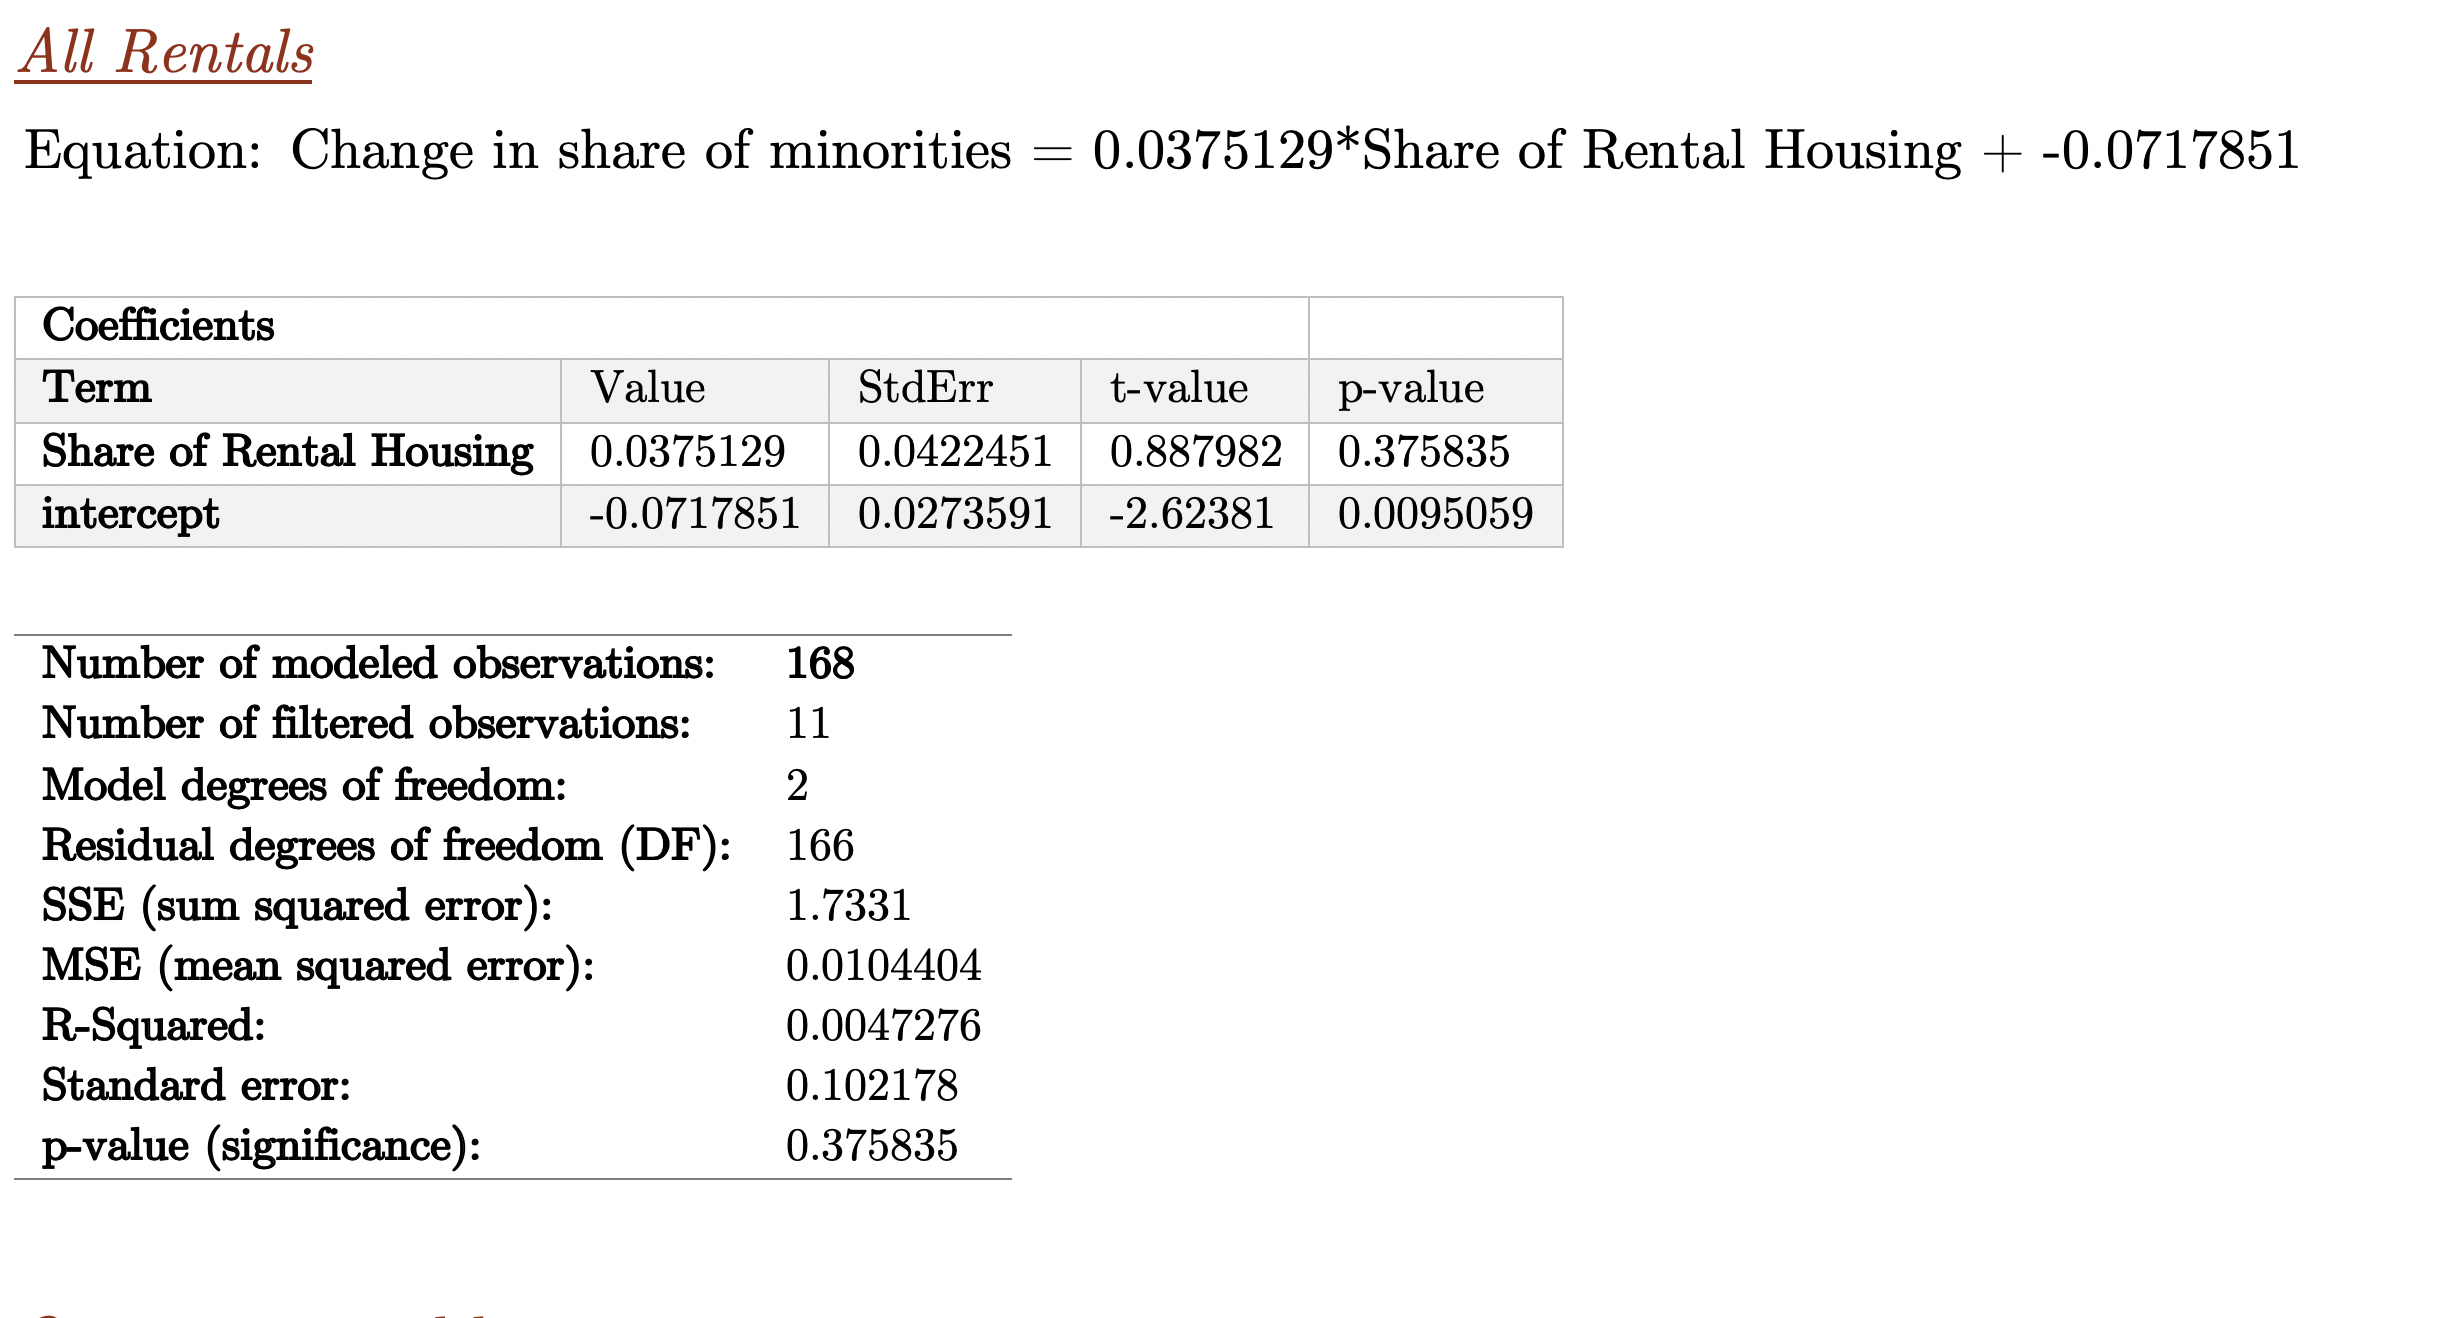
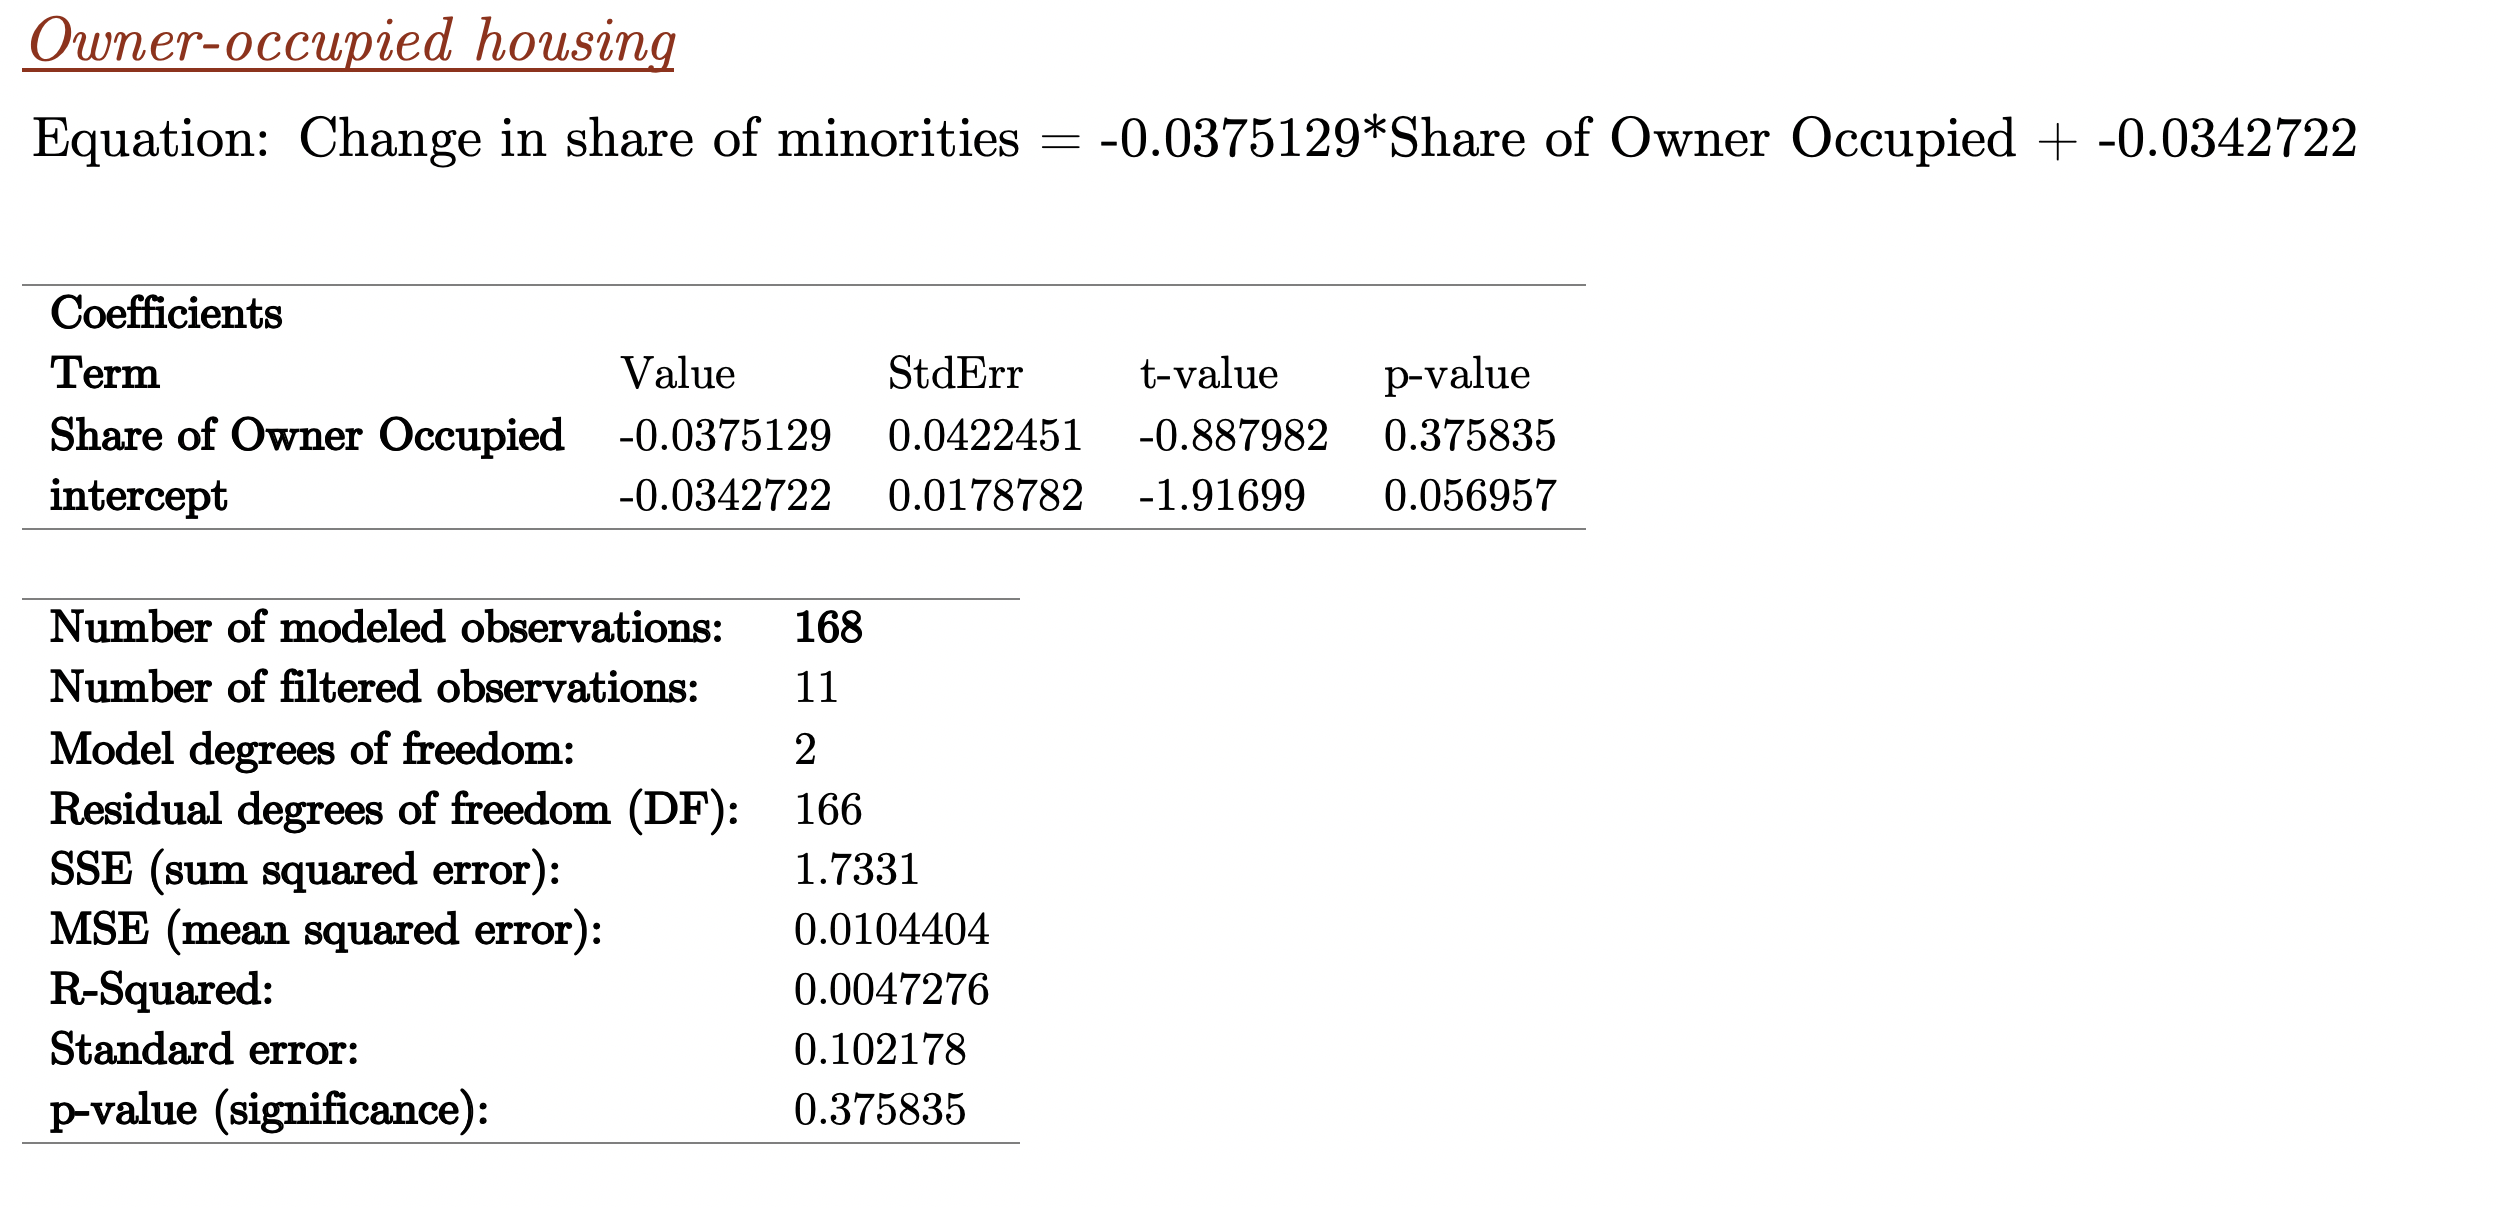
The displacement models are simple linear regressions that regress the change in the share of minorities in each census tract on the share of certain type of housing (rent-controlled, all rentals, owner-occupied). Below are the relevant statistics for each of the three models:
Modeling Inclusionary Conversions
The underlying assumption that drives the model is that landlords will be willing to take cash infusions from the D.C. government when they are refinancing their units. In return, they will set aside a certain portion of their units for long-term affordable use.
The inputs for the model are the following:
- Location and size of rent-controlled apartment buildings
- Prevailing rents in rent-controlled apartment buildings
- Prevailing vacancy rates
- Mix of differently sized units
- Taxable assessments.
The model used for estimating the public funding necessary to convert existing rental units into affordable units relies on information from CoStar. CoStar tracks information on 1,517 buildings constructed before 2006 (our modeling universe), with 77,425 units. Of these, we exclude 13,000 units in 731 buildings because CoStar has no information on unit rents. These are typically smaller buildings – the median number of units is 12. This leaves us with 795 buildings with 64,127 units. These are typically larger buildings with an average of 78 units (or a median of 36 units).
The model is a relatively simple one, which compares the effective rents in a building to the rents that would be affordable at certain area median incomes. We replicate the model for both (1) all units, averaging through unit sizes, and (2) separately for each unit size. We make the following modifications to the CoStar data:
- For 238 buildings with 7,000 units, we do not have any information on vacancy. For these units, we assume that the vacancy rate is 7 percent, which is the prevailing vacancy rate among those buildings that do have vacancy information.
- As noted earlier, the number of units reported in CoStar does not always match the estimated number of units in apartment buildings based on administrative data (or data from the address repository). While we used CoStar data to run our model, we scaled the output by the discrepancy between the administrative data and CoStar data. For example, in the entire city, CoStar’s sample of buildings we use for modeling has 64,127 units. Our estimate for the same buildings is 53,000 units. We also know from tax data that the total number of rental housing units that were built in our sample period is 77,000 units. We use these numbers to scale our unit estimates in the model.
Beyond that, the modeling does not require any modifications to the CoStar data, but it does rely on the following parameters:
- Number of years for which the unit will be set aside for affordable use
- The capitalization rate for the building that will be included in the program
- The share of units that will be set aside in each building over time
- The share of vacant units that could be taken over immediately
- The mix of affordability covenants by Area Median Income
- The minimum number of units a building must have to participate in the Inclusionary Conversion program
- The amount of investment the building owner will make after refinancing to improve building quality as a share of total revenue (i.e., by how much will rents increase?)
- D.C. contribution to overall improvement of the building.
Full list of data sources used to develop the Rental Housing Database
- Integrated Tax System Public Extract, text file, updated regularly. The study uses one dated September 19, 2019
- Integrated Tax System Data Dictionary, text file, dated July 24, 2019.
- Integrated Tax System Use Codes Lookup, text file, dated June 25, 2019.
- Computer Assisted Mass Appraisal – Residential, text file, dated June 25, 2019.
- Computer Assisted Mass Appraisal – Commercial, text file, dated June 25, 2019.
- Computer Assisted Mass Appraisal – Condominium, text file, dated June 25, 2019.
- Common Ownership Lots, spatial file, dated September 19, 2019.
- Condo Approval Lots, spatial file dated September 19, 2019.
- Condo Regime, text file.
- Condo Relate File text file.
- Condo Approval Lots spatial file.
- CoStar data extract (dated September 25, proprietary data)
- Address residential units, text file, dated June 25, 2019.
- Real Property Tax Assessment Neighborhoods, spatial File, dated June 25, 2019. (here)
- Affordable Housing, text data, dated December 13, 2019 (here)
- TOPA data from DHCD (via Urban Institute)
- Section 8 contracts, from HUD.
- Housing Choice Vouchers, from HUD.
- ACS Five-year data summaries for various demographic and income characteristics.
You’ve reached the end of Appendix III (Methodology & data sources).
<< Back: Appendix II (Impacts of rent control literature review) | Next: References >>
Or return to the main publication page.
Notes
[1] I thank Stephen Swaim for this important point.