
The rental housing landscape of Washington, D.C. is marked by a structural heterogeneity that is frequently overlooked in conventional analyses. While large multifamily apartment buildings comprise the majority of formal rental units, a substantial share of the city’s rental stock is housed in smaller buildings and non-traditional arrangements, including single-family homes, flats, and condominiums. These units are disproportionately owned and operated by small housing providers—non-institutional landlords who typically manage modest portfolios and rely heavily on rental income to sustain operations.
This paper examines the pivotal role small housing providers play within the District’s housing sector. In particular, the paper focuses on the role of small providers subject to rent control, as they manage 70 percent of rent-controlled buildings and 25 percent of rent-controlled units. Despite offering comparatively lower rents and exhibiting restrained rent growth, these providers are increasingly vulnerable to financial strain due to rising maintenance costs, regulatory burdens, and limited access to capital. The decentralized nature of this ownership model, while beneficial in preserving neighborhood-level affordability, also renders the system susceptible to attrition, particularly in the context of ongoing unit losses through condominium conversions and market exits.
Drawing on recent data, this study underscores the necessity of policy interventions that both acknowledge the constraints faced by small providers and leverage their role in supporting affordability. Recommendations include streamlining compliance mechanisms, expanding financial assistance for property upkeep, and offering targeted incentives to sustain long-term affordability commitments. The findings highlight the critical importance of integrating the perspectives and capacities of small housing providers into broader housing policy frameworks to ensure the preservation and resilience of D.C.’s affordable rental stock.
Access a pdf copy of the report here.
Acknowledgements
This report has been completed in collaboration with the D.C. Association of Realtors (DCAR) and Howard University’s Center of Excellence in Housing and Urban Research and Policy (CHURP). The authors thank DCAR and CHURP for their thoughtful comments and suggestions. The authors also thank CHURP for matching owner names, allowing for the identification of units in disparate buildings that would fall under rent control. A methodology can be found in the Appendix.
Introduction
Washington D.C.’s rental housing landscape is more diverse than it appears. While large apartment buildings account or the majority of rental units, a significant share of the city’s rental stock comes from smaller apartment buildings and non-traditional sources such as single-family homes, flats, and condominiums—many of which are owned and operated by small housing providers. These providers are not institutional landlords. Most own a handful of units in older buildings and rely on rental income to cover their mortgages and maintenance costs.
Small housing providers play a particularly important role in the rent-controlled segment of the market. Of the approximately 2,139 housing providers managing rent-controlled properties in the District, 84 percent are small housing providers operating between 5 and 50 units. These small providers collectively manage 20,812 rent-controlled units across 3,761 buildings—representing 25 percent of all rent-controlled units and 70 percent of rent-controlled buildings. Most operate very small portfolios: 71 percent own and operate fewer than 20 units. Their buildings are also older, with a median age of 87 years.
This highly decentralized, fragmented ownership structure supports a large share of the city’s affordable rental housing, especially in areas with limited new development. But it also makes the system vulnerable. Small providers face challenges that larger landlords can more easily navigate. They face higher per-unit maintenance costs, have limited access to capital and capacity to handle legal and regulatory issues, and little room to absorb vacancies or unpaid rent. Understanding their role and challenges is essential to shaping equitable and sustainable housing policy in the District.
Key findings of the report
- Rental housing: D.C.’s rental market includes approximately 150,000 traditional rental units in large apartment buildings (3,331 rental apartments and investment condominiums) as well as approximately 80,900 units in non-traditional rental units such as single-family homes, condominiums, or flats.
- Rent Control: An estimated 84,800 units are under rent control. Of this, 8,251 are in non-traditional rental units in disparate buildings owned by a single owner.
- Role of small housing providers: Small housing providers—those managing 5-50 units—represent 84 percent of D.C.’s providers. They own and operate 70 percent of the rent-controlled properties and 25 percent of rent-controlled units.
- Rents: Small providers charge 25 percent less than large providers for comparable studios, one-bedrooms, and two-bedrooms. For three-bedroom units, they charge 8 percent less.
- Rent growth: Between 2019 and 2024, small providers increased rents at a slower pace than large providers, partly due to regulatory constraints but also because they prioritize tenant retention.
- Financial pressures: Small providers face rising financial pressure, pushing some out of the market. Many report higher-than-average vacancy rates and have pursued evictions due to unpaid rent, with past-due amounts ranging from $7,000 to $42,000. The financial strain has led some to consider selling or withdrawing units from the rental market, further reducing the supply of affordable housing.
- Unit loss: Between 2006 and 2025, the District lost approximately 16,500 rental units to conversion, mostly to condominiums and flats. 12,438 of these units were previously rent-controlled, the majority of which were owned by small providers.
Policy implications:
If current trends continue, D.C. risks a continued erosion of its rent-controlled stock, particularly in neighborhoods where small providers dominate. To stabilize this segment of the market and preserve affordability:
- Simplify rent control compliance: Reduce bureaucratic hurdles to hardship petition processes so small housing providers can more easily adjust rents when necessary.
- Provide financial support for maintenance: Establish low-interest loan programs and grants to help providers maintain aging properties.
- Support providers who house vulnerable tenants: Introduce tax credits for small providers who rent to seniors and disabled tenants and therefore face additional rent-increase restrictions.
- Pay small providers for affordability covenants: The District can offer cash incentives for small housing providers to commit to longer term affordability that already exists in their buildings.
- Consider removing costly regulatory interventions for rent-controlled buildings: The majority of buildings in D.C. and units owned by small housing providers are under rent control. Rent controlled buildings have limited incomes which makes it difficult for them to meet costly regulatory interventions such as BEPs.
Small housing providers are essential to the city’s housing ecosystem. Their continued participation depends on policies that recognize their structural limitations while leveraging their unique contribution to affordability and neighborhood stability.
Rental housing in the District of Columbia
As of 2024, Washington, D.C. had approximately 348,921 housing units spread across 118,018 residential buildings, reflecting a diverse mix of housing types.
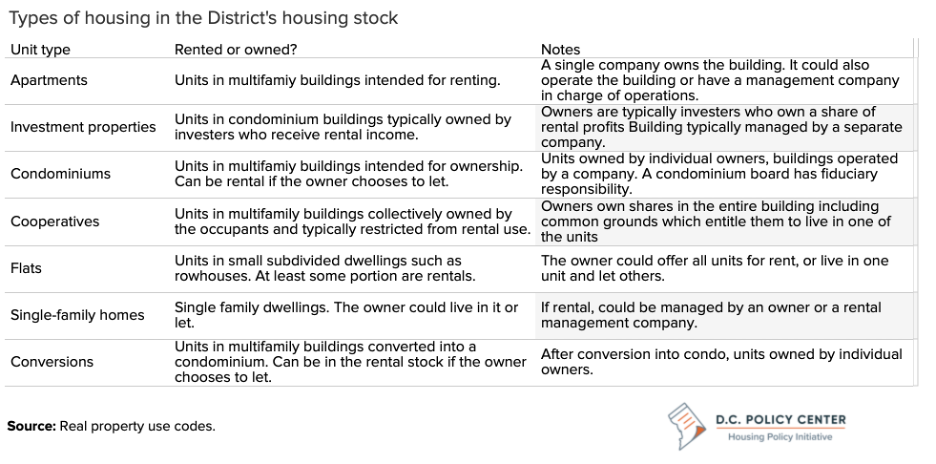
Rental apartments account for 41 percent of the city’s housing units but are concentrated in less than 3 percent of residential buildings—indicating that most rental units are in large apartment complexes. In contrast, single-family homes make up just 27 percent of all housing units but occupy 80 percent of residential buildings. This reflects the extensive use of land for low-density housing even as demand grows for higher density options.
Other multifamily housing types—including condominiums, co-ops, conversions, and flats—comprise 32 percent of the housing stock and 18 percent of residential buildings. (See the appendix for details on these housing types.)
D.C. is a renter-majority city. As of 2024, 231,087 housing units—68 percent of the city’s total—were in use as rentals. Most of these units are in traditional rental apartments or investment condominiums (legally condominiums but function as rentals). Together, these two categories represent about 65 percent of D.C.’s rental stock.
The remaining 35 percent of rental housing is made up of non-traditional rentals: single-family homes, flats, and condominiums that shift between owner-occupancy and rental use. This segment is dynamic and highly responsive to market conditions.1
Rental units are available in every ward, but they are more common in some wards than others. As of 2024, rental housing units make up somewhere between 70 percent and 80 percent of the housing stock in Wards 1, 2, and 6. In Ward 4, only about half of the housing stock are made up of rentals. In Ward 8, that share is 83 percent.
Fluidity of the rental market
Non-traditional rentals frequently shift between rental and owner-occupied status, creating a fluid rental housing market. For example, about 154,000 of these units were listed in the District’s tax records in both 2015 and 2024. Of those, 35,000 units switched occupancy status—from rental to owner-occupied or vice versa—during that time. That is a churn rate of 23 percent.
Certain housing types shift between rental and owner-occupied status more often than others. Condominiums had the highest churn rate at 27 percent during the same period, reflecting their volatile rental status. Flats were the most stable (and generally in use as rentals), with a churn rate of 13 percent. Even single-family homes, typically considered stable sources of owner-occupied housing, saw significant movement, with 21 percent changing rental status.
This fluidity underscores the dynamic nature of D.C.’s rental market. While rental apartments form its foundation, the frequent turnover in other housing types suggests a more flexible—yet potentially unstable—market than it might initially appear.
Rent controlled housing stock in D.C: Regulatory scope and market realities
The District’s rent control laws have broad legal scope but are significantly narrowed in practice through a set of exemptions. Under current law, rental units are subject to rent control unless they meet at least one of the following conditions:
- The housing provider owns fewer than five rental units.
- The unit is in a building that received a construction permit after 19752
- The unit was vacant at the time rent control took effect.
- The unit is receiving federal or District rental subsidies.
- The unit is in a property undergoing major rehabilitation funded by the D.C. Government.
As of 2024, there are an estimated 76,556 rent-controlled units across 2,417 buildings in the traditional rental housing market (defined here as rental apartment buildings and investment condominiums). Approximately 73,000 rental units in multifamily buildings are exempted from rent control because they are publicly owned or receive government subsidies (31,437 units), are in buildings built after 1977 (42,115), or are in rental apartment buildings with fewer than 5 units (150).
In addition to these traditional rentals, an estimated 8,251 units in non-traditional rentals (single-family homes, flats, or condominiums) may be subject to rent-control. These units belong to housing providers who own at least five rental units, either spread across different buildings (e.g., multiple single-family homes or flats) or concentrated in condominium or conversion buildings.3 We estimate that there are approximately 1,042 owners in this category, and 906 (88 percent) of these owners exclusively rent out properties in the non-traditional market.
Rent-controlled units are unevenly distributed across D.C.’s eight wards. The number and share of rent-controlled units in each ward are shaped primarily by zoning constraints, building age, and the availability of new subsidized or market-rate construction.
- Ward 8 has the highest number of rent controlled units (15,028 units), but they comprise only 61 percent of the ward’s rental stock due to growth in government-subsidized developments since 2015.
- Ward 3 has the highest concentration of rent-controlled units relative to total rentals (76 percent), a result of its older building stock and limited new development due to restrictive zoning.
- Ward 6 has the lowest share of rent-controlled units, reflecting its status as a focal point for new market-rate construction since 2007.
D.C.’s rental housing market is shaped by a blend of traditional and non-traditional stock, with complex regulatory layers such as rent control shaping landlord behavior and tenant experience. High levels of turnover in non-traditional units underscore the need for nuanced housing policy that accounts for both the volatility of the market and the structural constraints created by D.C.’s building age, zoning, and exemption framework.
The role of small housing providers in rental housing
This analysis focuses on rent-controlled properties due to the significant presence of small housing providers. Over 86 percent of small housing providers operate at least one rent-controlled property, underscoring their central role in this segment of the market. These providers—who own between 5 and 50 units—make up 84 percent of rent-controlled property owners and operate 25 percent of the units across 70 percent of the buildings. Buildings owned by small providers are typically older, with a median age of 87 years, compared to 73 years for those operated by large providers. The median small provider owns just nine units.
By contrast, very large providers—those managing more than 500 units—make up only 2 percent of rent-controlled housing providers. Yet they own 7 percent of rent-controlled buildings and operate 32 percent of rent-controlled units. For these larger housing providers, only 54 percent operate under rent control—compared to 86 percent for small providers—reflecting the greater likelihood of owning exempt properties (e.g., newer buildings or subsidized units).
As of 2024, the District’s rent-controlled housing is managed by approximately 2,139 housing providers, operating a total of 5,382 buildings. Of these, 1,801 (84 percent) fall within the small provider category, with 71 percent classified as very small providers (5 to 20 units). Collectively, small providers operate 20,812 rent-controlled units—about 25 percent of all rent-controlled units—spread across 3,761 buildings, which make up 70 percent of all rent-controlled buildings.
Geographic Concentration
Small housing providers have a presence in all eight wards, but their units are disproportionately concentrated in Wards 5, 7, and 8, which collectively account for half of all rent-controlled units operated by small providers. Across all wards, small providers are the dominant ownership group for rent-controlled properties. Their share is especially pronounced in Wards 5, 6, and 7, reflecting older housing stock and zoning patterns that favor smaller-scale multifamily properties.

Structural challenges for small providers
The challenges small housing providers face are not simply a function of scale but of exposure to financial and operational risks that larger providers are structurally better equipped to manage. Compared to larger firms, small housing providers:
- Have less financial cushion. Small providers often rely on rental income from a handful of properties for mortgage payments and expenses. A single missed rent payment can have a major financial impact, whereas large providers typically have reserves to absorb losses.
- Lack dedicated legal and administrative support. Without dedicated legal teams, small providers may struggle with evictions, lease disputes, and regulatory compliance.
- Face higher maintenance costs (relative to income). Lacking bulk purchasing power or in-house maintenance teams, small providers pay more for repairs and services.
- Use more limited tenant screening methods. Large providers have sophisticated screening processes, while small providers often rely on limited background checks, increasing the risk of disruptive tenancies.
- Have more difficulty securing financing for capital investments. Large providers benefit from lower-interest loans and greater investment opportunities, while small providers face stricter lending requirements and higher interest rates.
- Are disproportionately impacted by eviction delays. Evictions are costly and time-consuming, especially in the District where courts have limited capacity and laws have changed rapidly. Small providers often lack the legal expertise to navigate an already difficult eviction process.
- Are more exposed to market downturns. Unlike large providers who can spread risk across multiple properties, small providers are more vulnerable to economic downturns.
- Pay relatively higher insurance premiums: Large providers can secure better insurance policies and risk management strategies, while small providers often pay higher premiums and face greater liability exposure.
Small housing provider sentiments
To better understand the challenges small housing providers face, the D.C. Policy Center conducted a questionnaire inquiring about their experiences. While the number of respondents was limited—making the findings primarily anecdotal—the responses offer useful insight into the experiences and challenges faced by this segment of the rental market.4
Respondent profile
Most respondents owned and operated fewer than 20 units and reported renting to seniors and individuals with disabilities. Over half had been housing providers for more than 10 years, and a quarter for over 20 years. Their rental properties spanned all wards, though responses were most concentrated among owners operating in Wards 2 and 7.
Financial and maintenance challenges
- A majority of respondents indicated plans to reduce their rental stock, citing rising costs and aging properties that no longer generated enough income to justify continued investment.
- Nearly all respondents reported that rental income increases had failed to keep pace with rising maintenance and repair costs.
- Most owners reported spending between 25 and 50 percent of their rental revenue on maintenance. One in five reported missing mortgage payments or deferring maintenance due to insufficient rental income.
Rent non-payment and eviction Issues
- Rent payment issues—including non-payment, late payments, or partial payments—were common, with some owners reporting issues in up to 80 percent of their units.
- Most delinquent tenants were behind by more than 30 days.
- Three-quarters of respondents reported having evicted a tenant for non-payment, with past-due rents ranging from $7,000 to $42,000.
- Providers stated that evictions typically took at least six months of nonpayment, though some cases lasted several years.
Tenant tenure and vacancy rates
Tenant tenure varied widely, from two years to over 30 years. Small owners also reported a higher vacancy rate (10 percent) than the city average, though some consistently maintained vacancy rates below 3 percent.
Limited use of rent adjustment mechanisms
Few small owners used rent adjustment tools like voluntary agreements, capital improvement petitions, or substantial rehabilitation petitions. Only one respondent had filed a hardship petition to seek rent increases beyond what rent control laws allow; the rest had not used any rent-increase mechanisms.
Strains on providers
Respondents cited multiple operational and emotional burdens associated with rent control:
- Administrative complexity: The compliance process was described as overly bureaucratic and time-consuming.
- Stigma: Some providers felt unfairly labeled as negligent landlords despite efforts to maintain their properties.
- Difficulty managing problematic tenants: Respondents described the eviction process as lengthy, costly, and difficult to navigate without legal support.
- Eroding financial viability: With rent increases capped below the pace of rising costs, many small providers reported feeling financially strained and increasingly vulnerable.
Small housing providers are essential to the stability and affordability of D.C.’s rent-controlled housing market. However, they face systemic challenges that stem from fragmented ownership structures, regulatory burdens, and financial constraints. Any policy framework aimed at preserving affordability and expanding rental housing options must take into account the structural realities these providers face—and the critical role they play in the city’s housing ecosystem.
Rents by building type and owner size
Reliable rent data for the District’s rental housing is limited, especially for non-traditional rentals. Most systematic data come from CoStar, a real estate information and analytics company which tracks various information on income generating buildings. As a result, non-traditional rentals—such as single-family homes, flats, and smaller condominium units—are generally excluded.
Costar has rent data on 1,077 rental apartment buildings (35 percent of all rental apartment buildings) with 83,800 units (58 percent of rental apartment units). Of this group:
- Only 306 buildings with 5,359 units are operated by small housing providers.
- About half the units (44,216) are rent controlled, with 4,658 of these units operated by small providers.
Additional rent data in this report comes from Altos Research, which aggregates asking rents from online listings. While useful for observing trends in non-traditional rentals, this data is biased toward newly listed units and does not reflect actual rents paid—especially in rent-controlled buildings, which often have long-term tenants.
Challenges in collecting rent data
Rent data is gathered from multiple sources, including government surveys, private real estate platforms, and self-reported information from owners and tenants. Each of these sources has advantages and disadvantages.
The American Community Survey, for example, has comprehensive rent data but it tends to lag by more than a year, and cannot be linked to the rent-control status of buildings. CoStar, a leading provider of commercial and multifamily rental data, primarily collects information from property management companies and online listings. This approach may overlook smaller providers and unlisted rental agreements, leading to a skewed dataset. Similarly, Altos Research aggregates rental data from online listings, which tends to overrepresent newly listed units rather than capturing the actual prices tenants pay across the broader market. And because rent-controlled units tend to have longer tenure, they are less likely to be included in this dataset.
The analysis presented in the report relies on Costar data. Additional information from Altos is brought in to compare rents in units that are not traditional rentals. More information from the Altos data is included in the appendix.
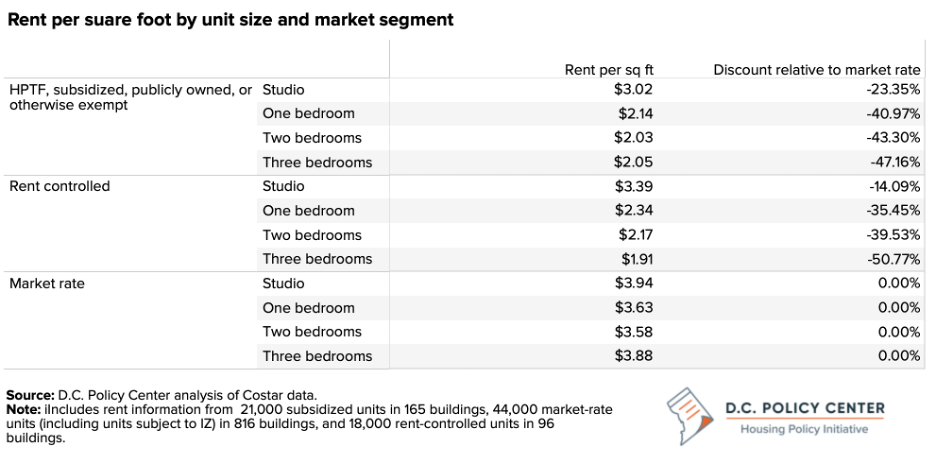
CoStar’s rent data consistently show that rent-controlled units have lower rents than market-rate units across all apartment sizes. The rent-control discount is smallest for studio apartments at 25 percent and can reach up to 62 percent for three-bedroom units. When rents are adjusted on a per-square-foot basis to account for unit size, these differences narrow slightly but remain significant. This is largely because older rental buildings, which are more likely to be rent-controlled, tend to have larger units. Even after adjusting for size, rent-controlled units still show substantial discounts: 14 percent for studios, 35 percent for one-bedroom apartments, 40 percent for two-bedroom apartments, and 50 percent for three-bedroom apartments.5
Rents by provider size
Among rent-controlled units with available data, large housing providers consistently charge higher rents than small housing providers across all unit sizes. Median rents for studios, one-bedroom, and two-bedroom apartments are 25 percent lower when offered by small housing providers compared to large ones. For three-bedroom units, the gap is smaller, with small providers charging 8 percent less.
When adjusted for unit size, these gaps close slightly for most unit types. However, for three-bedroom apartments, the trend reverses—small providers charge a 5 percent premium compared to large providers.
At the ward level, the only unit type where small housing providers appear to charge higher median rents than large providers is three-bedroom units in Wards 2, 7, and 8. However, this finding is based on a very limited dataset, with rent data available for only 95 buildings with three-bedroom units, of which just 27 are operated by small housing providers.
For all other unit types, small housing providers consistently charge lower rents. The largest discount is observed for one-bedroom units in Ward 6, where rents are 27 percent lower than those charged by large housing providers. The smallest discount is for two-bedroom units in Ward 7, where small housing providers charge 7 percent less.

Observed rent increases by provider size
Small and large housing providers do not increase rents at the same rate. While the District’s Rental Housing Commission sets the maximum allowable increase, providers may adjust rents below this limit due to rising vacancies or if a high proportion of tenants are seniors, low-income, or have disabilities, and have lower allowable rent increases by statute.
To analyze rent increase patterns, this report compared rental data from 2019 and 2024 using information from Costar. The dataset includes 620 rental apartment buildings, with 197 owned by small providers. Rent data was most commonly available for one-bedroom (620 buildings) and two-bedroom units (475 buildings) but was more limited for three-bedroom units (105 buildings).
This comparison highlights two key findings:
- Rent growth was below the allowable limit for all providers. Neither small nor large housing providers fully implemented allowable rent increases. Between 2019 and 2023, the Rental Housing Authority permitted a cumulative rent increase of 16.3 percent.6 However, the highest actual increase observed was 11.6 percent for two-bedroom units owned by large providers. This gap between the allowable and actual rent increases is partially the result of the rent increase moratorium that remained in effect throughout the public emergency period associated with the COVID-19 pandemic (and for 60 days afterward.)7
- Small providers raised rents more slowly than large providers. This was true all unit sizes, but especially notable for units other than studios, where large providers achieved significantly higher rent growth.8 Differences in rent increases will compound over time as rent controlled units are associated with longer tenant tenures. In an analysis of tenancy durations by census tract, renters who moved into their homes between 2000 and 2009 were 12 percentage points more likely to be living at the same address in 2018 if 75 percent of rental housing stock was rent controlled in their census tract.9
Why Small Providers Raise Rents More Slowly
Several structural and behavioral factors explain why small providers increase rents at a slower pace than their larger counterparts:
1. Regulatory and administrative constraints: Larger providers have legal and administrative teams to navigate rent control regulations and use hardship petitions or capital improvement petitions to increase rents. Small providers often lack this capacity.
2. Financial and maintenance constraints: Large providers often have the capital to fund renovations, apply for capital improvement petitions, and subsequently increase rents. Small providers, dealing with tighter cash flow and higher per-unit maintenance costs, may defer improvements, limiting their ability to justify rent increases.
3. Tenant retention and turnover rates: Smaller providers often prioritize long-term relationships with tenants to avoid vacancies and may be reluctant to implement maximum allowable rent increases due to concerns about tenant retention. In contrast, larger providers operate at scale and are more likely to prioritize business strategies that maximize revenue.
4. Tenant demographics and rent caps: Smaller providers are more likely to house seniors or residents with disabilities who are subject to a lower rent cap by statute. The American Community Survey data (2023) show that 16 percent of District’s residents report having some type of disability, but that share is 23 percent among renters who live in buildings with 5-49 units and 14 percent for renters who live in buildings with more than 50 units.
5. Economies of scale and professional management: Large providers often have dedicated property management teams that optimize rent-setting strategies and ensure consistent rent increases. They may also leverage data analytics to set competitive rents while remaining compliant with rent control laws. Smaller providers, who often self-manage properties, may lack access to such data and professionalized systems, leading to slower rent adjustments.
6. Market positioning and tenant expectations: Many small providers operate in buildings with lower-end or aging rental stock, often attracting cost-conscious tenants who are more price-sensitive. This limits their pricing power. Large providers, by contrast, may operate in more desirable locations or buildings with more amenities, giving them greater leverage to increase rents.
7. Limited use of vacancy resets: Rent control allows larger increases when units turn over. Higher tenant turnover among large providers allows more frequent rent resets. Small providers, with longer tenancies, miss these opportunities.
8. Exposure to unpaid rent and nonpayment risks: Smaller providers are more vulnerable to nonpayment of rent, as they depend on rental income to cover their mortgage and maintenance expenses. This financial strain can make it harder for them to justify or implement rent increases, especially if they have tenants who are behind on payments. Large providers, with multiple revenue streams, can better absorb losses and still implement rent hikes where possible.
Loss of rental units through conversions (2006-2025)
Owners facing financial hardship and limited revenue growth may convert apartments to condominiums and take units out of the market.10 To measure the number of units that were lost to the rental market due to conversion in D.C., we used the District’s tax data to track change in property type from 2006 to 2025.
This analysis shows that between 2006 and 2025, the District lost about 16,500 rental apartment units to condominium conversions. The vast majority of these converted units—73 percent (12,438 units)—were rent-controlled and were effectively removed from the regulated rent market.11 This loss of rent-controlled units represents 12.8 percent of the rent-controlled stock in in 2006.
Small housing providers, who owned 81 percent of rent controlled units lost to conversions, are particularly vulnerable to market and regulatory pressures.12 These owners typically lack the financial cushion, legal resources, and operational scale to withstand prolonged revenue stagnation. Their ability to raise rents is constrained not only by statutory limits—especially for senior and disabled tenants—but also by practical concerns around turnover and the risk of vacancies. Many also lack the capacity to file hardship petitions or make capital investments needed to command higher rents. Faced with these pressures, many small housing providers opt to sell their properties rather than continue operating under restrictive conditions.
Conversions among market rate units followed a different pattern. 4,009 market rate units were removed from the rental apartment stock between 2006 and 2025. While fewer market rate units were lost to conversion than rent-controlled units, this is largely a reflection of the relatively small size of market rate rental stock in D.C. Market rate units lost to conversion represents 13.4 percent of the current market rate rental apartment stock.13 In contrast to the trends seen in rent-controlled units, 86 percent of owners who converted market rate apartments to condominiums were large providers.
This long-term erosion of both rent-controlled and market-rate units through condominium conversion highlights the financial fragility of small housing providers and the structural limits of rent stabilization to preserve affordable rental stock under current conditions.
Conclusion and recommendations
Small housing providers—those managing between 5 and 50 units—are an essential but fragile component of D.C.’s rental housing landscape. They own 84 percent of D.C.’s rent-controlled buildings and operate 25 percent of all rent-controlled units. Yet, their financial and operational models differ significantly from larger landlords.
Small providers typically own older buildings (median age of 87 years vs. 73 years for large providers) and operate with tighter profit margins. Costar data show that their rents are approximately 25 percent below those charged by large landlords for similarly sized units, making it difficult to cover rising maintenance and operational costs. From 2019 to 2024, rent growth for small providers also lagged, reflecting their limited pricing power and a greater emphasis on tenant retention to avoid costly vacancies. While this makes small providers a key source of naturally occurring affordable housing, it also contributes to their financial instability. Many report that rental income has not kept pace with expenses, limiting their ability to sustain their properties long-term.
Several factors may explain differences in rents and rent increases for small and large housing providers. Small providers are more likely to house long-term tenants, seniors, and residents with disabilities, populations subject to lower statutory rent increases. Their operations are also more vulnerable to financial shocks: non-payment of rent, high turnover costs, and costly maintenance in aging buildings all reduce financial viability. Many lack the administrative capacity to file hardship or capital improvement petitions, further constraining revenue growth.
As a result, small providers are increasingly exiting the rental market. From 2006 to 2025, D.C. lost approximately 16,500 rental units to condominium conversions, over 73 percent of which were rent-controlled. Over 80 percent of these units were owned by small providers. Survey data indicate that more than half of small providers are planning to reduce their rental stock, and many units have been permanently removed due to disrepair.
For small providers, non-payment of rent is a widespread issue, with 75 percent of small providers reporting evictions due to unpaid rent, and past-due amounts ranging from $7,000 to $42,000. Additionally, vacancy rates among small providers tend to be higher than the city average, further highlighting the financial strain on these providers.
This erosion of naturally affordable housing calls for targeted interventions to stabilize small providers and preserve rent-controlled housing. Below are specific policy recommendations tailored to this purpose:
- Reduce administrative burdens for small providers.
- What it does: Streamlines compliance with rent control laws by simplifying hardship and capital improvement petition processes and reducing documentation requirements for allowable rent increases. The city could also provide legal and property management support services.
- Why it matters: Many small providers lack the expertise or resources to navigate complex regulatory processes. Simplifying compliance reduces barriers to lawful rent adjustments and ensures financial sustainability without sacrificing tenant protections.
- Expand financial support for small providers.
- What it does: Establishes low-interest loan programs or direct grants for capital improvements and code compliance in aging rent-controlled buildings, particularly those owned by small providers.
- Why it matters: Most small providers operate aging housing stock and face difficulty accessing capital for maintenance. Public financing tools would allow them to reinvest in their properties and continue operating rent-controlled units safely and affordably.
- Improve non-payment protections.
- What it does: Offers small providers access to tenant screening tools, rent insurance, and emergency rental assistance programs to buffer against rent arrears and evictions.
- Why it matters: Missed rent payments are a leading cause of financial distress for small providers. Reducing this risk helps preserve housing stability and discourages providers from exiting the rental market or converting properties.
- Offer targeted tax relief for providers who house vulnerable residents.
- What it does: Provides property tax credits to small providers who rent to seniors or tenants with disabilities and therefore are subject to more limited rent increases under rent control law.
- Why it matters: These tenants generate lower revenue, but providers are not compensated for the associated opportunity cost. Tax relief can bridge the financial gap and make it feasible to continue serving vulnerable populations.
- Incentivize long-term affordability covenants.
- What it does: Offers direct cash payments or tax abatements to small providers in exchange for multi-year affordability covenants that preserve rent-controlled status or limit rent growth.
- Why it matters: This creates a voluntary, market-aligned mechanism to preserve affordability without regulatory enforcement, reducing the incentive to convert to condominiums or leave units vacant.
- Reassess costly regulatory mandates.
- What it does: Exempts or adjusts costly energy and environmental requirements such as Building Energy Performance Standards (BEPS) for rent-controlled buildings owned by small providers, especially those lacking individual metering.
- Why it matters: These mandates impose disproportionate burdens on older buildings with low rental revenue. Relief from unfunded mandates can help small landlords remain compliant and operational without accelerating unit loss.
While this report focuses on small providers, it also raises broader questions about the District’s restrictive housing policies that undermine investments in affordability and limit investor interest.
To ensure long-term affordability and a healthy rental market, the District should pair preservation efforts with pro-growth housing policy:
- Encourage higher-density development through upzoning in low-density neighborhoods.
- Offer tax incentives for preserving affordable rental housing, especially in aging buildings.
- Fund targeted subsidies for providers who maintain long-term affordability.
- These strategies would support existing providers while expanding the overall housing supply—ensuring that affordability is not limited to a shrinking pool of rent-controlled units, but extended more broadly across the market.
These measures would encourage a healthier rental market by attracting investment, increasing the supply of rental housing, and ensuring that rents reflect actual market conditions.
Appendix
Data and Methodology
Data Cleaning
Removal of SSLs with the same address
An SSL (Square Suffix Lot) is a unique identifier assigned to every property in the District of Columbia. The ITSPE dataset was cleaned to remove multi-family SSLs that share the same address. Most likely these are units owned by different legal entities under one building. 316 apartment buildings, 55 conversions, and 30 flats were removed.
Multiple SSLs in CAMA
In the CAMA files, some observations share the same SSL. Apartments utilize the CAMA commercial file for getting unit counts and two patterns emerged among these observations: either one SSL contained a unit count while the others had NAs, or all observations had unit counts with one observation containing the sum of those counts. These two rules helped eliminate multiple duplicate observations.
There were 490 observations with the same SSL, representing 130 distinct SSLs. After applying the two filtering rules, 363 duplicate observations were removed, leaving 130 unique observations.
Conversions and Flats were handled differently than the residential apartment buildings. 18 SSLs were present multiple times in the dataset. Given there was no discernible pattern for filtering, unlike the commercial CAMA file, and the small number of properties, these were removed entirely. We then removed 439 properties containing only one unit following Tatian (2011) as these properties were misclassified as multi-family.
These methods produced 17,9731 units and 15,625 buildings.

The basic process for estimating the number of units in multi-family buildings is essentially five steps:
- The observations with multiple SSLs were either removed or cleaned
- Multi-family properties where the addresses were the same were removed
- A unit count is assigned based on its availability in CAMA or ARU, if it is unavailable then the property has a missing unit count
- These missing units are estimated using a regression
- Finally, observations that the regression could not estimate are assigned the average unit count of that property type. Steps 3-5 ensure that all buildings have an estimated unit count
Renter/Owner Status
A combination of methods was used to determine whether a property or unit is owner-occupied or available for rent. Properties classified as apartment buildings were automatically assumed to be rentals, while cooperatives were assumed to be owner-occupied. For all other property types, the primary method of determining ownership status was through the homestead exemption code. If a property received a code of 1 or 5, it was labeled as owner-occupied. Additionally, a match was made between the owner’s address and the property address. If the two were identical, the property was assumed to be owner-occupied.
Initially, all properties are considered available for rent. If they have a homestead exemption, they are considered owner-occupied. Matching the addresses for single-family units, such as homes and condominiums, helps identify owner-occupied properties. Since almost all flats are fewer than five units, address matching was also applied to flats, as a match between the owner’s address and the property address accurately reflects owner-occupancy status for smaller buildings. In summary, single-family homes, condominiums, and flats were considered owner-occupied if they had a homestead exemption or if the owner’s address matched the property address. For conversions, only the homestead exemption criteria were applied.
Estimating Unit Counts
Multi-Family Buildings
Determination of Unit Counts
To determine the number of units in apartment buildings, several sources were used depending on the type of property. The CAMA commercial was the primary source of the number of units and when unavailable, the count was derived from the ARU. This approach mimics the D.C. Policy Center’s work in Appraising the District’s Rentals, which used CAMA first, followed by Costar, and finally ARU-derived unit counts. For conversions and flats, the residential CAMA file was used first then the ARU-derived unit counts.
Estimating Missing Unit Counts
There are 224 multi-family buildings missing unit counts, including 200 apartments, 12 flats, and 12 conversions (see Table 2). To estimate these, a regression was done for apartments, conversions, and flats, separately. Only the results from apartments and flats were suitable. Most but not all missing units could be estimated using a regression. When a regression estimate could not be done, the average number of units for that property type was assigned to these properties. From these two methods estimates for all missing unit counts for multi-family buildings were done.

Single-Family and Condominiums
Both single-family and condominiums are considered individual taxable entities and represent one unit each. To connect individual condominium units to buildings, first, the condominium relate file containing a unique ‘Regime’ ID for each property was merged with the condo relate table which maps each unit to its ‘Regime’ ID using the SSL. This was used to get a count of the number of buildings housing rental condominium units. Not all units could be mapped, so the remaining were matched by grouping the street addresses and counting up the number of units at each point, like ARU-derived unit counts. 53,812 condominium units have valid ‘REGIME’ IDs totaling 3,070 properties. 6,517 units could not be mapped, and the street addresses were grouped totaling 1,210 buildings. 6,278 investment condominium units were mapped to 110 REGIME ID. 136 units in investment condominiums were unable to be mapped and were grouped together into 13 address points. Altogether this produced 7,121 buildings.
Rent Control Exemptions
All rental properties in the District of Columbia are subject to rent control unless they qualify for one or more exemptions. We considered 5 exemptions: if the property received it’s building permit after 1975, the owner is a natural person who owns less than 5 units total, the property is publicly owned, non-taxable, or receiving public subsidies.
Built or received building permits after 1975.
The “Actual Year Built” variable in the CAMA datasets was used to determine if a property received its building permit after 1975 or was built after 1977.
Owns less than 5 units.
The second major exemption is when the property is owned by a natural person whose portfolio contains less than 5 rental units. To determine if a natural person owns a structure an algorithm was developed to detect the presence of corporate legal identifiers like “LLC” “INC” “Foundation”, and other legal entities such as “Church”, “Trust”, “University”, “Government” etc. Once a natural person variable was created, we determined how many units were owned by the same person using the owner’s address. We used the owner’s address to determine if a unit was owned by the same entity/person. Following Tatian (2011), the owner’s address is in a standardized format throughout the dataset and avoids issues with spelling and input errors in the owner’s name. 98% of multifamily properties provided the owner’s address to the Office of Tax Revenue.
Publicly Owned and Non-taxable
Certain properties are exempt from rent control regulation because they are owned by public entities or are non-taxable. Properties owned by public entities including the Federal government and the District of Columbia were flagged based on the owner’s name and tax codes “DC” and “US”. Additionally, certain religious, humanitarian, and nonprofit groups are tax-exempt and have codes E0 to E9.
Publicly assisted
Properties receiving public subsidies are exempt from rent control. The Department of Housing and Urban Development maintains a database of properties receiving Section 8 vouchers. According to HUD’s database, 98 properties are receiving such vouchers in DC. We matched 90 of them to our dataset by address. 22 are condominium units that are not considered rentals, and 5 are cooperative properties that are considered owner-occupied. Among rentals there are 51 apartment buildings, 8 condominium units, 1 conversion building, and 3 single-family homes receiving Section 8 vouchers.
Current rent control law in the District of Columbia
D.C.’s current rent control system is based on the Rental Housing Act of 1985, which applies to most rental properties with key exemptions. Buildings with construction permits issued after 1975, housing providers with fewer than five rental units, units that were vacant when the law took effect, and those receiving federal or local subsidies are not subject to rent control.
The 1985 law allows for rent adjustments based on capital improvements, inflation, changes in services, and a housing provider’s return on investment14—aiming to balance tenant protections against excessive rent hikes while ensuring providers can still operate profitably (Turner, 1990).
In 2006, the Rent Control Reform Amendment Act further standardized annual rent increases, tying them to the growth in the local Consumer Price Index plus 2 percent (CPI + 2%).15,16 For elderly or disabled tenants, rent increases are capped at the lower of the CPI or 5 percent. Upon vacancy, housing providers can raise rents by 20 percent if the prior tenant had lived there for over 10 years, or by 10 percent for shorter tenancies.17
Housing providers can also request larger rent increases under specific circumstances:18
- Hardship petitions: If a provider’s return on investment falls below 12 percent, they can request a rent increase.19 In 2017, a rule was introduced that automatically approves these petitions if the government doesn’t respond within 90 days20 — though this excludes units rented to elderly, disabled, or low-income tenants.21
- Substantial rehabilitation petitions: Providers can increase rents by up to 25 percent for major renovations that cost more than half the unit’s value.22
- Capital improvement petitions: Temporary surcharges23 are allowed to cover the cost of improvements, but the work must be completed before rents are raised. Surcharges for smaller projects24 can’t exceed 15 percent of base rent, while larger projects allow up to 20 percent.
- Services and facilities petitions: Rent can be adjusted if amenities are added or removed.
- Voluntary agreements: (currently on hold) If 70 percent of tenants agree, providers can negotiate higher rents in exchange for building improvements.25
D.C.’s rent control system is trying to strike a balance: preventing rent hikes from pushing people out while giving providers some room to cover their costs and keep housing units livable. It is a delicate trade-off that policymakers are still grappling with today.
Recent Developments
In recent years, momentum has grown for reforming D.C.’s rent control laws, driven by increasing tenant advocacy and concerns over housing affordability. In 2019, when the rent control laws were up for renewal, lawmakers introduced five separate bills proposing significant changes to the system. These included eliminating the current formula that allows annual rent increases based on the Consumer Price Index (CPI) + 2 percent, as well as removing provisions that permit rent hikes through rehabilitation and capital improvement petitions. One proposal suggested introducing income eligibility requirements for rent-controlled units to ensure benefits are targeted toward lower-income residents.
At the same time, the D.C. Council imposed a two-year moratorium on voluntary agreements, which allow providers and tenants to negotiate rent increases in exchange for building improvements. The Council even considered eliminating them entirely,26 reflecting broader skepticism about whether these agreements truly benefit tenants or merely serve as a loophole for providers to bypass rent control limits.
Rent Control Amid Rising Inflation
In 2023, with historically high inflation pushing up costs across the board, rent control has become an even more contentious issue. That year, under the CPI + 2 percent formula, housing providers could have increased rents by 8.9 percent. In response, the D.C. Council passed emergency legislation temporarily capping rent hikes at 6 percent for most tenants and 4 percent for seniors and disabled residents. Additionally, the law set a two-year cap, limiting total rent increases to 12 percent for the general population and 8 percent for seniors and disabled tenants during that period.
The “Certificate of Assurance” Controversy
An interesting aspect of the District’s rent control statute is a provision meant to protect housing providers from future expansions of rent control.27 The law originally promised that if a property exempt from rent control were ever brought under regulation, the city will compensate the housing provider for lost rental income. Housing providers could apply for a Certificate of Assurance, a legal document memorializing this promise. This provision was designed to encourage investment in D.C.’s rental housing market by reassuring developers that new construction would remain exempt from rent control.28
However, in 2020, the D.C. Department of Housing and Community Development revealed that no Certificates of Assurance had ever been issued. That same year, the Council imposed a moratorium29 on issuing new certificates and is now considering permanently repealing the provision altogether.30
The Ongoing Debate
These moves reflect the Council’s efforts to respond to rising costs while balancing the interests of tenants and providers, but they also underscore the ongoing debate over how far rent control should go—and whether these policies are the right tool to address the city’s long-term housing challenges.
Additional tables and maps
Appendix Figure 3.
Appendix Figure 4.

Appendix Figure 5.

Appendix Figure 6.
Altos findings
Rents of small providers by owner size and rent control status
| Rent Control | Owner Size | Median Rent | Unit Size | Number of Units |
| No | Large | 2546 | 714 | 13786 |
| No | Small | 2054 | 882 | 1890 |
| Yes | Large | 2126 | 607 | 9283 |
| Yes | Small | 2200 | 800 | 1026 |
Source: Altos, received December 2024
Rents by bedroom size, rent control status, and owner size
| Owner Size | Type | Rent Control | Median Rent | Median Unit Size (sq/ft) | Number of Units | Number of Properties |
| Small | Studio | No | 1422 | 660 | 117 | 47 |
| Small | Studio | Yes | 1688 | 430 | 66 | 29 |
| Small | 1Bedroom | No | 1795 | 739 | 716 | 402 |
| Small | 1 Bedroom | Yes | 1975 | 700 | 414 | 203 |
| Small | 2 Bedroom | No | 2350 | 950 | 757 | 389 |
| Small | 2 Bedroom | Yes | 2450 | 850 | 407 | 203 |
| Small | 3 Bedroom | No | 3757 | 1490 | 370 | 172 |
| Small | 3 Bedroom | Yes | 3131 | 1000 | 171 | 81 |
| Large | Studio | No | 2000 | 508 | 2199 | 112 |
| Large | Studio | Yes | 1799 | 456 | 3486 | 240 |
| Large | 1Bedroom | No | 2489 | 690 | 7961 | 149 |
| Large | 1 Bedroom | Yes | 2255 | 693 | 3997 | 369 |
| Large | 2 Bedroom | No | 3468 | 1021 | 3830 | 138 |
| Large | 2 Bedroom | Yes | 3148 | 975 | 1705 | 278 |
| Large | 3 Bedroom | No | 4764 | 1266 | 214 | 34 |
| Large | 3 Bedroom | Yes | 3600 | 1135 | 155 | 71 |
Source: Altos, received December 2024
[1] These units are counted as non-rental if either of the following two criteria hold true: that the unit receives homestead exemption The unit Cooperatives, where residents own a “share” of the building and grounds which entitles them to live in one of the units generally have restrictions against rental use.
[2] Some buildings that received construction permits by 1975 were not built until 1976 or 1977.
[3] Please see appendix for methodology.
[4] We received 26 complete responses, with 20 respondents owning fewer than 50 rental units—qualifying them as small providers.
[5] See appendix for data.
[6] This is the compound rate derived by allowable increases announced by the Rental Housing Commission, available at https://rhc.dc.gov/page/annual-rent-adjustments-2012-–-present.
[7] Additionally the city enacted laws to ensure that residents cannot be evicted for the duration of the public health emergency plus sixty days; nor can they be charged late fees for the duration of the public health emergency. For details, see https://coronavirus.dc.gov/rent#:~:text=Rent%20increases%20are%20also%20prohibited,of%20the%20Tenant%20Advocate’s%20website.
[8] These rent increases differed from market rate rents. We were able to match data on rents in market rate buildings from 2019 and 2024, although rent data was only available for a total of 3,484 units, or about 10 percent of the total market rate stock. Market rate rents increased between 2019 and 2024 by the following percentages (weighted by number of units):
Studio apartments: 6.17 percent
One bedrooms: 14.49 percent
Two bedrooms: 6.15 percent
[9] Tenant duration was compared to census tracts where rent controlled housing comprised less than one quarter of the rental housing.
Sayin, Y. (April 1, 2020). Appraising the District’s rentals. D.C. Policy Center. https://www.dcpolicycenter.org/publications/appraising-districts-rentals/
[10] Diamond, Rebecca, Tim McQuade, and Franklin Qian. 2019. “The Effects of Rent Control Expansion on Tenants, Landlords, and Inequality: Evidence from San Francisco.” American Economic Review 109 (9): 3365–94.
[11] The remaining 1,881 previously rent-controlled units are currently single-family homes.
[12] This is true of units for which we could determine owner size. There were 6,449 units for which we could not determine owner size.
[13] Calma, E., & Sayin, Y. (2025, March 13). Topa’s promise and pitfalls: Balancing Tenant Rights, affordability, and Housing Investment in Washington, D.C. D.C. Policy Center. https://www.dcpolicycenter.org/publications/topaspromise-and-pitfalls-in-dc/. Market rate rental apartment stock is only 29,717 units (not including inclusionary conversions).
[14] Section 206 of D.C. Law 6-10, 32 DCR 3089, effective July 17, 1985.
[15] D.C Law 16-0145, 53 DCR 4889, effective Aug. 5, 2006.
[16] This provision is temporarily on hold through April 2024. In June 2023, the Council passed emergency and temporary legislation to cap rent increases in rent-controlled buildings at 6 percent, after the Rental Housing Commission approved of a 8.9 percent increase in rents, which reflected the high inflation observed in 2022. B25-0294 – Rent Stabilized Housing Inflation Protection Temporary Amendment Act of 2023. DC Legislation Information Management System. https://lims.dccouncil.gov/Legislation/B25-0294
[17] Previously, rents were allowed to increase to match the rent charged for a substantially similar unit, but no more than 30 percent. The Vacancy Increase Reform Amendment Act of 2018 changed this provision. (D.C. Law 22-223, 66 DCR 185, Effective Feb. 22, 2019).
[18] The petitions are filed with the city’s Rent Administrator. If the Rent Administrator denies the petition, the housing provider can seek a hearing at the Office of Administrative Hearings to settle the dispute.
[19] Here, rate of return is defined as net income earned over a year as a share of provider’s equity in the building.
[20] DC Law 25-0042 Effective from Aug 23, 2023, Expires on Apr 04, 2024.
[21] Low income here is defined as households making under 60 percent of Area Median Income. The Elderly and Tenants with Disabilities Protection Amendment Act of 2016, D.C. Law 21-239, 64 DCR 1588, effective Apr. 7, 2017.
The Elderly Tenant Rental Housing Capital Improvement Relief Amendment Act of 1993 had stipulated a similar set of rules twenty-five years earlier but had exempted tenants earning less than $40,000 per year (as opposed to the now 60 percent of area median income). D.C. Law9-0154, 39 DCR 5673, effective Sept. 26, 1992.
[22] D.C. Code § 42–3502.14.
[23] This allowance was authorized by the 1985 Rental Housing Act but was later modified in 1989 to state that increases imposed on a tenant’s monthly rent to pay for capital improvements must be temporary and cannot be included in the base rate used to calculate the allowable rent increase. The Capital Improvements Amendment Act of 1989 D.C. Law 8-48, 36 DCR 5788, effective Oct. 19, 1989.
[24] Specifically, if the capital improvement is building-wide, like replacing a roof, the costs are spread over eight years and the rent surcharge is limited to 20 percent of the rent; if they pertain to some units only (like replacing windows), the costs can be spread over 64 months and the surcharge, which only applies to tenants whose units were improved, cannot be more than 15 percent of the rent.
[25] The Department of Housing and Community Development’s Rental Accommodations Division must review and approve the voluntary agreements (but their decision can be challenged and reversed by administrative courts or by the Rental Housing Commission). Voluntary agreements receive a lot of interest in the press, but data from 2006 to 2018 show that they are rare. The city receives somewhere between 10 and 30 such petitions each year (and some are for single-family homes), which appears to represent somewhere between 0.4 percent to 1 percent of all the buildings covered by the rent control law. Information is not available on the outcomes of all petitions. Among the 167 petitions where it was possible to track an outcome, 80 percent of the voluntary agreements were approved, about 5 percent were rejected, and 15 percent did not move forward. For details, see https://dcpolicycenter.wpenginepowered.com/wp-content/uploads/2020/03/Voluntary-agreements-1.png
[26] Act A25-0151 Published in DC Register Vol 70 and Page 009407, Expires on Sep 27, 2023.
[27] D.C. Official Code § 42–3502.21. Certificate of assurance. Available at https://code.dccouncil.gov/us/dc/council/code/sections/42-3502.21
[28] Council of the District of Columbia Committee on Housing and Neighborhood Revitalization Hearing Record. Available at https://lims.dccouncil.gov/downloads/LIMS/45751/Oversight_Hearing_Record/HR23-0167-Oversight_Hearing_Record.pdf?Id=111994.
[29] The original moratorium was enacted on December 23, 2020 and expired on August 04, 2021 (D.C. Law 23-0173). Since then, the Council has extended the moratorium multiple times.
[30] B25-0633 – Certificate of Assurance Repeal Amendment Act of 2023. Available at https://lims.dccouncil.gov/Legislation/B25-0633.
Endnotes
- These units are counted as non-rental if either of the following two criteria hold true: that the unit receives homestead exemption The unit Cooperatives, where residents own a “share” of the building and grounds which entitles them to live in one of the units generally have restrictions against rental use.
- Some buildings that received construction permits by 1975 were not built until 1976 or 1977.
- Please see appendix for methodology.
- We received 26 complete responses, with 20 respondents owning fewer than 50 rental units—qualifying them as small providers.
- See appendix for data.
- This is the compound rate derived by allowable increases announced by the Rental Housing Commission, available at https://rhc.dc.gov/page/annual-rent-adjustments-2012-–-present.
- Additionally the city enacted laws to ensure that residents cannot be evicted for the duration of the public health emergency plus sixty days; nor can they be charged late fees for the duration of the public health emergency. For details, see https://coronavirus.dc.gov/rent#:~:text=Rent%20increases%20are%20also%20prohibited,of%20the%20Tenant%20Advocate’s%20website.
- These rent increases differed from market rate rents. We were able to match data on rents in market rate buildings from 2019 and 2024, although rent data was only available for a total of 3,484 units, or about 10 percent of the total market rate stock. Market rate rents increased between 2019 and 2024 by the following percentages (weighted by number of units): Studio apartments: 6.17 percent; One bedrooms: 14.49 percent; Two bedrooms: 6.15 percent
- Tenant duration was compared to census tracts where rent controlled housing comprised less than one quarter of the rental housing. Sayin, Y. (April 1, 2020). Appraising the District’s rentals. D.C. Policy Center. https://www.dcpolicycenter.org/publications/appraising-districts-rentals/
- Diamond, Rebecca, Tim McQuade, and Franklin Qian. 2019. The Effects of Rent Control Expansion on Tenants, Landlords, and Inequality: Evidence from San Francisco. American Economic Review 109 (9): 3365–94.
- The remaining 1,881 previously rent-controlled units are currently single-family homes.
- This is true of units for which we could determine owner size. There were 6,449 units for which we could not determine owner size.
- Calma, E., & Sayin, Y. (2025, March 13). Topa’s promise and pitfalls: Balancing Tenant Rights, affordability, and Housing Investment in Washington, D.C. D.C. Policy Center. https://www.dcpolicycenter.org/publications/topaspromise-and-pitfalls-in-dc/. Market rate rental apartment stock is only 29,717 units (not including inclusionary conversions).
- Section 206 of D.C. Law 6-10, 32 DCR 3089, effective July 17, 1985.
- D.C Law 16-0145, 53 DCR 4889, effective Aug. 5, 2006.
- This provision is temporarily on hold through April 2024. In June 2023, the Council passed emergency and temporary legislation to cap rent increases in rent-controlled buildings at 6 percent, after the Rental Housing Commission approved an 8.9 percent increase in rents, which reflected the high inflation observed in 2022. B25-0294 – Rent Stabilized Housing Inflation Protection Temporary Amendment Act of 2023. DC Legislation Information Management System. https://lims.dccouncil.gov/Legislation/B25-0294
- Previously, rents were allowed to increase to match the rent charged for a substantially similar unit, but no more than 30 percent. The Vacancy Increase Reform Amendment Act of 2018 changed this provision. (D.C. Law 22-223, 66 DCR 185, Effective Feb. 22, 2019).
- The petitions are filed with the city’s Rent Administrator. If the Rent Administrator denies the petition, the housing provider can seek a hearing at the Office of Administrative Hearings to settle the dispute.
- Here, rate of return is defined as net income earned over a year as a share of provider’s equity in the building.
- DC Law 25-0042 Effective from Aug 23, 2023, Expires on Apr 04, 2024.
- Low income here is defined as households making under 60 percent of Area Median Income. The Elderly and Tenants with Disabilities Protection Amendment Act of 2016, D.C. Law 21-239, 64 DCR 1588, effective Apr. 7, 2017. The Elderly Tenant Rental Housing Capital Improvement Relief Amendment Act of 1993 had stipulated a similar set of rules twenty-five years earlier but had exempted tenants earning less than $40,000 per year (as opposed to the now 60 percent of area median income). D.C. Law9-0154, 39 DCR 5673, effective Sept. 26, 1992.
- D.C. Code § 42–3502.14.
- This allowance was authorized by the 1985 Rental Housing Act but was later modified in 1989 to state that increases imposed on a tenant’s monthly rent to pay for capital improvements must be temporary and cannot be included in the base rate used to calculate the allowable rent increase. The Capital Improvements Amendment Act of 1989 D.C. Law 8-48, 36 DCR 5788, effective Oct. 19, 1989.
- Specifically, if the capital improvement is building-wide, like replacing a roof, the costs are spread over eight years and the rent surcharge is limited to 20 percent of the rent; if they pertain to some units only (like replacing windows), the costs can be spread over 64 months and the surcharge, which only applies to tenants whose units were improved, cannot be more than 15 percent of the rent.
- The Department of Housing and Community Development’s Rental Accommodations Division must review and approve the voluntary agreements (but their decision can be challenged and reversed by administrative courts or by the Rental Housing Commission). Voluntary agreements receive a lot of interest in the press, but data from 2006 to 2018 show that they are rare. The city receives somewhere between 10 and 30 such petitions each year (and some are for single-family homes), which appears to represent somewhere between 0.4 percent to 1 percent of all the buildings covered by the rent control law. Information is not available on the outcomes of all petitions. Among the 167 petitions where it was possible to track an outcome, 80 percent of the voluntary agreements were approved, about 5 percent were rejected, and 15 percent did not move forward. For details, see https://dcpolicycenter.wpenginepowered.com/wp-content/uploads/2020/03/Voluntary-agreements-1.png
- Act A25-0151 Published in DC Register Vol 70 and Page 009407, Expires on Sep 27, 2023.
- D.C. Official Code § 42–3502.21. Certificate of assurance. Available at https://code.dccouncil.gov/us/dc/council/code/sections/42-3502.21
- Council of the District of Columbia Committee on Housing and Neighborhood Revitalization Hearing Record. Available at https://lims.dccouncil.gov/downloads/LIMS/45751/Oversight_Hearing_Record/HR23-0167-Oversight_Hearing_Record.pdf?Id=111994.
- The original moratorium was enacted on December 23, 2020 and expired on August 04, 2021 (D.C. Law 23-0173). Since then, the Council has extended the moratorium multiple times.
- B25-0633 – Certificate of Assurance Repeal Amendment Act of 2023. Available at https://lims.dccouncil.gov/Legislation/B25-0633.