
The U.S. Census Bureau’s recently-released estimates of components of population changes (April 2010 to July 2020) show that the District’s population total rose to 712,816 between 2019 and 2020—a gain 4,563 new residents. This gain is approximately a third of the average annual change seen in the first half of this decade. The natural increase, or the number of births minus deaths, continues to serve as the major driver of the District’s population growth, accounting for 67 percent of the net increase – the fourth highest natural growth rate in the country.
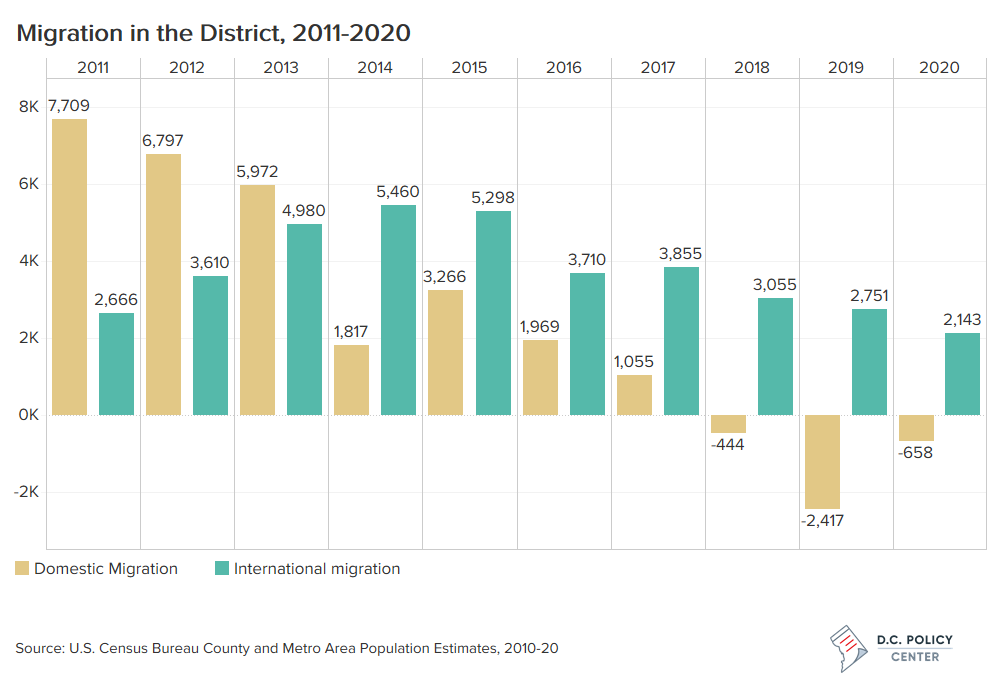
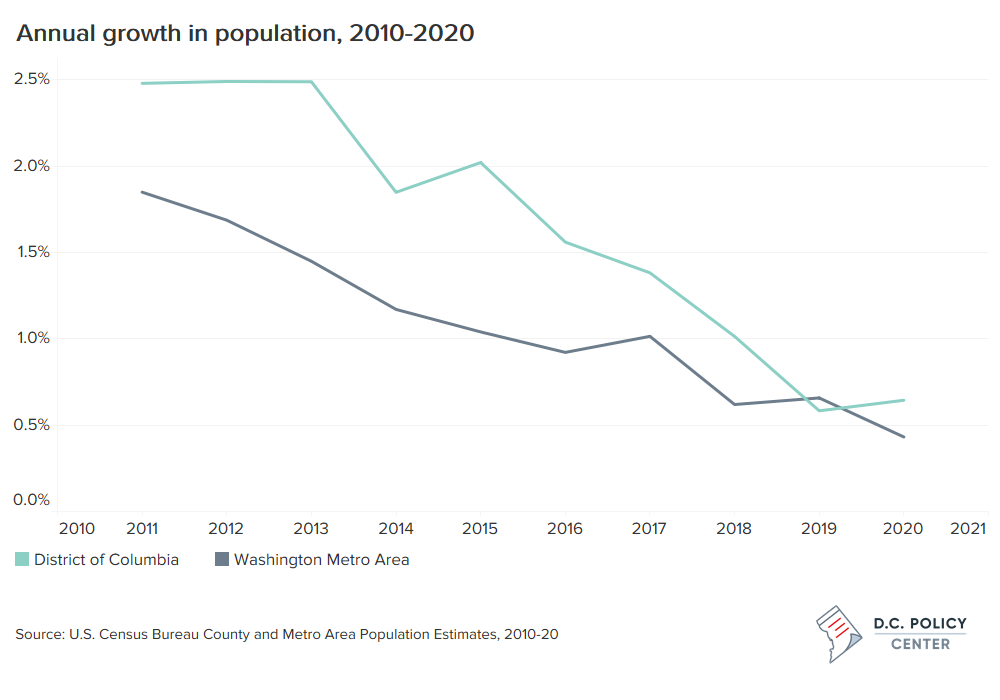
Of note, domestic migration between 2019 and 2020 was almost a quarter of what was seen in the preceding year, though it remains negative. The District’s population growth rate of 0.64 percent shows slight improvement compared to that of the previous year (0.58 percent). However, the District’s growth rate is almost twice the national rate (0.35 percent), and is also greater than that of the Washington metropolitan area (0.43 percent), which is the lowest population growth rate observed by the metro area since 2010.
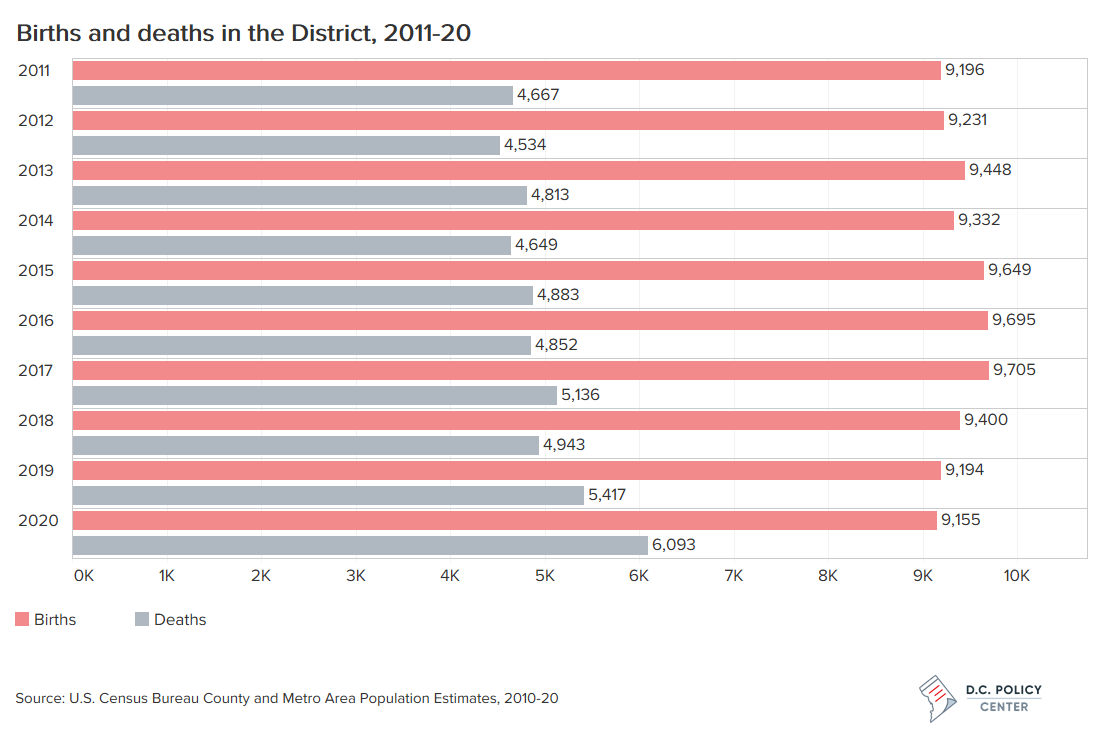
Losses through deaths and domestic out-migration continue to be offset by strong births and international migration
According to the estimates, births and international migration added 11,928 new residents to the District (9,155 and 2,143 respectively), while deaths and out-migration decreased the population by 6,751 (6,093 and 658 respectively). Keeping with the trends seen last year, the natural increase and births in D.C., along with the greater metro area, are slightly lower than that of previous years, yet remain strong enough to offset deaths. Perhaps as a consequence of COVID-19, the number of deaths in the District grew by 12.5 percent compared to last year, accounting for the slight decline in natural growth.
The net migration of 1,485 residents into D.C. in 2020 was 3.4 times that seen in 2019 (334 residents), driven by a gain of 2,143 new residents through international in-migration. While the District experienced net negative domestic migration for a third year in a row, it saw a much lower net number of residents moving this year (658 residents)—a decrease in population that is 2.7 times less than the 2,417 residents who left last year.
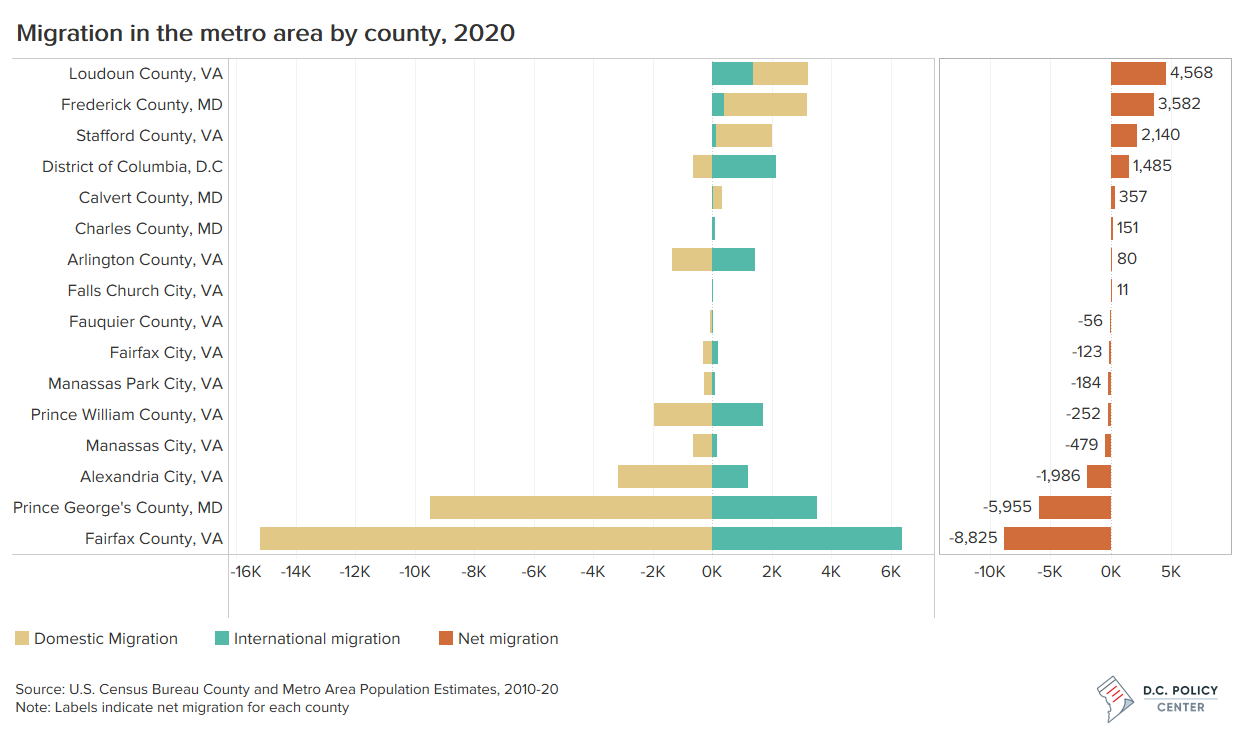
Compared to the rest of the region, D.C. had a higher population growth rate than 10 of 15 counties of the larger metro area, 5 of which experienced population losses. Stafford, Loudoun, and Frederick counties saw the strongest growth rates (almost 2 percent) between 2019 and 2020, as well as the highest net migration rates per 1,000 people.
While Fairfax County reported the largest absolute amount of international migration, it also saw the largest absolute domestic out-migration numbers, which far exceeded the former, losing a total of 8,825 residents. Relative to the size of population, Alexandria, Manassas, and Manassas Park experienced the highest rates at which residents left the area for other parts of the country.
Taken together, the D.C. metropolitan area saw its lowest growth rate in a decade, at 0.43 percent, as well as its lowest numbers for net migration (domestic and international) and natural population increase (births and deaths). Among the 10 most populous metro areas, the Washington metropolitan area fared in the middle in terms of population growth rate and natural increase. For net and domestic migration, it fell in the bottom half, while for international migration it fell in the top half.
How does D.C. compare to the rest of the country?
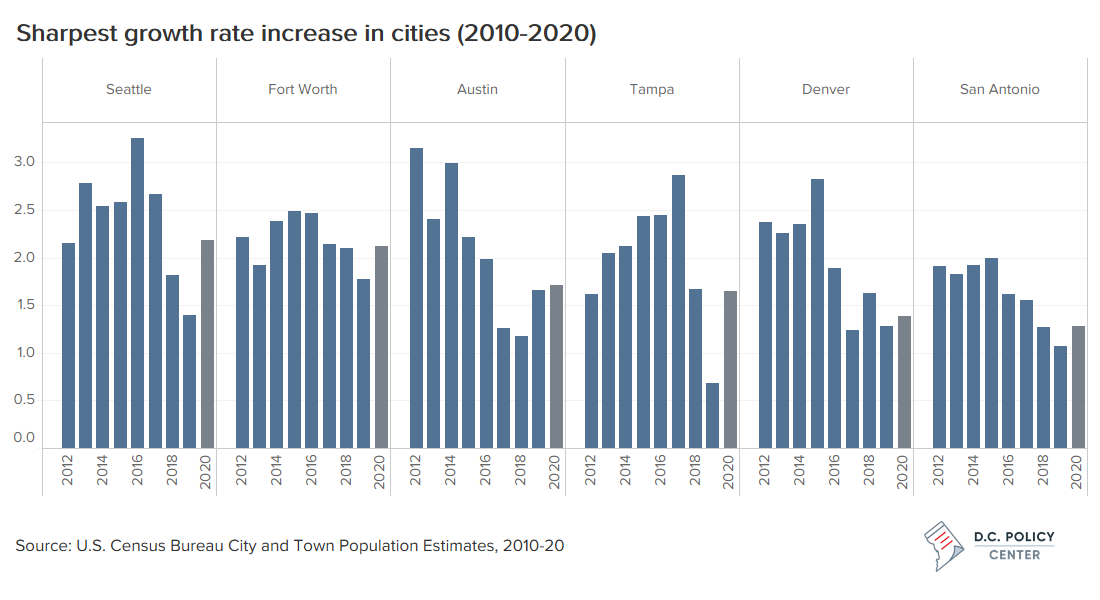
Between 2019 and 2020, of the 89 big cities across the U.S. with a population greater than 250,000, 63 percent saw a lower growth rate from the previous year, and around a third registered their lowest annual growth rate of the decade. The decline in growth rates were far more prominent among the 10 largest cities (population more than 1 million), half of which lost population since 2019. 33 of the big cities experienced higher growth rates than the preceding year, with noteworthy surges for Seattle, Fort Worth, Austin, Tampa, Denver, and San Antonio.
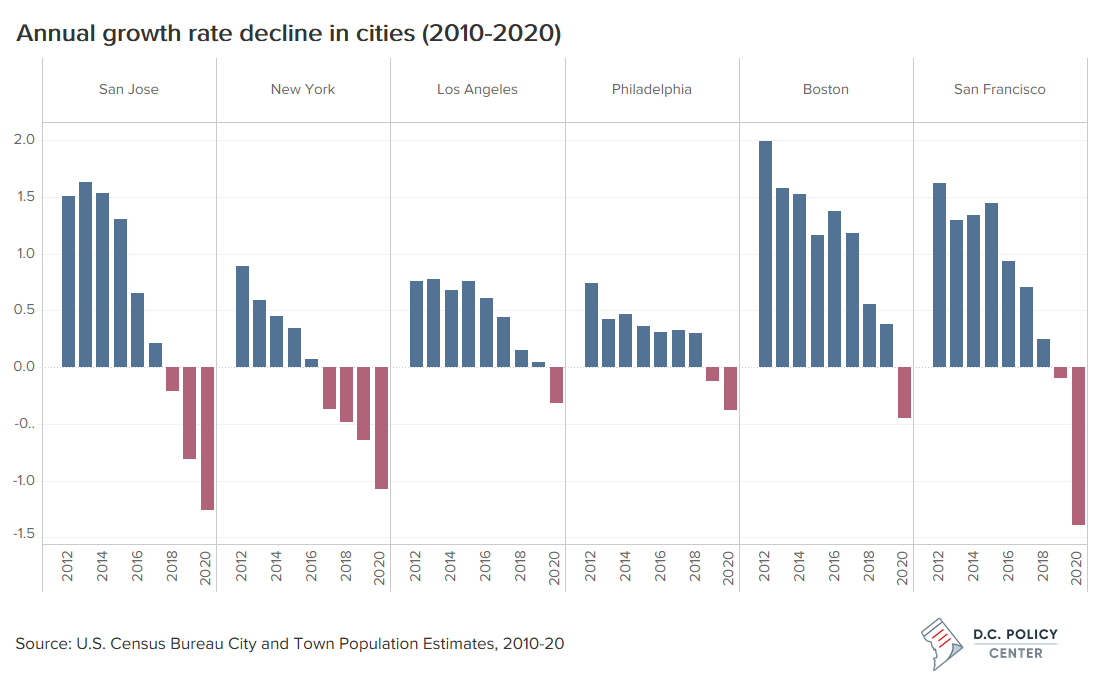
The patterns observed in other cities are consistent with broader trends seen across the country recently (even before the pandemic), with an increasing number of residents, especially young adults, moving out of urban areas and into suburbs, along with an increasing number of deaths, and a reducing number of births. However, the data show that in light of the heightened movement away from big cities and metro areas, the District has performed relatively well.
Looking at the rest of the states, the District’s population growth rate exceeded that of 36 other states, 16 of which lost population. Relative to population size, though D.C. had a negative domestic migration rate (per 1,000 population), it was less negative than that of 22 other states and it also had the third highest international migration rate amongst the states. Altogether, the net migration rate to the District was higher than that of 29 states. D.C.’s death rate was lower than that of 42 other states, and its birth rate was higher than that of 44 states – making the District’s rate of natural growth the fourth highest in the country.
These estimates cover the one-year period that ended in June of 2020. Studies that use address-change data have shown that moves have increased in the second half of 2020. According to one of these studies, between 2019 and 2020, net out-migration in the District increased by 23 percent, and net move-out rate per 1,000 residents rose from 5.3 to 7.2 for the larger metro area. It is possible that the out-migration impact of COVID will only become apparent in the next year’s estimates.