This week’s chart of the week is drawn from the D.C. Policy Center report titled “Breaking the Scarcity-Subsidy Cycle: A new housing vision for the District of Columbia.“
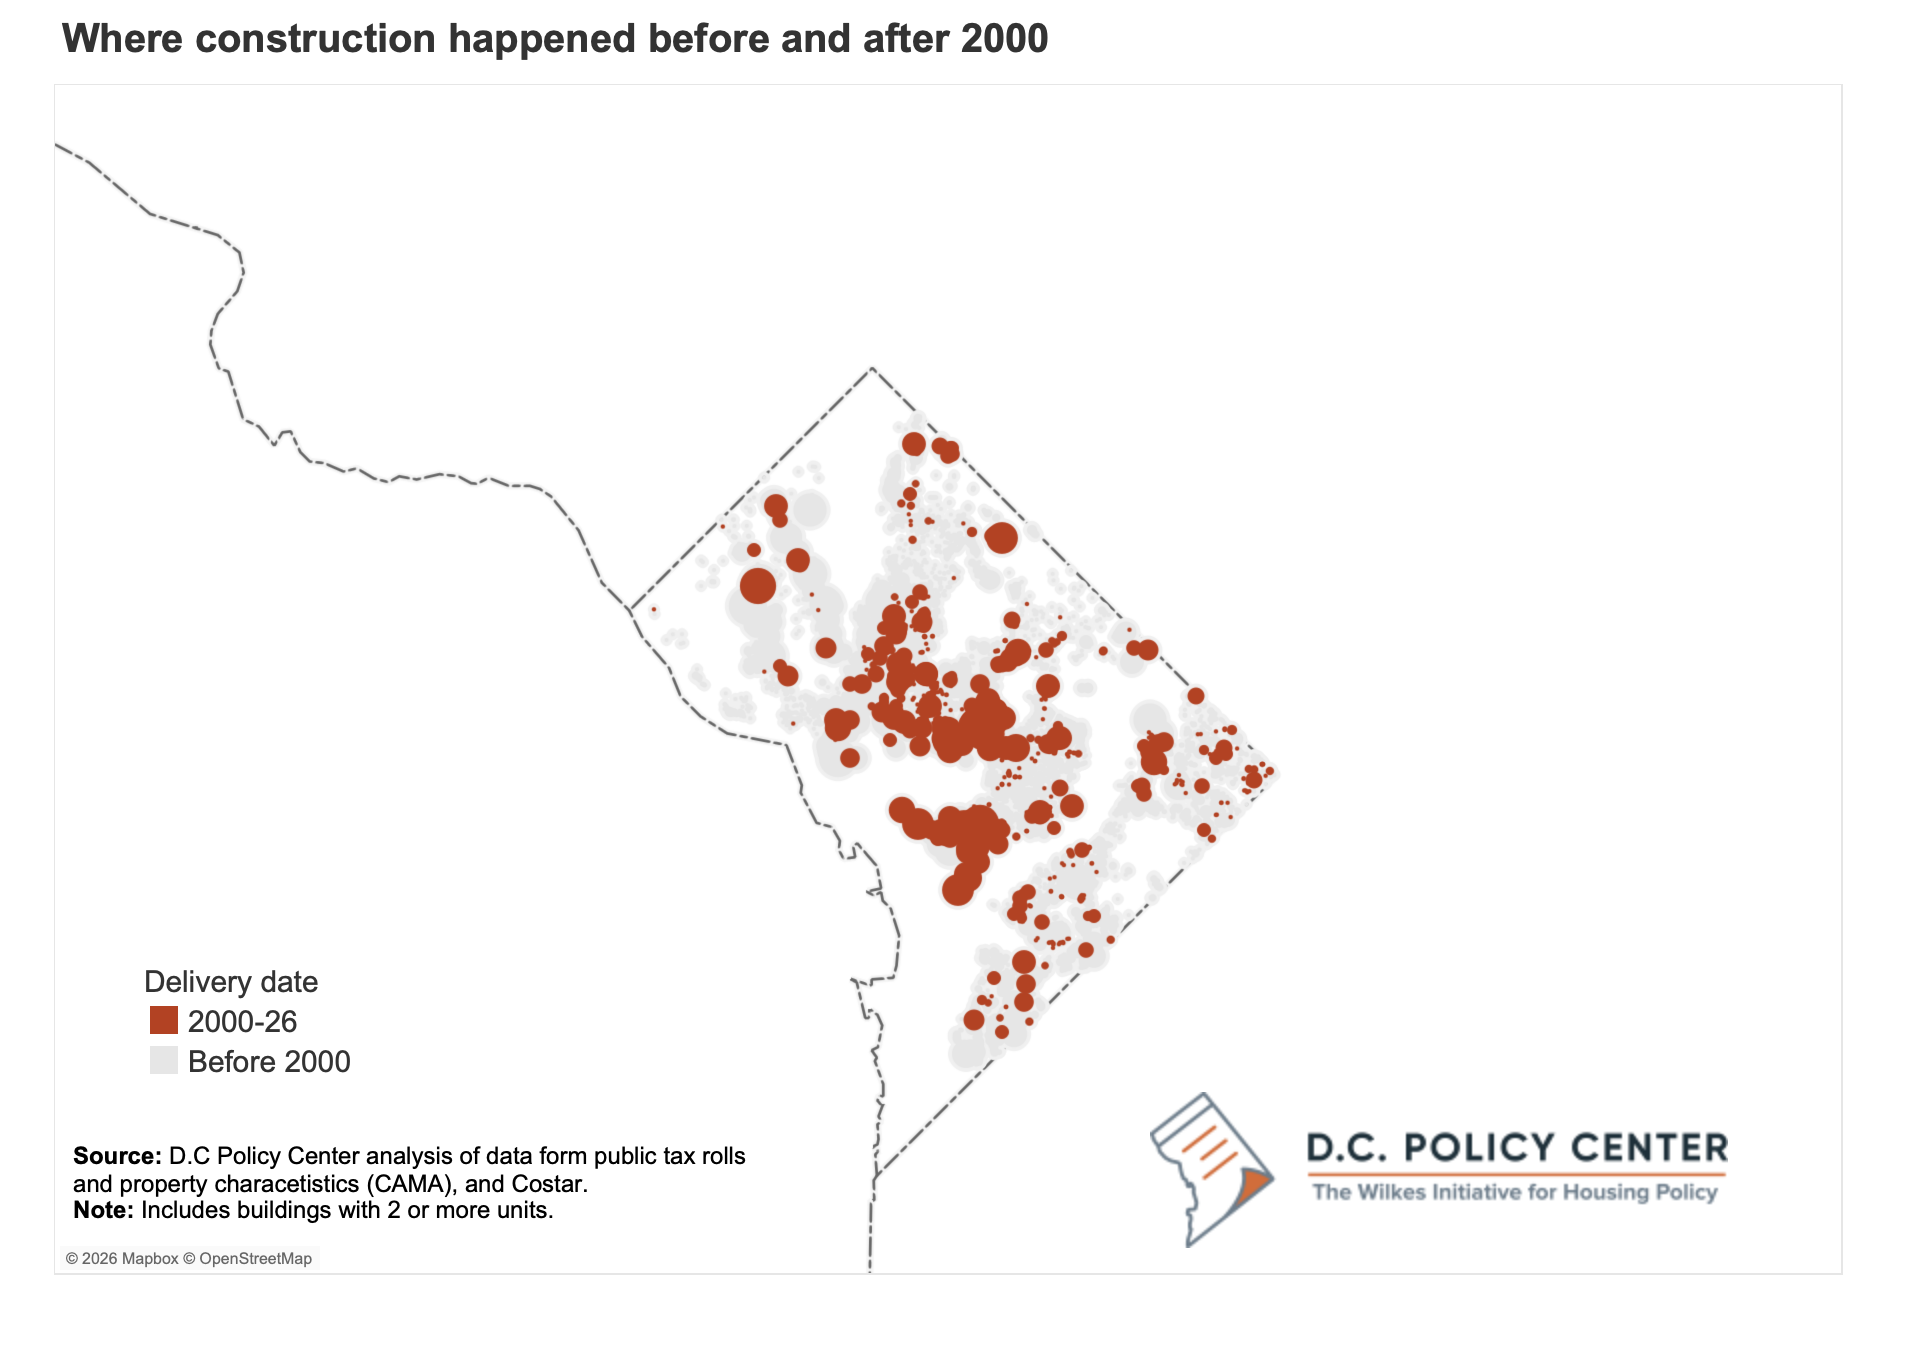
Between 2000 and 2020, the District added more than 84,000 housing units, most of which in multifamily buildings.1 On its face, that sounds like meaningful progress. But where that growth happened—and where it didn’t—tells a different story. The map above plots every residential building with two or more units constructed in D.C.
Buildings constructed before 2000 (in gray) are scattered across the entire city. Buildings delivered between 2000 and 2026 (in red) cluster almost entirely in a narrow band of neighborhoods: Navy Yard, NoMa/Union Market, the Wharf, and select pockets of Northeast and Southwest.2
These locations share two defining features: zoning that allows density and parcels large enough to support complex, capital-intensive development. In a housing market where growth is highly constrained, they absorb most of the city’s growth while the rest of the city remains largely unchanged. This pattern reflects a broader planning logic often described as the “Grand Bargain”: development is concentrated in downtown-adjacent areas, former industrial land, and sites with few existing residents, leaving established low-density neighborhoods largely untouched.3 Growth is allowed, but only where it is least contested.
The consequence is a city where most neighborhoods look almost exactly as they did a generation ago, while a small number of neighborhoods contain nearly all housing growth. That concentration has increases prices across the city, limits where people can afford to live, and places enormous strain on the subsidized housing system to compensate for a market that is structurally prevented from responding to demand.
Next week, the D.C. Policy Center will release “Breaking the Scarcity-Subsidy Cycle: A new vision for housing in the District of Columbia,” a new report from the Wilkes Initiative for Housing Policy. The report documents the structural constraints that have prevented housing growth, the subsidy programs the city deploys to lower costs, and makes the case that durable affordability can only follow from abundant supply across the entire city, not just in the corridors where density happens to be permitted. The report offers 25 detailed recommendations the city can implement to create more housing units, across all neighborhoods, at all price points.
Endnotes
- During this period, the District added 84,262 net new housing units. This is the equivalent of one new unit for 1.3 new residents. Of this growth, 56,000 were units in buildings with more than 50 units.
- Ten census tracts out of 433 accounted for nearly one-third of all units built across the city. Brooks, L., & Schuetz, J. (2023, September 18). Where 20 years of new housing was built in Washington, DC—and where it wasn’t. Retrieved from https://www.brookings.edu/articles/where-20-years-of-new-housing-was-built-in-washington-dc-and-where-it-wasnt/
- Price, G. (2019, October 17). The Grand Bargain, Illustrated. Viewpoint Vancouver. Retrieved from https://viewpointvancouver.ca/2019/10/17/the-grand-bargain-illustrated/. According to Kober, “Grand bargain” planning delivers growth where it is politically easiest, but concentrates it in expensive, large-scale projects while excluding lower cost “missing middle” housing and limiting neighborhood diversity. Over time, it becomes unsustainable: running out of easy sites, reinforcing uniform development patterns, and increasing pressure for policies that address symptoms (like rent burdens) without resolving underlying supply constraints. Kober, E. (2022). How Large Cities Can Grow Denser and Flourish: What the 2020 Census Reveals About Urban Sprawl. Retrieved from https://manhattan.institute/article/how-large-cities-can-grow-denser-and-flourish-what-the-2020-census-reveals-about-urban-sprawl