
Update 11/30/2017
To provide context for this analysis in light of recent reporting by WAMU questioning the validity of Ballou High School’s graduation rates in 2016-2017, the state Adjusted Cohort Graduation Rate (ACGR) would decrease to an estimated 70.6 percent if Ballou High School seniors who missed at least 60 days of school were excluded as graduates.
Is D.C. on pace to meet its graduation rate targets?
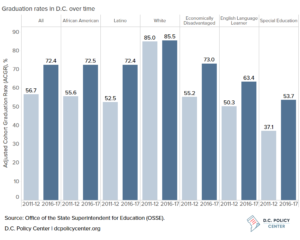
Graduation rates for D.C.’s public school students who complete high school within four years rose to 72.4 percent in school year 2016-17, which contributes to impressive gains of 15.7 percentage points over the last five years. However, D.C.’s graduation rate remains below the national rate of 83 percent.[1] Quality high schools with knowledgeable graduates have the potential to attract more families to stay in the city’s public schools as the young population boom ages into high school and improve long-term outcomes for all students, but current graduation rates might not be sufficient to achieve these objectives.
D.C. recently set new high school graduation rate targets as part of state accountability and strategic planning efforts. The 2016-17 graduation rates place D.C. ahead of schedule to meet graduation targets overall and by subgroup. But the harder work will come in future years as the city approaches its goals.
What can high school enrollment patterns and comparisons of D.C.’s trends to similar cities tell us about past progress and potential future performance?
- Total enrollment in high school, the number of high schools, and high school student demographics have remained fairly stable over the last five years, although the number of African American students has declined. Still, enrollment and demographic changes alone do not explain the recent rise in graduation rates.
- D.C.’s graduation rates are lower overall and for most subgroups when compared to peer cities with similar starting points for graduation rates.
- D.C. shows positive signs for improvement, as graduation rates for African American and Latino students are improving faster than in peer cities.
- The District should closely watch the cohort of students who are in ninth grade as their current academic achievements will shape graduation rates. For example, D.C. should consider a citywide effort to monitor the academic performance of ninth graders who are on track to graduate, and ensure that the quality of graduates does not diminish as graduation rates rise.
Looking back: Changes in high school enrollment
Over the last five years, D.C.’s graduation rate has risen by 15.7 percentage points and has increased for key subgroups, with economically disadvantaged and Latino students making especially large gains. During this same period, D.C.’s education landscape grew and shifted: the mayoral takeover of schools matured and leadership stabilized; as the District began to retain more families and more children, public school enrollment in all grades grew by about 13,000 students, and the percentage of public school students in public charter schools increased from 41 to 46 percent. How have D.C.’s changing high schools and high school student population potentially affected graduation rates?
Changes in total enrollment
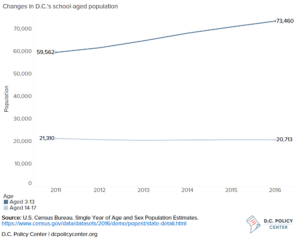
Over the last five years, enrollment in D.C.’s public high schools has actually declined slightly (by about a hundred students). This slight decline is the result of a decrease in the city’s high school-aged population. During the same five years, the number of youth aged 14 to 17 declined by 587. That is, D.C.’s population boom in younger ages hasn’t aged into high school yet. Private school enrollment, another potential reason for lower high school enrollment, doesn’t explain the decline in high school enrollment: 17.2 percent of students attended private school during the 2011 to 2015 period, the same percentage as during the 2006 to 2010 period.[2] With little change in the size of high school enrollment, increases in graduation rates are not explained by enrollment growth or contraction.
Changes in student demographics
Graduation rates are measured over an adjusted cohort, which does not include students who transfer in (or out). Thus, the adjusted cohort captures a set of students whose academic achievements are attributed to the last high school they attended. Over the past four years,[3] high school students included in this adjusted cohort shifted from African American toward Latino and white. Can this explain the increase in graduation rates?
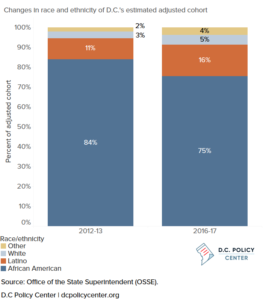
Although white students have the highest graduation rates in D.C., these demographic shifts did not single-handedly produce ACGR gains. White students in ninth grade cohorts only grew by approximately 60 students over the last four years. A recalculation of 2016-17 graduation rates that holds the 2011-12 distribution of race and ethnicity constant and uses last year’s graduation rates by subgroup yields around 73 percent, very close to the actual 2016-17 rate of 72.4 percent.
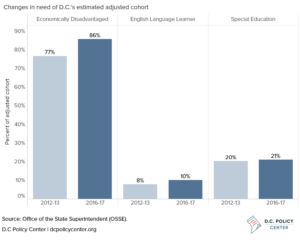
Another potential explanation for increasing graduation rates is the change in the composition of students by academic need. Graduation rates among English Language Learners, Special Education students, and students who are economically disadvantaged tend to be lower, so if the District’s adjusted cohort were to have a smaller share of these students, the graduation rates would go up just because of this change. But that does not appear to be the case in the District.
A closer look at student demographics by academic need shows that overall graduation rates have improved as students’ needs have remained constant or increased slightly. Shares of English Language Learner and Special Education students[4] in the adjusted cohort have increased by small amounts of 2 percentage points and 1 percentage point, respectively. The largest jump has been in the share of economically disadvantaged students, but this number likely overstates the growth in the number of students who are truly disadvantaged. Compared to four years ago, the percent of students in the adjusted cohort who are economically disadvantaged has increased by 9 percentage points (approximately 270 more students). This could be because economically disadvantaged students are identified if they meet certain criteria (TANF/SNAP eligible, homeless, under the care of the District’s foster care system, or receives Free or Reduced Price meals) or if they are enrolled in a Community Eligibility Provision (CEP) school that provides breakfast and lunch at no cost. All students at CEP schools are designated as economically disadvantaged regardless of means tested need. At least nine high schools joined the program[5] between 2014-15 and 2016-17, increasing the number of high school students considered economically disadvantaged.
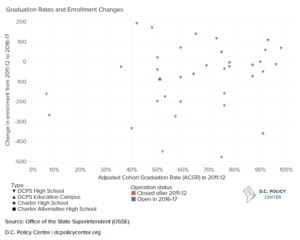
Changes in high schools
The number of high schools[6] has not changed, with 41 high schools in 2011-12 and in 2016-17. However, within this period, six high schools have opened and six have closed for reasons of under-enrollment, poor academic performance, or fiscal mismanagement. Interestingly, the schools that closed were not always the schools with the lowest graduation rates, and students have not systematically flocked to high schools with higher graduation rates. Isolating graduation rates and enrollment patterns, the composition of high schools has not driven the increase in graduation rates, especially since just one of the new schools has had a graduating class.
Looking behind the scenes, D.C.’s increase in graduation rates is not obviously explained by enrollment growth or contraction, demographic shifts, or changes in high school offerings. Graduation rates are rising because D.C.’s high schools are finding real ways to improve outcomes.
Looking at peers: How do graduation rates in D.C. compare to other similar cities?
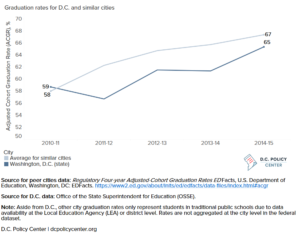
Although D.C. has made real progress in increasing its graduation outcomes, D.C.’s graduation rates don’t compare favorably to a subset of peer cities. To develop a meaningful comparison, we examined cities with similar demographic make-up as D.C. and selected among them cities with comparable graduation rates. Specifically, our comparison cities include those with a 2010-11 graduation rate within 10 percentage points of D.C.’s. These include public school districts in Atlanta, Baltimore, Boston, Buffalo, Denver, Detroit, Kansas City (Missouri), Milwaukee, Philadelphia, Pittsburgh, and St. Louis.[7] Compared to peer cities, D.C.’s graduation rate was 1 percentage point above the average in 2010-11 but grew at a lower rate to be 2 percentage points below the average as of 2014-15. [8]
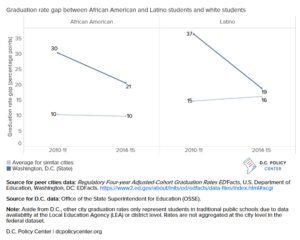
In addition to lower graduation rates, D.C. has larger gaps in outcomes for African American and Latino students when compared to white students. These gaps are shrinking fast in D.C.: from 2010-11 to 2014-15, the African American to white students gap narrowed by 9 percentage points while gaps in other cities with available data [9] did not shrink. The pattern for Latino students is similar, with D.C. reducing the gap by 18 percentage points and other cities with available data [10] widening the gap. Still, the graduation rate gaps for both African American and Latino students remain larger than most peer group cities.
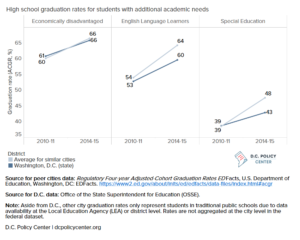
Results are mixed for students who are economically disadvantaged, and with additional academic needs. Outcomes for economically disadvantaged students are almost equivalent in D.C. and peer cities on average, but they are lower for English Language Learners and Special Education students. Graduation rates for economically disadvantaged students, English Language Learners, and Special Education students have improved in D.C., but at slower paces than other peer cities reporting data.[11]
To sum, D.C.’s graduation rate is lower than peer cities’ rates and large gaps remain between outcomes by subgroup, but D.C. made progress in closing the gaps for African American and Latino students. Hopefully, this progress can continue as the city moves toward meeting goals to raise graduation rates.
Looking ahead: What are DC’s graduation rate targets, and is the city on pace to meet them?
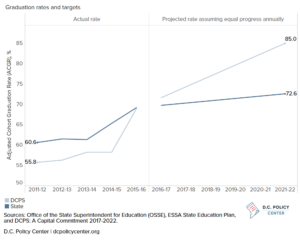
D.C. has recently set new targets to further increase its high school graduation rates. In its Every Student Succeeds Act (ESSA) State Education Plan, D.C. has set a long-term goal of graduating 90 percent of an adjusted cohort within four years, both for all students and each subgroup, by 2038-39. This means that D.C. aims to have a four-year graduation rate of 72.6 percent for both DC Public Schools (DCPS) and public charter school students over the next five years. With a 2016-17 graduation rate of 72.4 percent, the city has already almost achieved the targeted 2021-22 rate of 72.6 percent. D.C. is also keeping pace with its plan by subgroup, as actual graduation rates in 2016-17 were at or above interim targets for last year.
Separately, DCPS has set a more aggressive goal to graduate 85 percent of students within four years by 2017-2022 in its new strategic plan, A Capital Commitment 2017-2022 (public charter high schools set goals and academic achievement expectations in their charter agreements, including for graduation rates). DCPS’ graduation rate of 73.2 percent in 2016-17 is above the 71.6 percent rate that would be necessary to meet this goal assuming equal progress each year.
The harder work in increasing graduation rates will come in later years as all subgroups move toward 90 percent graduation rates for the city in 2038-39 and as DCPS grows toward a graduation rate of 85 percent in 2021-22.
Building on momentum
D.C. graduation rates have increased over the last five years while enrollment has remained flat and demographics have remained largely the same, so the gains are more likely attributed to schools’ efforts instead of population shifts. Although D.C.’s graduation rates have also improved for most subgroups, much work is needed to improve graduation outcomes especially for English Language Learner and Special Education students when compared to similar cities. In addition to school-level efforts, some citywide initiatives are trying to crack the code. For example, Raise DC’s Graduation Pathways Project has created a way for middle schools to easily share crucial information about alumni so that attending high schools can better serve incoming ninth graders. D.C. could also reconsider ninth grade on track as a citywide metric of early high school success.
Hopefully, graduation rates will continue to increase over the next five years along with the quality of high school, and D.C. families will select DCPS and public charter high schools in greater numbers. However, graduation rates are not the only measure of high school success, and the city should be careful to align incentives so that all high school graduates leave with the skills they need to be successful in college or their career. The State Board of Education’s ongoing High School Graduation Requirements Task Force has the potential to recommend changes to the city’s graduation requirements and ensure that a high school diploma is a meaningful achievement.
About the data
This analysis focuses on four-year graduation rates throughout.
High school graduation data for D.C. are from the Office of the State Superintendent for Education (OSSE) summary of graduation rates for school year 2016-17 and OSSE’s LearnDC DC Report Card for previous years. Adjusted cohort sizes by subgroup were estimated using graduation rates and the number of graduates.
High school graduation rates for peer cities are from the U.S. Department of Education’s EDFacts Regulatory Four-year Adjusted-Cohort Graduation Rate files.
Graduation rate targets are from the Every Student Succeeds Act (ESSA) DC State Education Plan for the state and the DC Public Schools (DCPS) five-year strategic plan, A Capital Commitment: 2017-2022, for DCPS.
High school enrollment is from OSSE’s enrollment audit data. All schools with reported graduation rates were identified as high schools for this analysis.
School-aged population is from the U.S. Census Bureau’s Single Year of Age and Sex Population Estimates (SC-EST2016-AGESEX-CIV).
Notes
[1] ACGR measures the percentage of high school students who graduate on time, measured by the percentage of the ninth grade cohort who receive a high school diploma, adjusted for any students who transfer in or out of the school system. The most recent year of national public high school graduation rates with available data is 2014-15 (see National Center for Education Statistics for more information).
[2] American Community Survey’s 5-Year Estimates of school enrollment.
[3] Reliable cohort data from OSSE is only available from 2012-13 onwards.
[4] However, as the adjusted cohort has decreased in size, the number of Special Education students actually decreased slightly.
[5] For information on D.C.’s schools adopting CEP, please see the Food Research & Action Center (FRAC) and the Center on Budget and Policy Priorities.
[6] For the purposes of this analysis, high schools in D.C. serve traditional students, who are usually between the ages of 14 and 17 at the start of the school year, or students who have left traditional schools and seek a high school diploma or the equivalent through an alternative pathway. In addition, a school is considered a high school if OSSE reported graduation rates for the school at any point between 2011-12 and 2016-17. Goodwill Excel Center PCS has been excluded as it serves primarily adults.
[7] The D.C. Policy Center has identified cities with similar populations, population densities, and economic factors to provide a better peer group for D.C.
[8] The earliest year of ACGR data from OSSE is 2010-11, and the most recent ACGR data from other cities is 2014-15.
[9] Of the 11 peer group cities, Baltimore, Buffalo, Denver, Milwaukee, Philadelphia, and Pittsburgh had large enough African American student populations to report on graduation rates for African American students.
[10] Of the 11 peer group cities, Buffalo, Denver, Milwaukee, and Philadelphia had large enough Latino student populations to report on graduation rates for Latino students.
[11] All 11 peer cities reported graduation rates for economically disadvantaged students. Boston, Denver, Detroit, and Philadelphia reported graduation rates for English Language Learners. Atlanta, Baltimore, Boston, Buffalo, Denver, Milwaukee, Philadelphia, and St. Louis reported graduation rates for Special Education students.
Feature photo by Harrison Keely.
Chelsea Coffin is the Director of the Education Policy Initiative at the D.C. Policy Center.