The term “food desert” which refers to geographic areas where people have limited access to healthy food, a problem that affects millions of Americans every year. These areas tend to have concentrations of low-income and minority residents, invoking socioeconomic and racial divides. This is especially true in Washington, D.C., a city with an extended history of racial and economic divisions and disparities, which in turn contribute to the development of food deserts.
Researchers have made attempts at quantifying and identifying different types of food insecurity within the District, but most only consider proximity to grocery stores, an approach that excludes supermarkets (larger stores, like Walmart or Target, that sell non-grocery products). This previous approaches also rarely incorporate demand-side characteristics, such as household income and access to a vehicle, that affect how people access the resources that do exist in their communities. Finally, existing analyses that have focused specifically on D.C. are now a few years old. With demographics constantly shifting and new grocery stores opening, I want to identify the current food deserts throughout the city.
My findings indicate that D.C. still has a notable amount of concentrated food deserts, which are deeply connected to both poverty and transportation. Using relevant demographic factors and a network analysis of walking distance to supermarkets or grocery stores, I found D.C. has 6.5 square miles of food deserts overall—about 11 percent of D.C.’s total area. Areas including Historic Anacostia, Barry Farms, Mayfair, and Ivy City contain the majority of food deserts found in the city.
What is a “food desert”?
While definitions of what makes a food desert vary, the most thorough definition I could find was generated by the City of Baltimore and Johns Hopkins University as part of a joint program that examined food insecurity in Baltimore. This program defined food deserts as the intersection of three factors: proximity to supermarket or grocery store, household income, and transportation access.
I have adapted their definition and made some slight modifications to form a reasonable definition that I feel best describes a present-day D.C. food desert. For the purposes of this analysis, a food desert is defined as an area where:
- The walking distance to a supermarket or grocery store is more than 0.5 miles,
- Over 40 percent of households have no vehicle available, and
- The median household income is less than 185 percent of the federal poverty level for a family of four.
Why are all these factors important when defining a food desert? To being with, any distance beyond 0.5 miles makes carrying up to a week’s worth of groceries back home on foot extremely difficult. This isn’t as much of a concern if a household has access to a car, but becomes a real barrier if a household doesn’t have that option. Finally, median household income directly affects access. For example, a household that has a high median income but low car ownership will likely have the means to afford alternate transportation, such as a taxi or Uber. Lower median income families may not have the ability to afford these same alternates.
Locating food deserts within D.C.
In order to identify which areas of D.C. matched this definition of a food desert, I analyzed the demographic data through a series of overlay analyses that included identifying census tracts that matched our definitions of a food desert in regards to vehicle availability and median household income. Additionally, I conducted a network analysis to calculate areas within walking distance to supermarket or grocery store.
Step 1: Identifying high-poverty neighborhoods
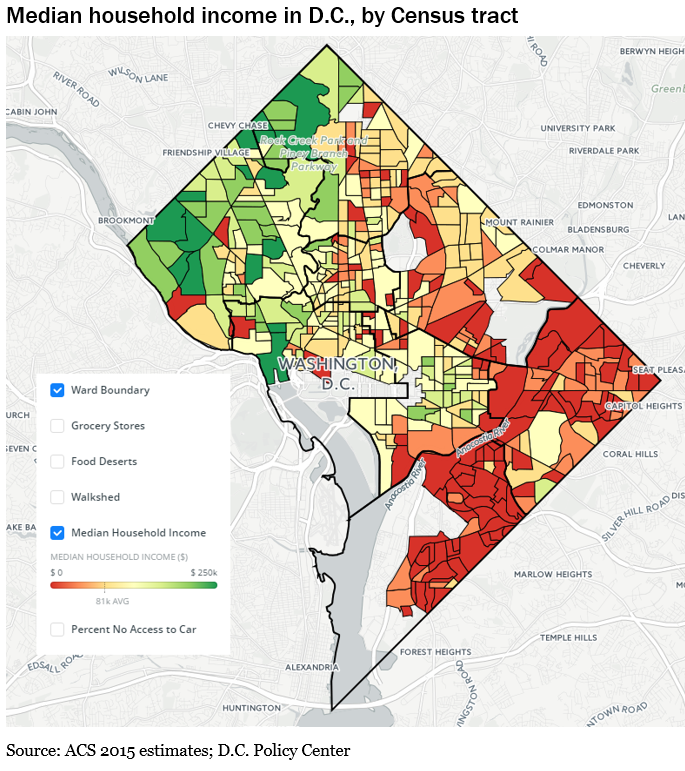
One of the necessary conditions for a food desert in our definition is that the median household income for the area is less than 185 percent of the federal poverty level for a family of four – about $44,995 in 2015. Therefore, any area falling below that threshold meets the first criteria of a food desert. Using data from the Census Bureau’s American Community Survey, we see that most of the neighborhoods in the city with the highest poverty rates are located east of the Anacostia River; the median household income in Ward 7 is just over the federal poverty line at $45,469, and median household income for Ward 8 falls below it at $32,967.
Breaking our data down to a neighborhood view (specifically, looking at Census block groups), an overwhelming number of areas under the $44,995 federal poverty threshold are located in the eastern portion of the city. These neighborhoods include parts of Historic Anacostia, Barry Farms, and Mayfair. This highlights one of the many socioeconomic divides the city faces. (Note: You can view all of these data layers in the main interactive map.)
Step 2: Identifying areas with low rates of car ownership
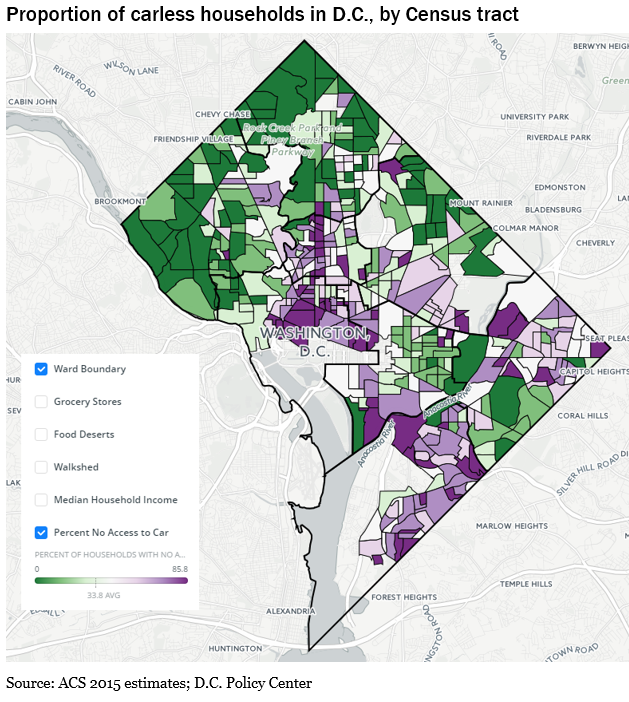
Another important factor used to define a food desert is the percentage of households with no car access, again using data from Census Bureau’s American Community Survey. As a major city with a robust public transport system, it is no surprise that D.C. has a large proportion of “carless households”—and indeed, more than 40 percent of households in Wards 1, 2, and 8 do not own a car. However, the lack of a car can also make it more difficult for lower-income families to travel long distances for their groceries.
At a neighborhood level, we see concentrations of carless households in the center of the city around Foggy Bottom, Dupont Circle, and up through Columbia Heights, as well as farther east around Ivy City and in the southeastern portion of the city around Historic Anacostia. For some neighborhoods, such as Carver, as many as 85 percent of households do not have a car.
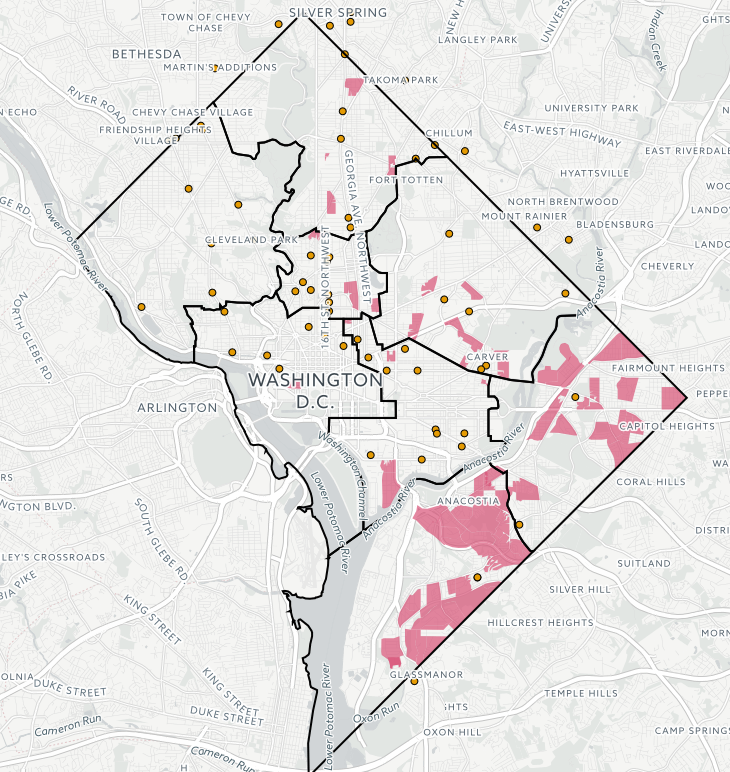
Step 3: Mapping where there is a grocery store within walking distance
Next, we need to calculate the areas in which a grocery store or supermarket is located within walking distance. In our analysis, we are defining the “walkable” range as the 0.5 mile radius surrounding a grocery store. Using a combination of store lists from D.C. Open Data and Yelp, I identified all of the grocery stores that are located either in D.C. or within a half mile of the D.C. border. In the interactive map, “Walkshed” areas highlighted in blue are within half a mile of a grocery store, and therefore considered walkable for residents who do not own or have access to a car. Anything not highlighted is considered an un-walkable area.
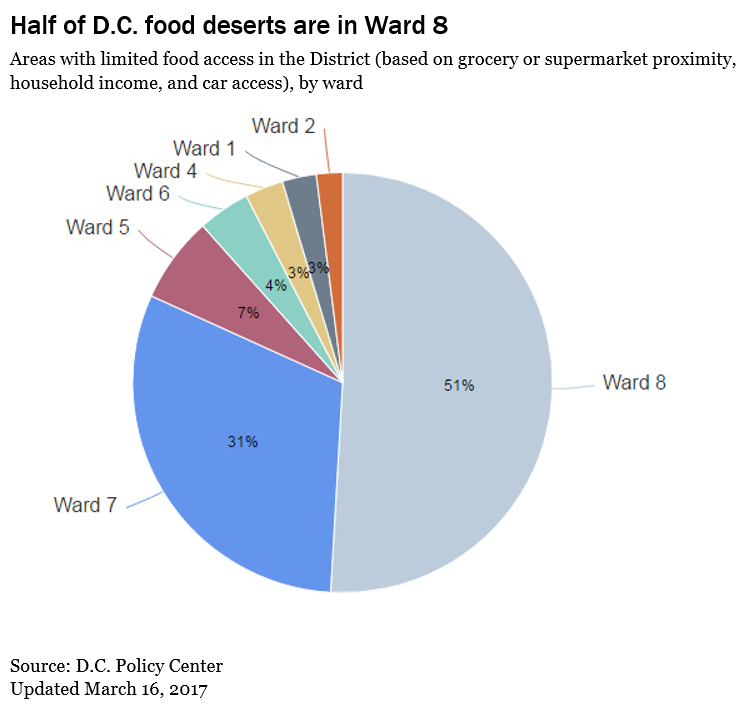
More than three-quarters of the food deserts in D.C. are located in Wards 7 and 8
Combining these steps, we have identified the areas that have all three defining elements of a food desert: Areas that (1) are located more than half a mile from a grocery store or supermarket, (2) have low rates of car access, and (3) have a high poverty rate.
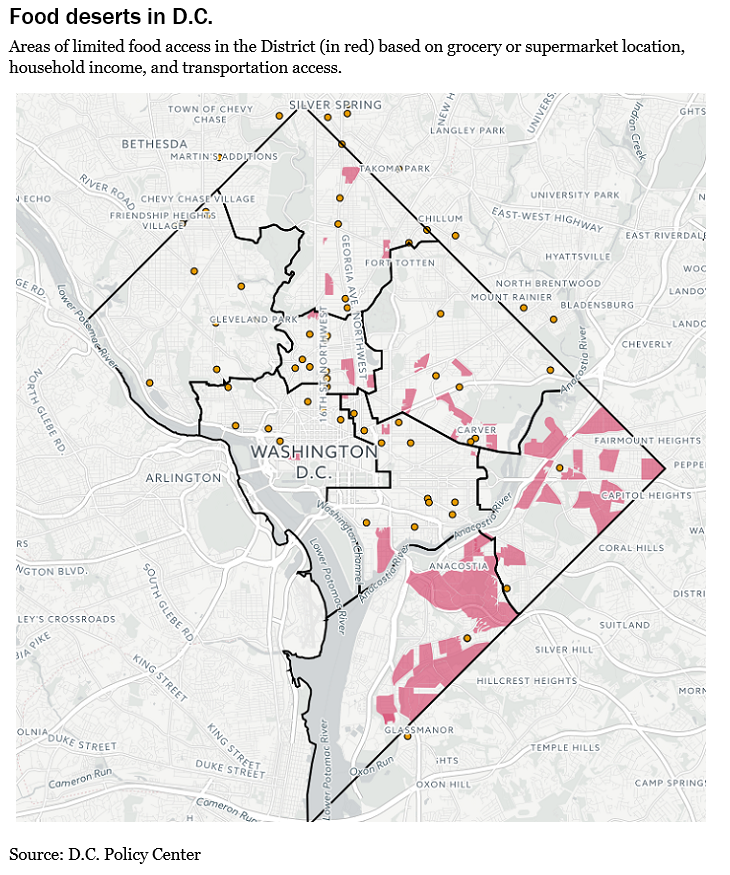
Below, you can explore an interactive map of D.C.’s food deserts, as well as the factors that contribute to food access and availability issues. Check the boxes in the legend to visualize different layers.
Food Deserts in D.C.
Food deserts make up about 11 percent percent of D.C.’s total area (6.5 square miles), and are concentrated in the neighborhoods of Anacostia, Barry Farms, Mayfair, and Ivy City. By area, the majority (51 percent) of all food deserts are located in Ward 8, while Ward 7 contains the second largest portion of food deserts (31 percent). On the opposite side of the spectrum, Ward 3 has no areas considered a food desert. Ward 2 does contain a food desert, but it is quite small—only 0.13 square miles.
About the data
Data for median household income and household car availability was obtained from the US Census Bureau’s American Community Survey, 2015. Data pertaining to grocery store locations was obtained through a combination of D.C. Open Data, 2016 and Yelp 2016. Areas within walking distance of grocery stores and supermarkets were calculated using road network data provided by D.C. Open Data, 2016. Visit my github page for code used in each visual.
Note: This post has been updated to remove a grocery store that was closed, and to better align food desert boundaries to exclude some waterways, park areas, and other inapplicable areas. This change has been reflected in the data visualizations and in the text.