The D.C. Policy Center report “Will Children of Current Millennials Become Future Public School Students?: How D.C.’s Young Families May Shape Future Public School Enrollment” examines births and public school enrollment by cohort, and estimates that public school enrollment in the District of Columbia may grow by as many as 21,100 students by 2026-27. Half of this growth is likely to occur in middle and high school grades.
Below is a summary of the report and its key findings. For more information, read the full report or download the report as a PDF.
With its population rapidly increasing, the District of Columbia must plan for how it will invest in public education to address future demand for schools. Children are already attending D.C.’s traditional public and public charter schools at higher rates. If current trends continue, D.C.’s public schools[1] will see a large increase in enrollment in ten years. This report examines which grades are likely to grow by the most and where students could potentially live, focusing on those in pre-kindergarten through grade 12. The analysis shows that if students stay in public schools at the rates they currently do, enrollment growth will largely come from upper grades. Additionally, given housing prices and population forecasts in the city, most of this growth will be from students who live outside of the Wilson High School boundary, including some neighborhoods that have seen a decline in the school-age population. This is an important consideration when thinking about where to create more capacity for students.
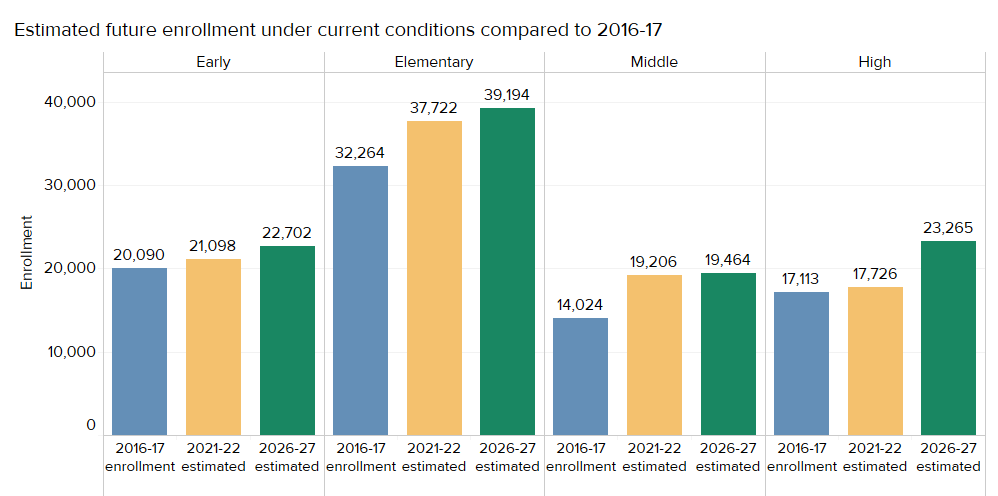
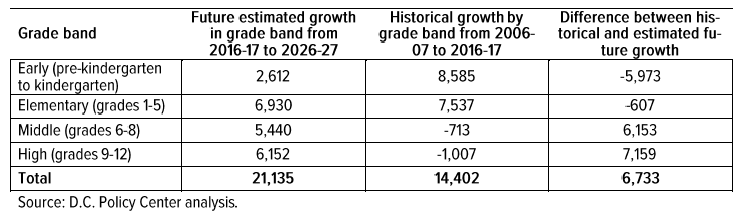
Given current trends, D.C. public schools will add an estimated 21,100 seats by school year 2026-27. Of these, 11,600 will be in middle and high school grades. Almost all of the growth in middle school would occur by school year 2021-22, and the high school growth would occur between 2021-22 and 2026-27 (see Figure 1). These future growth estimates are the result of slightly higher proportions of students who transitioned between earlier grade bands in recent years aging into middle and high school grades, and starting to stay in greater proportions in middle and high school as well. Higher enrollments in upper grades would represent a change in enrollment patterns, as enrollment in these grades declined over the previous ten years.
Figure 1. In ten years, enrollment is estimated to increase
However, the District will not achieve this estimated enrollment growth unless children born in D.C. enroll in public schools at much higher percentages. The percent of children born in D.C. who stay from birth to middle school would increase by 12 percentage points (up from the 2017-18 rate of 56 percent), and the percent staying through high school would increase by 7 percentage points (up from the 2017-18 rate of 47 percent). These numbers require growth in upper grades, which have not yet experienced the growth expected from increases in enrollment at the elementary level. Improving the attractiveness of schools for future middle and high school students is essential to continued growth in public school enrollment – and most of this will happen outside of the Wilson HS boundary. This is significant because the Wilson HS boundary is the only area of the city where students overwhelmingly attend their in-boundary school (Coffin, 2018).
Public school enrollment will continue to grow if the District continues to be the home of Millennials
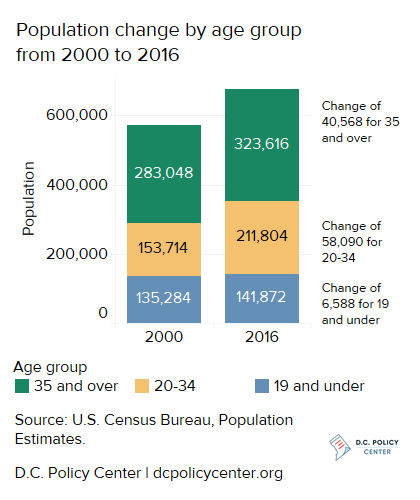
D.C. added more than 105,000 residents from 2000 to 2016, and about half of this growth has come from residents who were between the ages of 20 and 34 in 2016 (today’s Millennials[2]), which is an increase of 38 percent for this age range (see Figure 2). The influx of Millennials is important for education policymakers because, at 51 live births per 1000 women, this age group has higher fertility rates than others in D.C. (United States Census Bureau, 2016). In part due to more births, enrollment in kindergarten through grade 12 at D.C.’s public and public charter schools already increased by over 8,000 from 2006-07 to 2016-17. Millennials’ decisions to continue to stay in the city and enroll any children in the District’s public schools could significantly alter the city’s fiscal picture, both in terms of tax revenue it can collect and in terms of resources necessary to provide public services, especially in the District’s public schools.
Figure 2. Population aged 20 to 34 grew by 58,000 since 2000
Two separate dynamics can put positive pressure on public school enrollment in D.C. First, natural changes that come with having a larger population and more children born to mothers[3] living in the District could lead to a larger base number of young children likely to enter the school system. Second, a stronger preference for public schools because of expanded pre-kindergarten and improved school quality[4] could mean that more of these children stay in public schools. Both factors signal that D.C.’s public school enrollment could increase in the coming years.
Births are higher
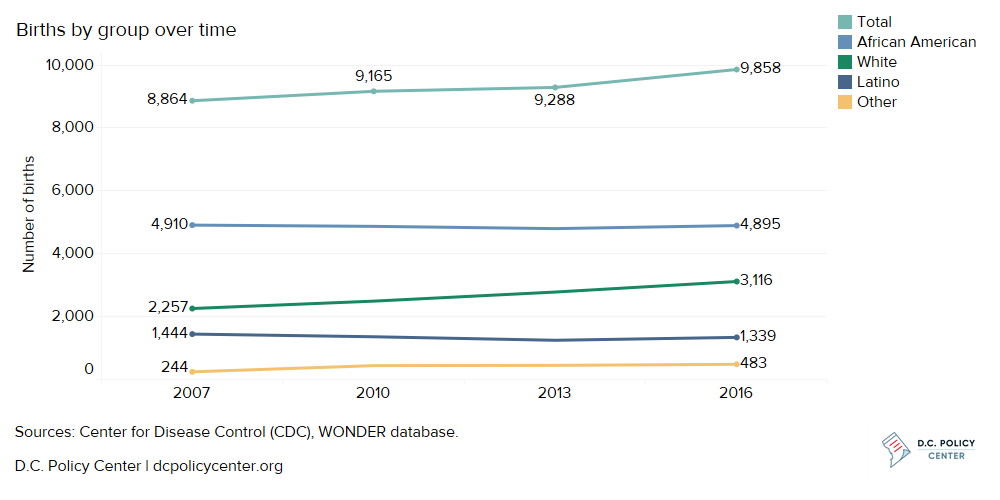
There were a thousand more births in 2016 compared to 2007, with the largest increase occurring between 2013 and 2016 (see Figure 3). Births to white mothers account for most of the annual increase at 859 more births per year in 2016 than in 2007, which is already shifting the demographics of the District’s youngest children. And women are having children at older ages, with births to women aged 35 and over up by 42 percent compared to an increase of 14 percent for women aged 20 to 34 (Centers for Disease Control and Prevention, 2016). This may indicate that the District has yet to see the bump in public school enrollment that may occur from the large increase in Millennials.
Figure 3. Births are on the rise
Preferences for D.C.’s public schools are stronger
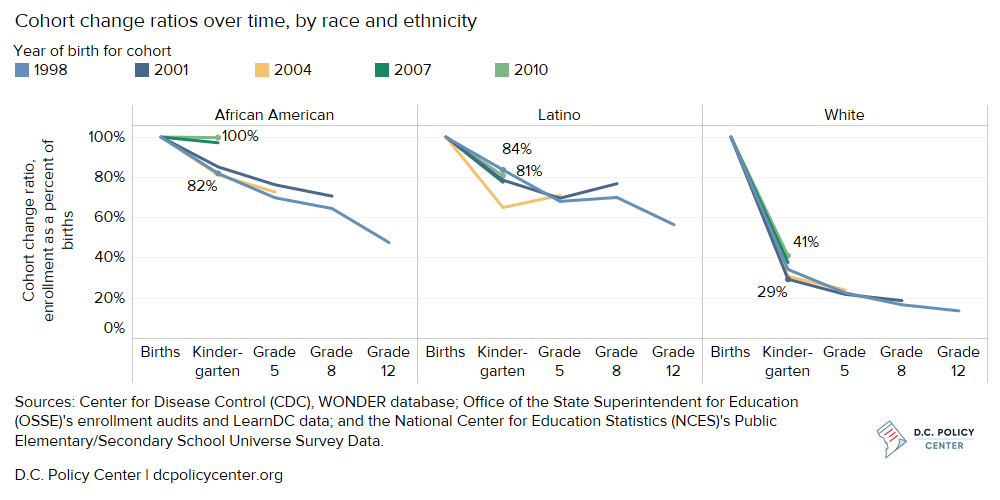
Enrollment preferences are shifting toward D.C.’s public schools, especially in early grades, as on net, a lower proportion of families are moving out of the District or choosing private schools. For example, cohort change ratios, or enrollment as a percentage of children born in D.C. in an earlier year, show that 73 percent of the number of children born in 1998 enrolled in a public District kindergarten five years later in 2003 (see Figure 4). For those born in 2010, this figure rose to 80 percent. Similarly, 61 percent of children born in 1998 enrolled in grade 5 ten years later in 2008, and this rose to 69 percent for children born in 2007. In D.C., African American families’ preferences have shifted the most toward D.C.’s public schools, while only slightly increasing for white families (see Figure 5). Figures for the 1998 cohort may seem low, but D.C. kept more students than other cities with a high degree of public school choice and growing populations like Oakland, New Orleans, and Boston.
Figure 4. After 2007, more families are staying in D.C. over time
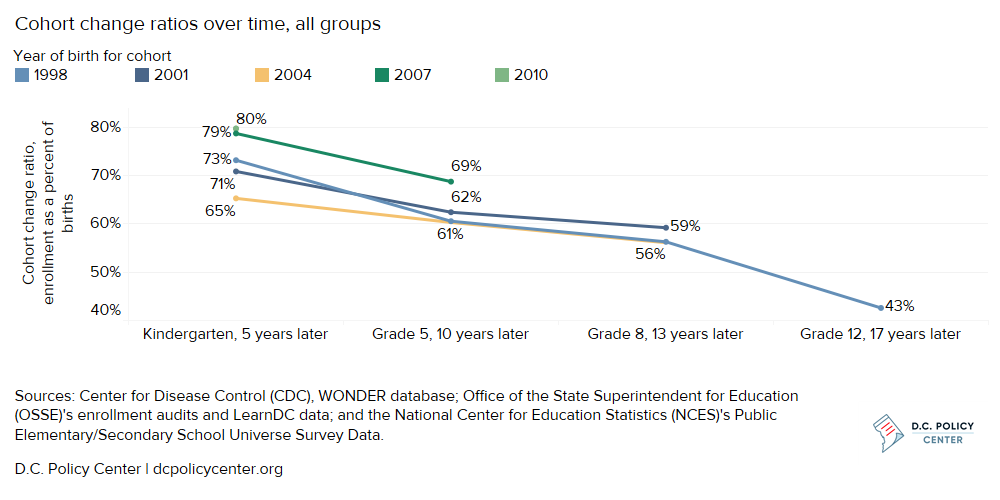
Figure 5. Preferences for public school have increased the most for African American families
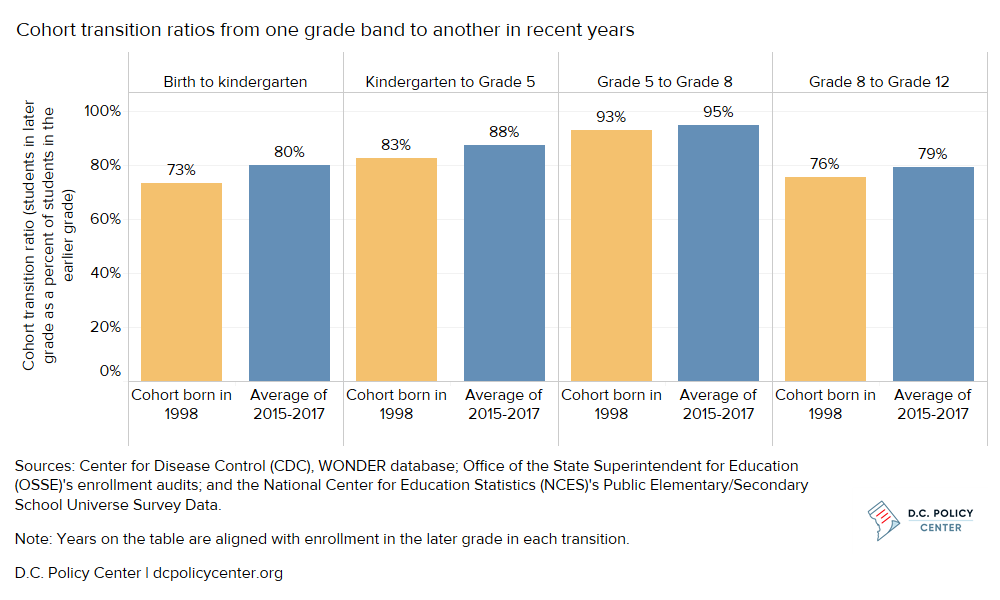
In addition to beginning their education in the public school system, an increasing proportion of students are staying in the city’s public schools between grade levels. Cohort transition ratios, or the net proportion of students who finished the previous grade band and are still enrolled in public schools at the end of the next grade band, show increases in each grade, even small increases in students remaining in middle and high school grades (see Figure 6).
Figure 6. More students are staying in public schools between grade bands in recent years
Over the next ten years, public school enrollment may turn around in middle and high school
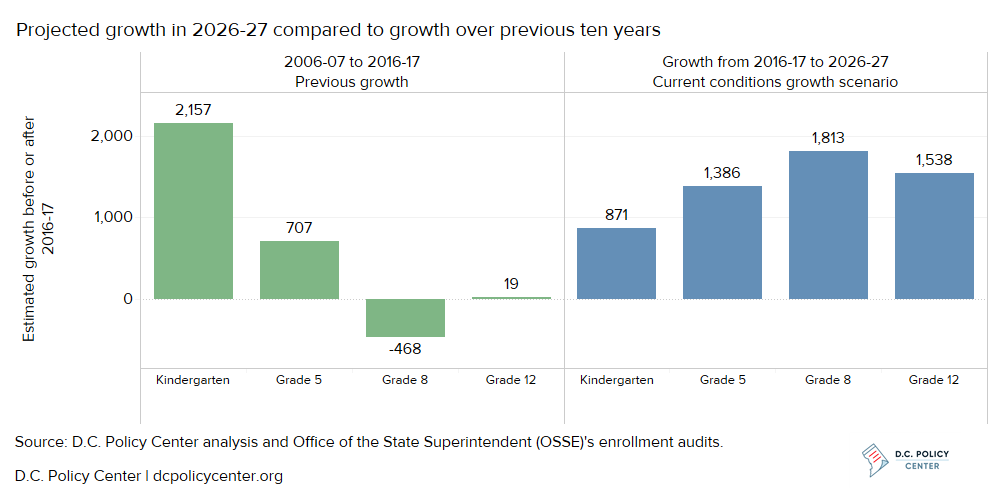
If students continue to transition between grade bands as they have in recent years, public school enrollment is slated to increase by the most in upper grades over the next ten years. Estimates of enrollment in 2026-27 that use the number of births in 2016 and assume current conditions, or cohort transition rates in recent years, show that public schools would see the highest enrollment increases in grade 8 (about 1,800 students) and grade 12 (about 1,500 students) over enrollment in 2016-17 (see Figure 7). This would be a dramatic shift: over the previous ten years, D.C. public schools saw a decline in the number of students in grade 8 of almost 500, and almost no change in the number of students in grade 12. These future growth estimates are the result of slightly higher proportions of students transitioning between earlier grade bands in recent years aging into middle and high school grades, and starting to stay in greater proportions in middle and high school as well.
Figure 7. Public school enrollment over the next ten years shows growth may begin in middle and high school grades
Under current conditions, total public school enrollment could increase by about 21,100 students in 2026-27 (see Table 1). These estimates extrapolate findings for one grade to all grades in a relevant grade band.[5]This would be a much larger increase than growth of 14,402 students that the city experienced over the previous ten years. Although enrollment would continue to increase in all grades, the need for seats in middle and high schools would be especially great compared to the previous period, when enrollment in both of these grade bands decreased. Meeting these estimates relies on quality options to draw students and families back into public schools in upper grades.
Table 1. Public school enrollment growth through 2026-27 shifts toward middle and high school
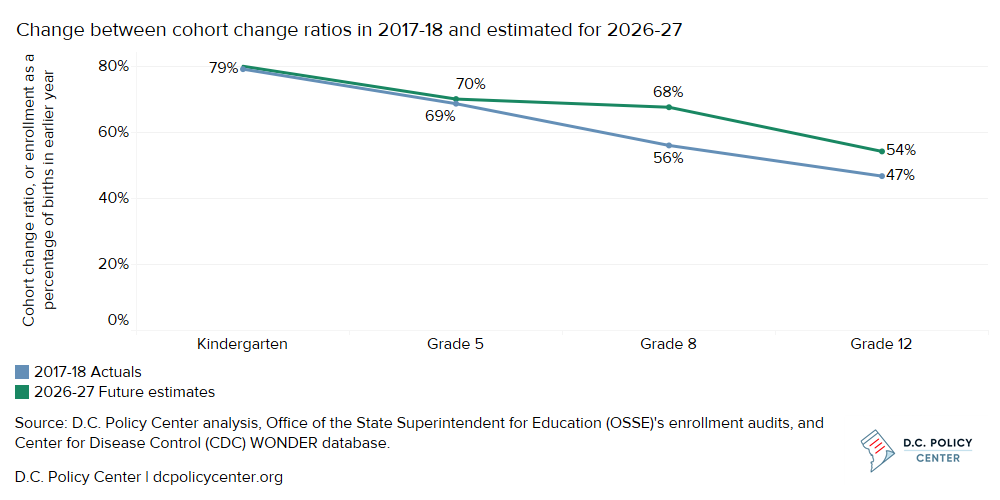
For these ten-year estimates to hold, students must stay through middle and high schools at higher proportions than they did in 2017-18. For example, in grade 8, 68 percent of children born 13 years earlier need to stay in D.C. and its public schools on net by 2026-27 compared to the rate of 56 percent of children enrolled in 2017-18 (see Figure 8). And in grade 12, 54 percent of children born 17 years earlier need to stay by 2026-27 compared to the rate 47 percent of children enrolled in grade 12 in 2017-18.
Figure 8. Students will need to stay in middle and high schools at higher proportions to meet these estimates
Most future public school students are likely to live and potentially attend schools outside the Wilson High school boundary
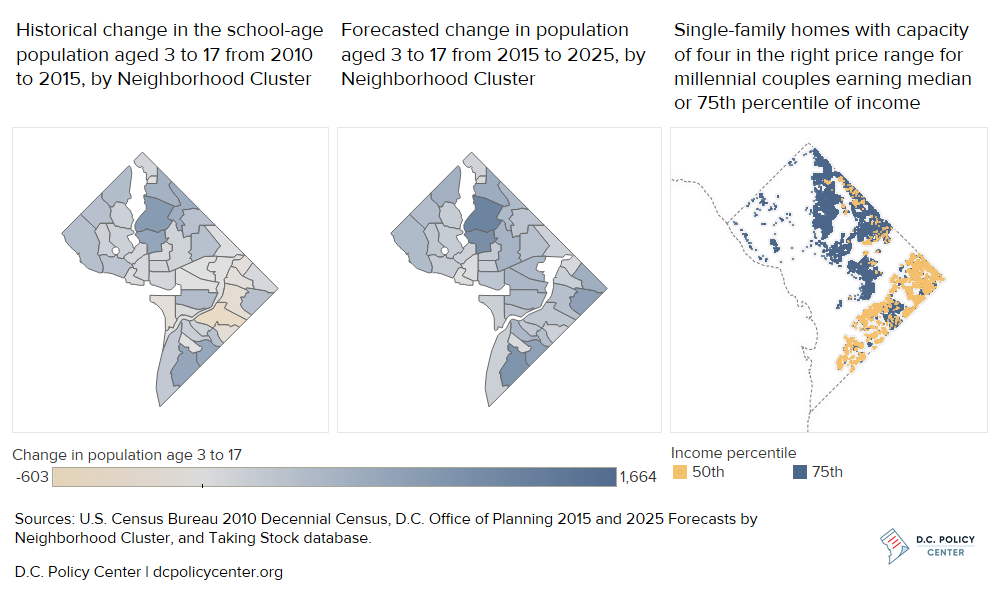
Population forecasts and housing prices indicate that most of the growth in the school-age population is likely to occur outside of the boundaries for Wilson High School and its feeder schools.[6] The D.C. Office of Planning’s population forecasts, which take into account new developments, indicate that the greatest growth by Neighborhood Cluster will occur in neighborhoods north of the center of the city[7] and the south[8] (see Figure 9). Looking at the existing housing stock, some single-family homes with a capacity of four in the affordable price range for Millennial couples without children earning at least median income are located in these neighborhoods as well (none are available to those with income in the 25th percentile). Many houses in this price range are located along the northeast and southeast borders, and 24 percent are owned by senior citizens; as they turn over, it’s possible that school-age population will increase. In fact, many school systems say housing turnover in neighborhoods with empty-nesters is having the biggest impact on enrollment (Shaver, 2018). These areas include some neighborhoods that have seen their school-age population decline in recent years.[9]
Figure 9. Most growth in school-age population may occur outside western D.C.
Looking at prices of single-family homes gives an indication of where enrollment growth might occur, but it has two limitations. First, 39 percent of homes in D.C. are owner-occupied (United States Census Bureau, 2016). Apartments provide additional options in other neighborhoods, where rents are likely to be cheaper than the costs of owning a home, but it is difficult to know which apartments can accommodate families because reliable capacity data by unit are not available. Second, the presence of a school-age population alone does not determine where spots at schools will be needed as just 27 percent of D.C.’s public school students attend their in-boundary school (Office of the Deputy Mayor for Education, 2017). However, it does give some indication of future demand because students attend schools that are on average a 10- to 16-minute drive from home, depending on their grade (Blagg, et al., 2018).
Takeaways
- If current preferences for public schools in D.C. continue, enrollment could grow by about 21,100 students through 2026-27 – and most of it is likely to occur outside of the boundaries of Wilson High School and its feeder schools. This is the only area of the city where the overwhelming majority of students attend their in-boundary school. Looking at population forecasts from D.C.’s Office of Planning, the school-age population will increase most in the north of the center of the city and the far south by 2025. Single-family homes in the price range that millennial couples (who are most likely to be new parents) with income at the median or 75th percentile might be able to afford are predominantly located east and south of the Wilson HS boundary.
- About half of the growth expected by 2026-27 might be needed in upper grades – 6,200 more high school seats and 5,400 more middle school seats. This growth is estimated to occur as the base cohort grows due to natural growth from more births in the city, and because more students are staying in public schools, even between middle and high school. The need for more middle and high school seats is important to consider because this will represent a shift in grades with growing enrollment toward grades 6 to 12. The increasing trust in public schools in earlier grades has not yet translated to higher enrollment in upper grades, as public school enrollment in grades 6 through 12 decreased over the last ten years. The momentum of the cohort born in 2007 who attend public schools at higher rates through grade 5 will have to continue through these upper grades to meet these estimates.
- For this growth to come to pass, D.C.’s public schools— especially middle and high schools close to where Millennials are likely to live—must be attractive to a wide range of families. Just as specialized programs, especially at the elementary level in dual language, have driven demand,[10] innovative and strong schools at the middle and high school levels in the majority of the city where students don’t attend their in-boundary school will be necessary to encourage enrollment in these levels through the next stage of D.C.’s public school growth.
Finally, schools where families want to enroll their children must have additional capacity to accommodate more students – more space could be available by filling vacant seats, adding seats to an existing school as it grows, or opening new schools. In 2016-17, there were an estimated 14,844 vacant seats at schools that could serve pre-kindergarten to grade 12 students.[11] This includes seats at some schools that are adding grades as well as seats at other schools that have remained empty from year to year. Even assuming that each of these vacant seats are filled, about 6,300 students would still need space at D.C.’s public schools if these growth estimates are realized.
Click here to read the full report or download the report as a PDF.
Chelsea Coffin is the Director of the Education Policy Initiative.
The author is grateful to the Walton Family Foundation and Education Forward DC for their generous support of the Education Policy Initiative. The paper benefited from helpful feedback and input from Jeannette Chapman, Matt Chingos, Jennifer Comey, Steven Glazerman, Dawn Leijon, Sara Mead, Arthur McKee, Ginger Moored, and Jon Valant. At the D.C. Policy Center, Yesim Sayin Taylor and Kathryn Zickuhr offered crucial guidance, and Simone Roy produced the estimates from Census microdata.
Notes
[1] Here and throughout, public schools include both traditional public and public charter schools.
[2] This is aligned with the Pew Research Center’s definition of those born between 1981 and 1996 (Dimock, 2018). We use 34 years old as an upper bound instead of 35 years old to align with commonly reported age groups on the American Community Survey.
[3] Mothers are referenced instead of families because the data are tracked by residence of the mother, not the family.
[4] In absence of a common performance metric for all schools, student achievement is the best available measure of district-wide school quality. D.C. public school students made steady gains of 19 percentage points in Math and Reading combined over seven years on the previous state assessment, DC-CAS (Office of the State Superintendent for Education (OSSE), 2014). Since switching to the PARCC assessment in 2014-15, D.C. public school students’ scores have increased by nine percentage points in English Language Arts and seven percentage points in Mathematics.
[5] For example, kindergarten enrollment is expected to grow by 871 students. To get the total enrollment in its grade band that includes three grades (pre-kindergarten for children aged three, pre-kindergarten for children aged four, and kindergarten), this estimate is multiplied by three to get growth of 2,612 for the grade band.
[6] Since boundaries changed in 2015-16.
[7] Neighborhoods north of the center of the city with largest increases include Brightwood Park, Crestwood, Petworth, Columbia Heights, Mount Pleasant, Pleasant Plains, and Park View.
[8] Neighborhoods in the south with largest increases include Congress Heights, Bellevue, and Washington Highlands.
[9] Neighborhoods that have experienced decline but may increase their school-age populations include Eastland Gardens, Kenilworth, Twining, Fairlawn, Randle Highlands, Penn Branch, Fort Davis Park, and Fort Dupont.
[10] For example, out of the ten schools with the highest waitlists in 2017-18, six offered dual language programs (D.C. Public Charter School Board, 2017) (D.C. Public Schools, 2017).
[11] This excludes from enrollment and capacity eight DCPS schools that were missing capacity information and assumes that schools will fill to 95 percent of their capacity, which is a threshold for District of Columbia Public Schools (DCPS) that requires a plan to ensure that a facility does not suffer from overcrowding.