D.C. summers feature hot temperatures and high humidity, compounded by effects of urban heat islands which trap heat in highly developed parts of the city. However, not only can temperatures vary widely across the city, but sensitivity to heat varies widely across the District as well.
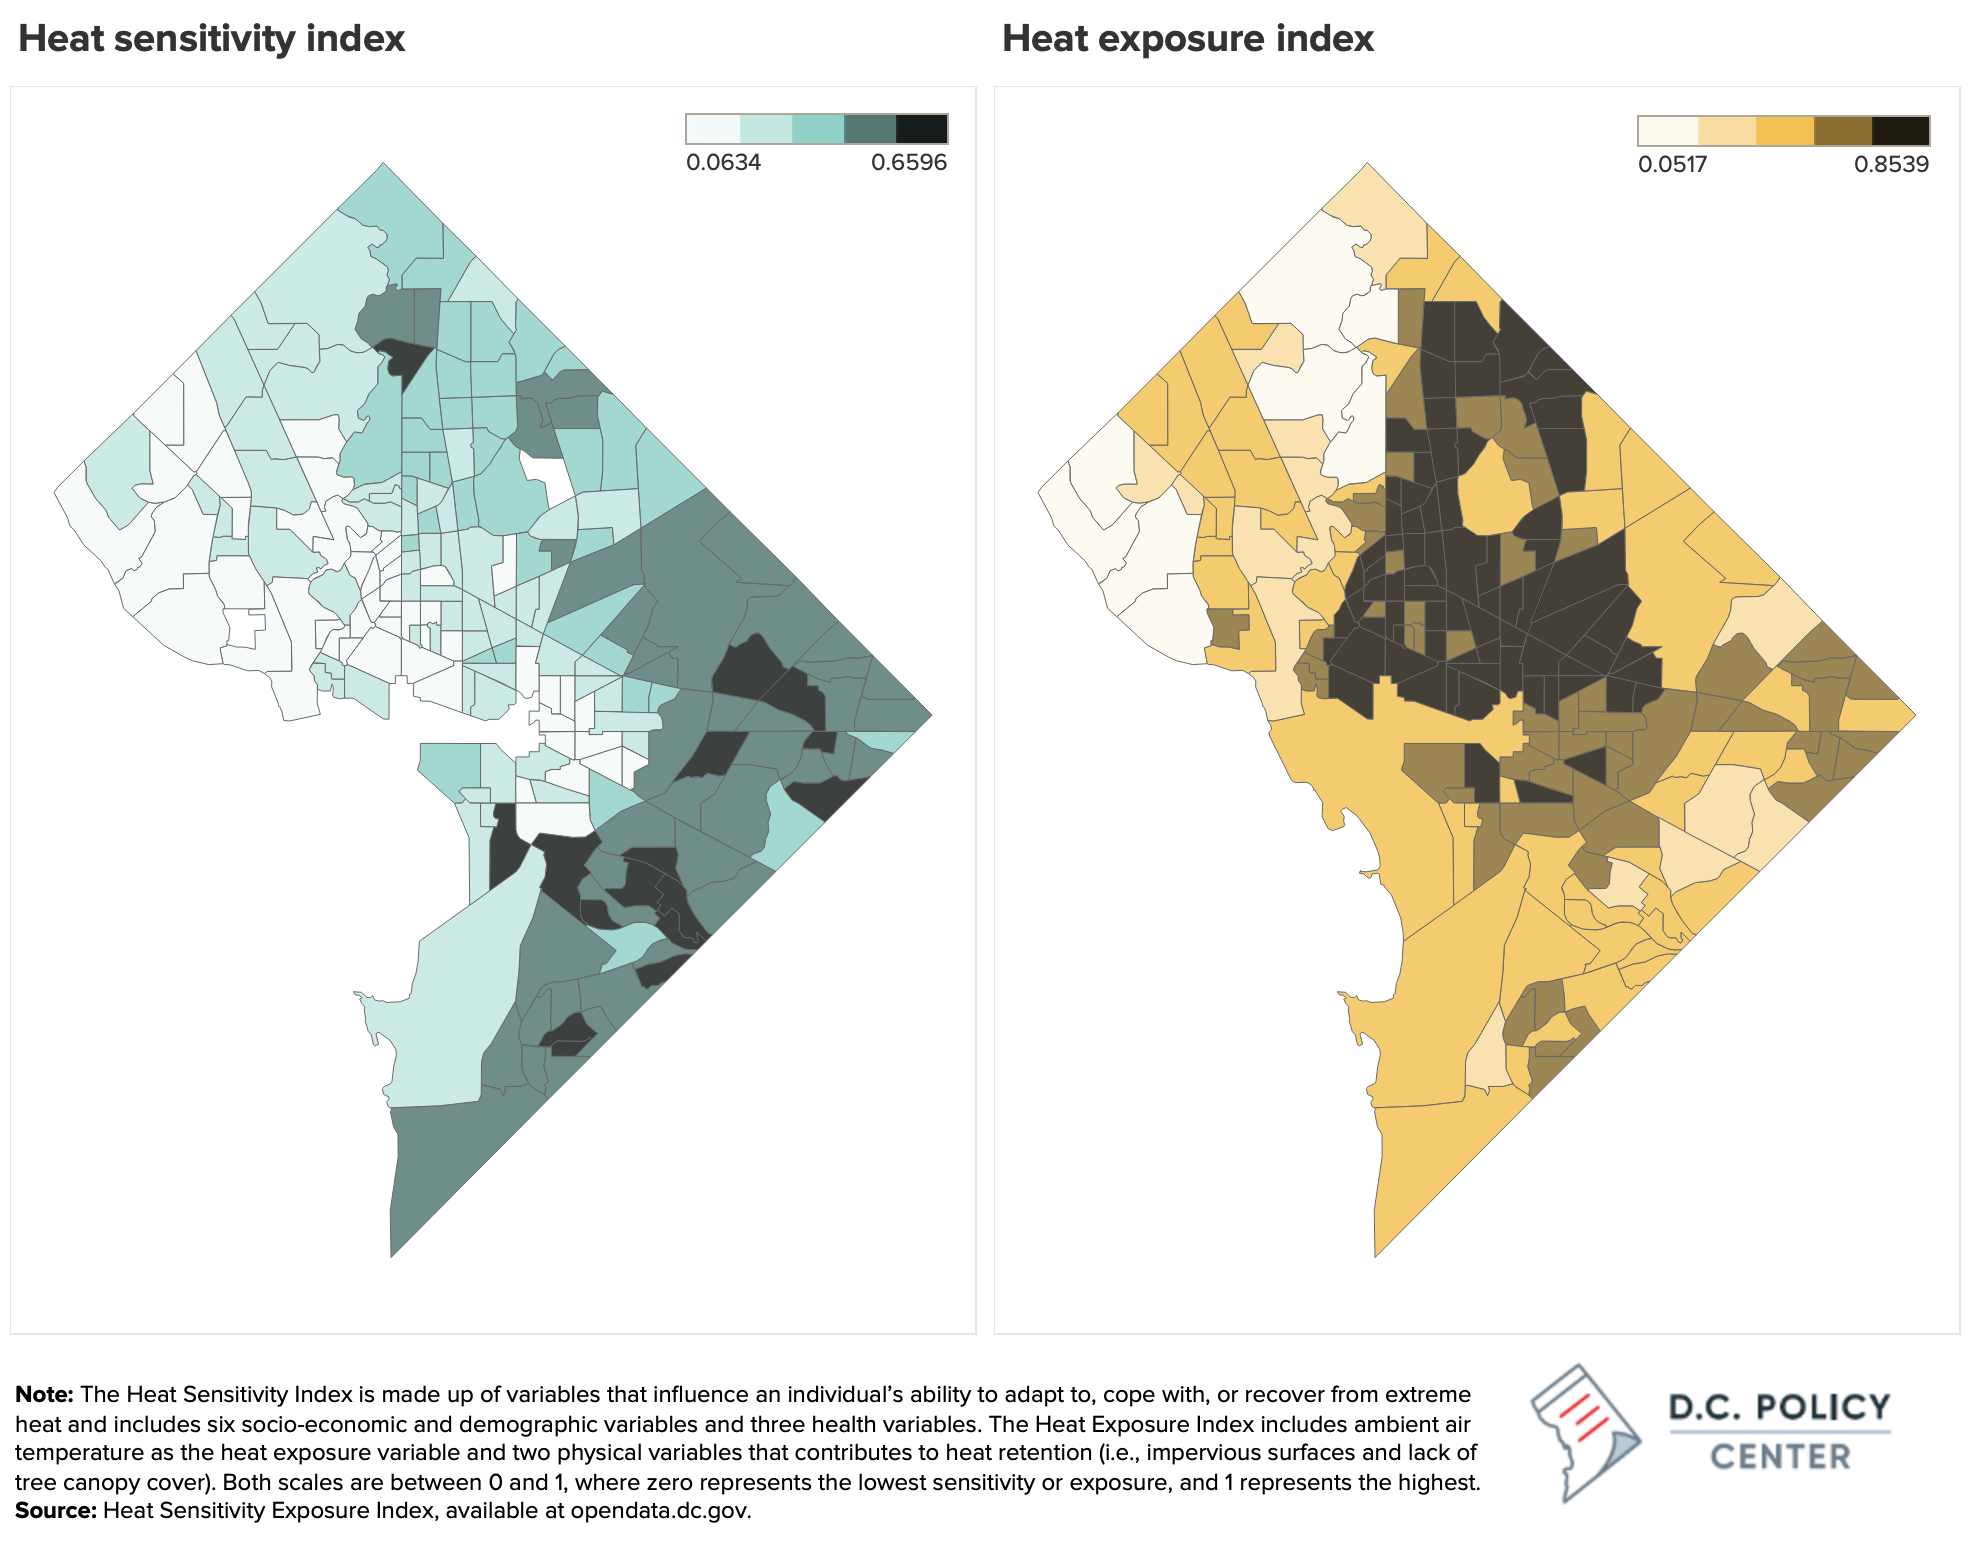
Exposure to heat in the District is affected by several factors, particularly ambient air temperature, tree canopy cover, and the amount of imperious surfaces such as asphalt and concrete.1 As such, heat exposure is much higher east of Rock Creek Park where there is greater building density, reduced tree cover, and higher ambient air temperatures. The highest heat exposure scores are concentrated in Wards 1, 4, and 6.
Much like heat exposure, sensitivity to heat or the ability of residents to cope with or recover from heat exposure also varies widely across the District. Sensitivity to heat is affected by several factors including age (individuals over the age of 65 and young children), income, race, disability, language barriers, and underlying medical conditions such as asthma, obesity, and coronary heart disease. These factors can put residents at risk as they either increase the likelihood of heat-related illness, represent populations that are less able or likely to seek medical care, or represent populations that have less access to mitigating tools such as air conditioning. Residents with the greatest sensitivity to heat are concentrated in Wards 5, 7, and 8.
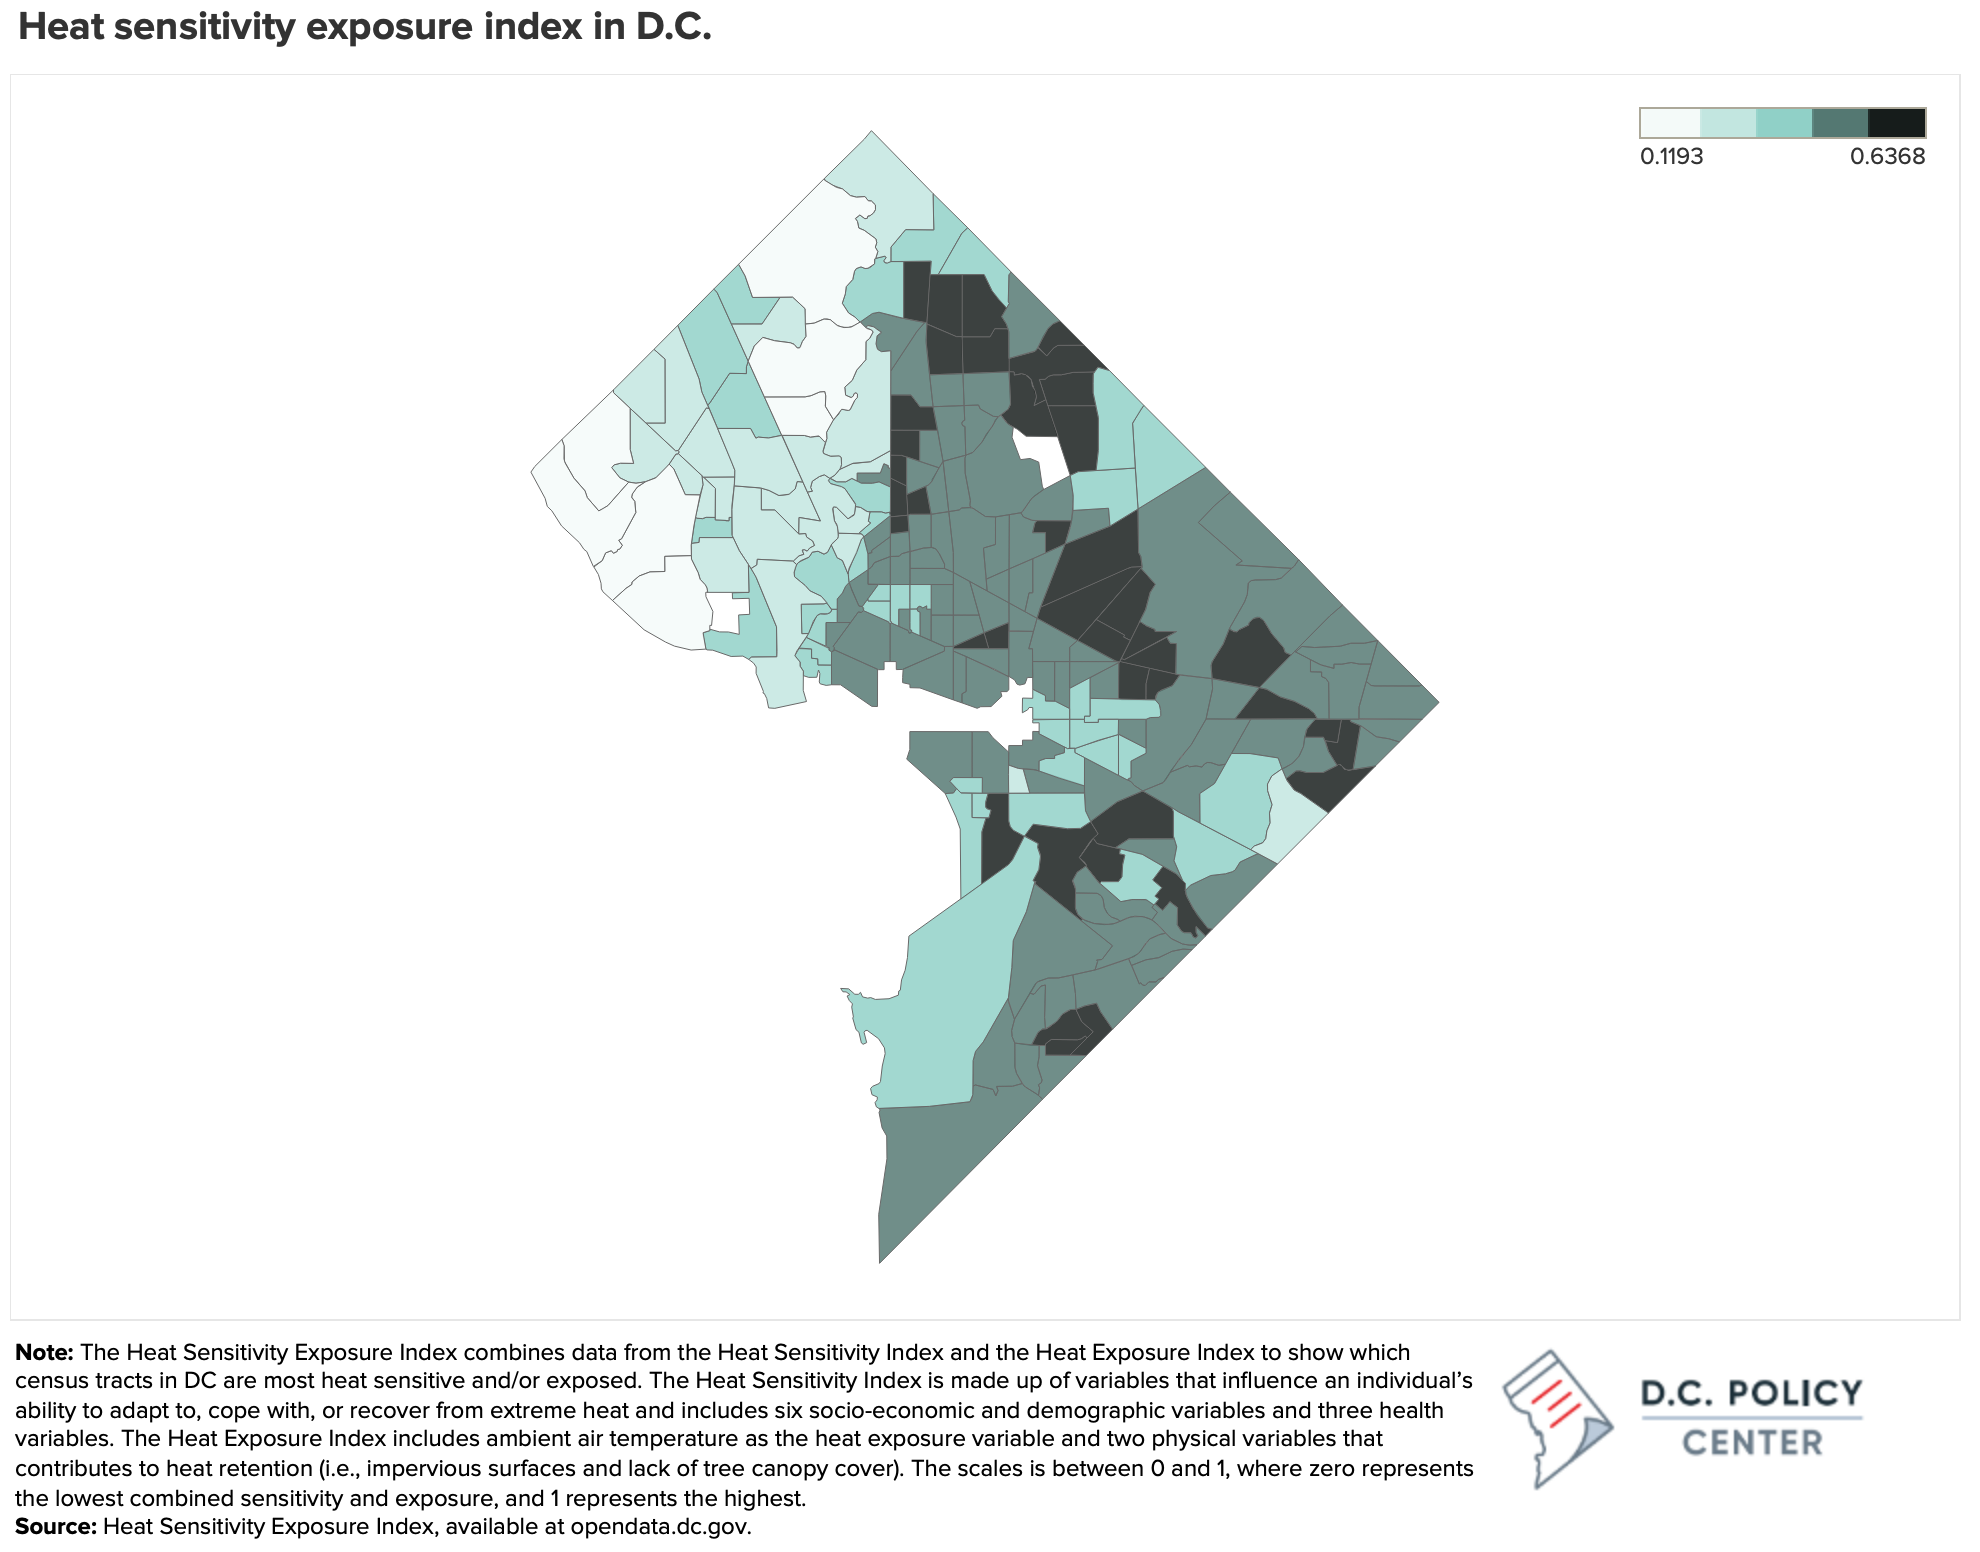
Combining these metrics, the Heat sensitivity exposure index reveals which parts of the District are both exposed to high heat and home to heat-sensitive residents. Rock Creek Park and 16th st NW serve as a sharp dividing line between which parts of the city are exposed to and sensitive to heat (Wards 1, 4, 5, 6, 7, and 8) and which are not (Wards 2 and 3). Using these data, District agencies can identify high risk neighborhoods, analyze where facilities are lacking, and plan where heat mitigation efforts such as cooling centers would be most effective.
About the data
The Heat sensitivity exposure index was developed by the D.C. Department of Energy and the Environment (DOEE) and made available through opendata.dc.gov. The list of variables and methodology can be found in the Heat Sensitivity-Exposure Index Methodology Report.
Endnotes
- Smith, Randy. “D.C.’S Heat Islands.” D.C. Policy Center, 8 Aug. 2017, www.dcpolicycenter.org/publications/urban-heat-islands.