Residential properties in the District’s historic neighborhoods are generally more expensive than those outside these neighborhoods. But data show that these buildings have underperformed in value appreciation compared to the rest of the city.
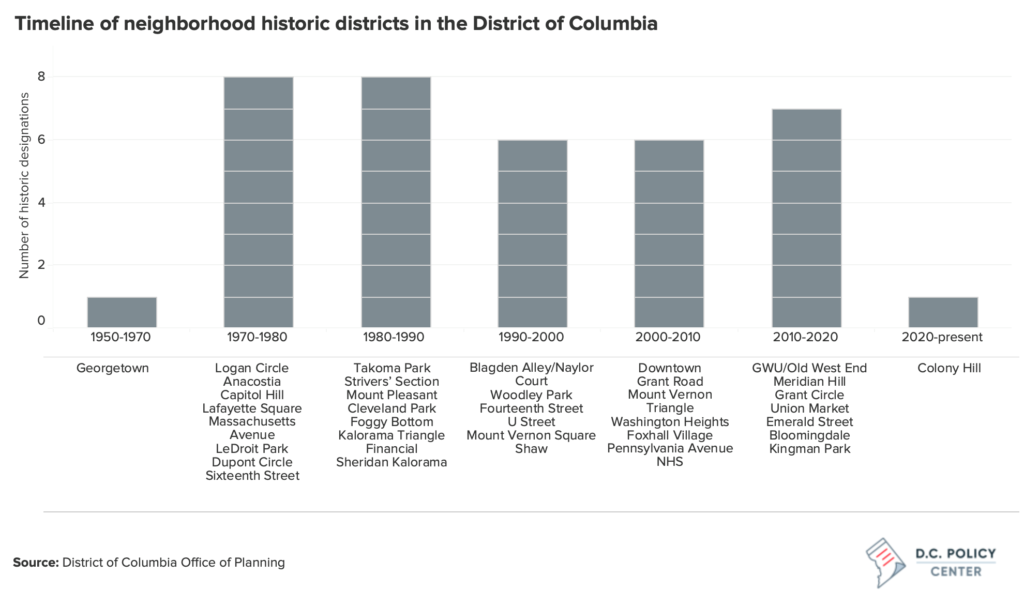
Since 1950, the District of Columbia has registered 70 historic districts, of which 37 are neighborhoods and 33 are local parks, campuses, or military sites.1 Since 1970, every decade, six to eight neighborhood historic districts have been added to the inventory. As of 2021, there are 28,403 contributing properties in historic districts, which is the equivalent of one in five buildings in the city—a share higher than all other major cities in the country. Most historic districts are in residential neighborhoods, and 17 percent of all residential buildings in D.C. are designated as historic properties.
How does historic designation work?
In the District of Columbia, the process of receiving a historic designation begins with an application to the Historic Preservation Review Board (HPRB), a committee with members appointed by the Mayor and approved by the D.C. Council. The nomination for historic designation can be filed by government agencies (including the HPRB itself), preservation advocates, but most often by Advisory Neighborhood Commissions.
After the nomination, all development in the neighborhood is stopped until a public hearing to determine designation is held. In accordance with the law, the HPRB’s vote relies solely on the historical significance of the neighborhood, and while community opinion is not codified, it is generally considered to be part of the decision process. If the nomination is accepted, all existing properties within that historic district are bound by additional regulations and reviews for any alterations.
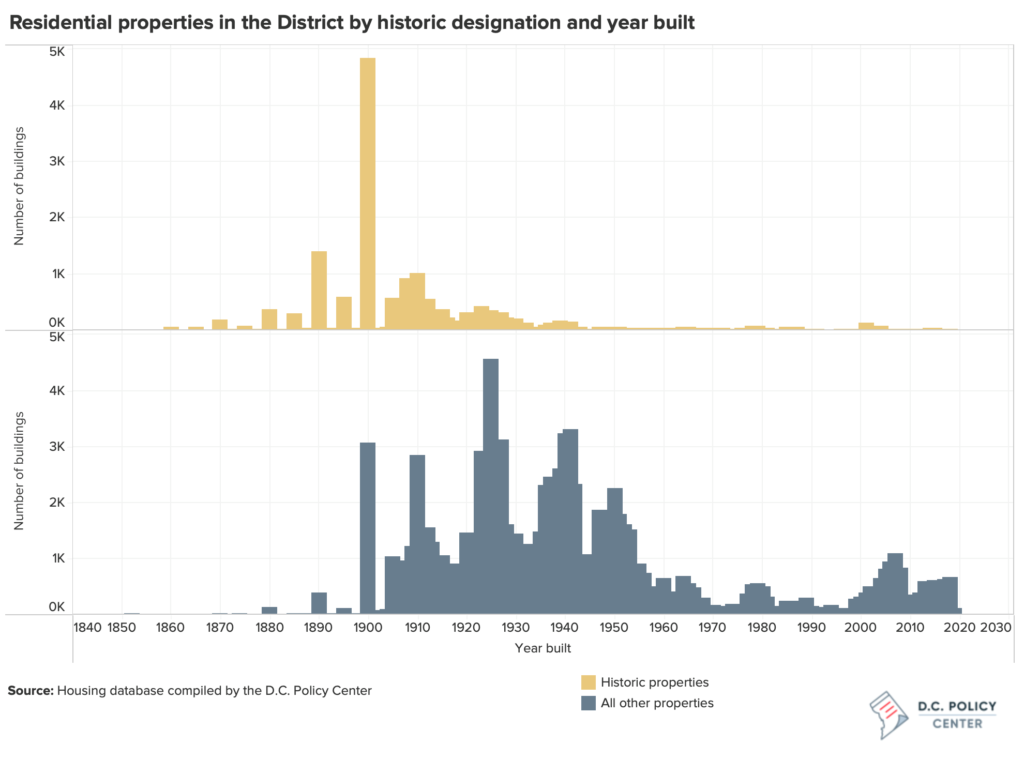
The city’s preservation laws aim to ensure that any changes made to historic properties are “compatible with their historic character”, and as such, property owners are required to obtain approval for all external renovations from the Historic Preservation Office and HPRB. For example, a historic property owner can freely change building interiors, but any changes to the building exterior, such as replacing windows, repairing fences, or even changing a visible doorknob, are subject to a historic review process and must follow certain rules and processes. Given that over 90 percent of buildings in historic districts were built before 1950, and nearly 40 percent before 1900, the need for such repairs is common. But given the historic district rules, repairs could be so cost prohibitive that the D.C. government provides income-targeted subsidies for the completion of the necessary exterior work.2
New construction in historic districts, which is rare, must also follow strict guidelines of compatibility set by the Historic Preservation Office and HPRB, such as requirements for specific materials to be used, or limits to building height above and beyond zoning laws.
What do neighborhood historic districts look like across the city?
Historic districts fluctuate greatly, both in terms of size and number of contributing properties, ranging from Capitol Hill, which covers 1.17 square miles and contains 6,579 residential properties, to Emerald Street, which is only 0.004 square miles with 75 properties.
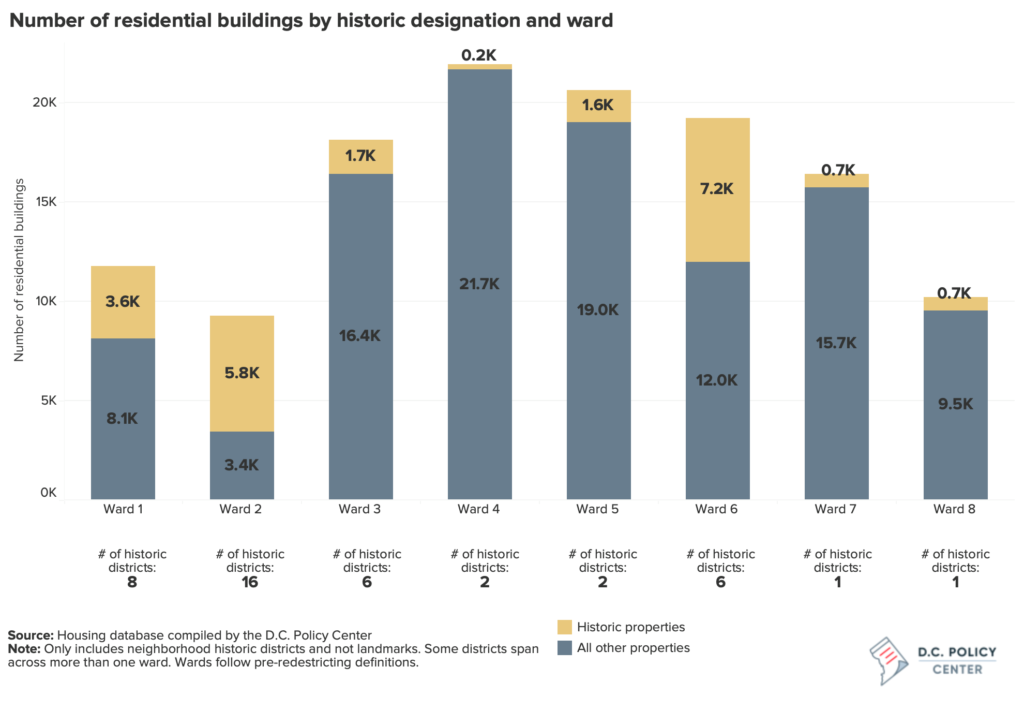
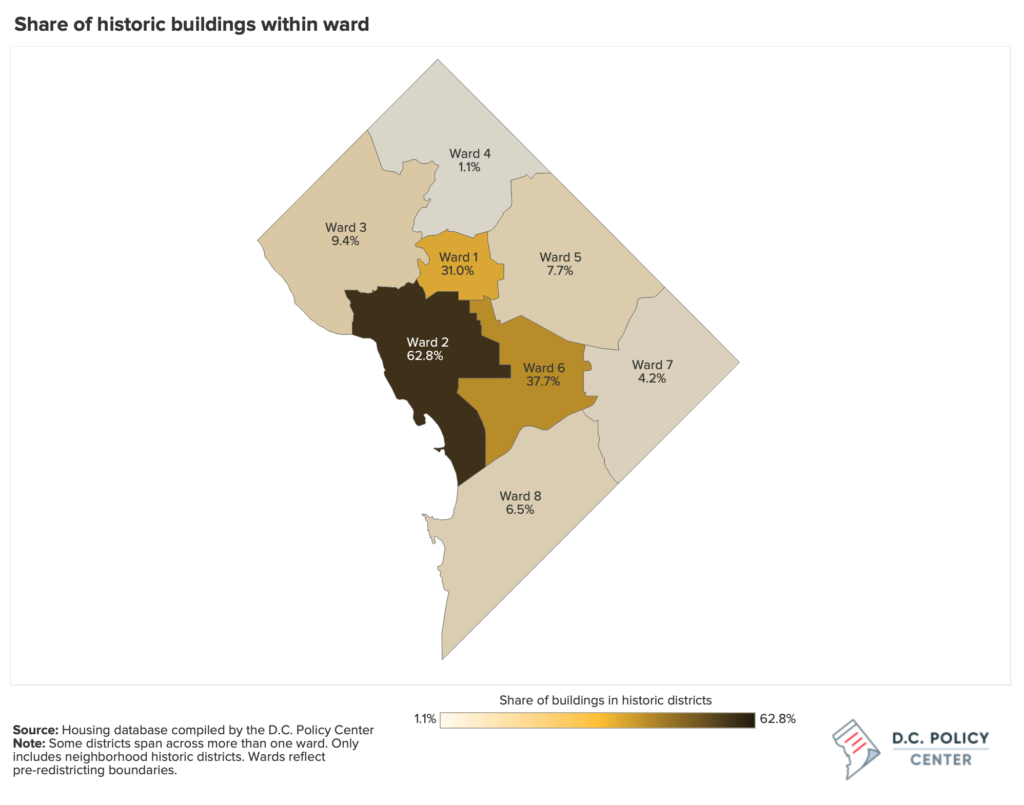
Over 60 percent of the 21,769 residential buildings in D.C.’s neighborhood historic districts are in Ward 6 (33.6 percent) or Ward 2 (27 percent), which comprise of the two largest historic districts, Capitol Hill, and Georgetown, respectively. Ward 2, which contains the most neighborhoods with historic designations (16), is the only ward in which historic buildings account for the majority of residential stock (62.8 percent). Ward 4 has the fewest residential historic buildings, which account for only 1.1 percent of the city’s total historic housing stock.
Single-family homes constitute the majority of the city’s residential historic buildings (66.1 percent)—in line with the overall composition of the housing stock—and over 15 percent of all single-family homes are designated historic. However, conversions,3 which make up only 6.6 percent of all residential properties, account for nearly a quarter of historic buildings, diverging from this trend: 61 percent of all conversion buildings have historic designation.
How have historic designations affected property values?
Historic designation, or preservation, has been greatly debated in the District (as elsewhere in the country). Supporters claim that historic preservation protects architecture of significance and promotes the local history and culture.4 On the other hand, critics of preservation policies argue that the restrictive regulations obstruct the city’s housing supply, increasing housing costs and exacerbating unaffordability.5
The stated goals of historic preservation are intangibles such as “sustaining cultural heritage, beauty, and identity,”6 or preserving the aesthetics and architecture of a place,7 but advocates also link these goals to tangible benefits such as educational opportunities and tourism. As such, a historic designation trades the tangible value of future development in return for the value from these intangibles. This tradeoff does not mean that individual properties will appreciate less,8 but since little to no development happens in historic neighborhoods, the value growth will be fueled only by the appreciation of existing buildings, and not the construction of new ones.
So how have residential property values appreciated in the District’s historic districts? And how does this compare to value growth in the rest of the city? To answer this question, we compared value appreciation of all buildings in historic districts to all other buildings.9 Our data go back to 2006, so we limited this comparison to neighborhoods which already had historic districts before 2006. Thus, our comparison excludes 2,971 residential properties in 11 neighborhoods.
This comparison shows that overall, between 2006 and 2021, assessed values of residential properties in neighborhoods without any historic designation grew at a faster rate than those in historic districts. 10 Neighborhoods without historic designation increased in value 1.5-fold (147 percent), while those with a historic designation increased 1.1 times (106 percent)—a 41 percent in difference in the value growth rate. On an annual basis, the total value of buildings in historic districts grew by 4.9 percent, while those in the rest of the city grew by 6.2 percent.
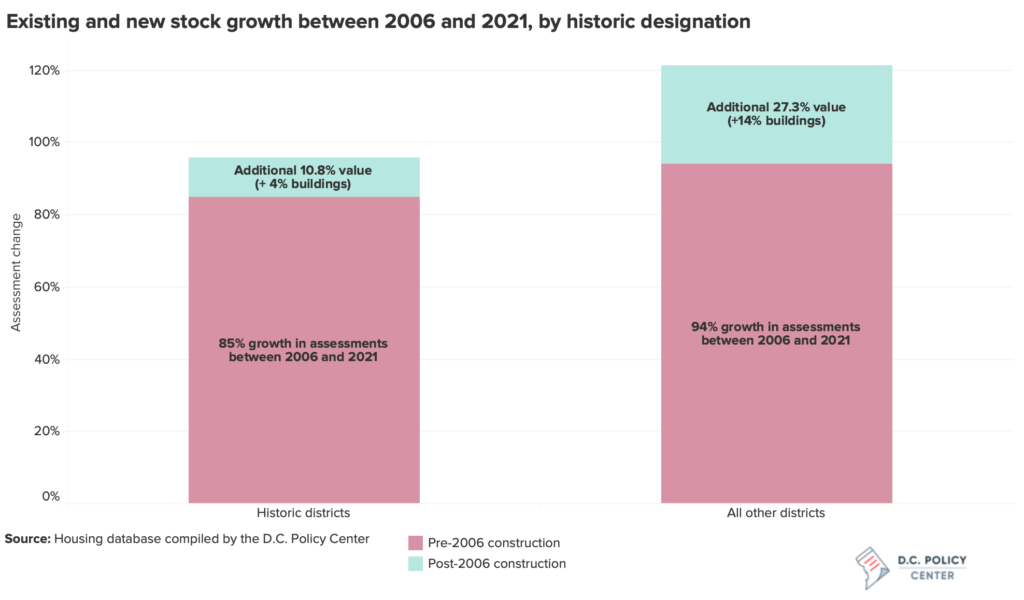
This top-level comparison, however, does not take into consideration the differences in the pace of new construction in and outside of historic districts. To account for these differences, we separated the value appreciation to capture (a) the growth in the value of the housing stock that was already in place in 2006, and (b) the growth in value associated with new development.11
We find that the existing stock—residential buildings constructed before 2006—outside of historic districts, as a whole, appreciated faster than residential buildings inside of historic districts. They appreciated 94 percent between 2006 and 2021, compared to 85 percent within historic districts.
There could be multiple factors contributing to the faster appreciation of the existing stock outside of historic neighborhoods:
First, it is possible that historic neighborhoods already began at a higher value, whereas non-historic neighborhoods were more likely to begin at very low values in 2006 and therefore appreciated faster as the District’s population grew and more neighborhoods were gentrified. Property-level data supports this possibility. In 2006, the median residential property in a historic district was 94 percent more valuable than the median residential property in a non-historic district. In 2021, that value differential had dwindled down to 66.4 percent.
Second, it is possible that value appreciation in historic neighborhoods is depressed by the higher costs of maintenance associated with historic district rules.
Third, it is possible that non-historic districts appreciated more in value, because the market rewards proximity to new housing development.
Arguably, the most meaningful difference between historic neighborhood districts and the rest of the city is in their potential for redevelopment and construction. New development in non-historic neighborhoods resulted in the addition of 12,339 buildings (13.1 percent increase in stock). This is equivalent to a supplementary $23.8 billion, or a 27.3 percent appreciation of total assessment values. In comparison, historic districts saw a mere 4 percent increase in the number of buildings, leading to only a 10 percent growth in total value. The cost of historic districts is this difference in value appreciation. It is both a fiscal cost (foregone tax revenue) and a social cost (forgone development, more housing, lower values, more families, increased tax base, etc.). That difference is what we attach to the value of historic designation.
Assessment changes by ward
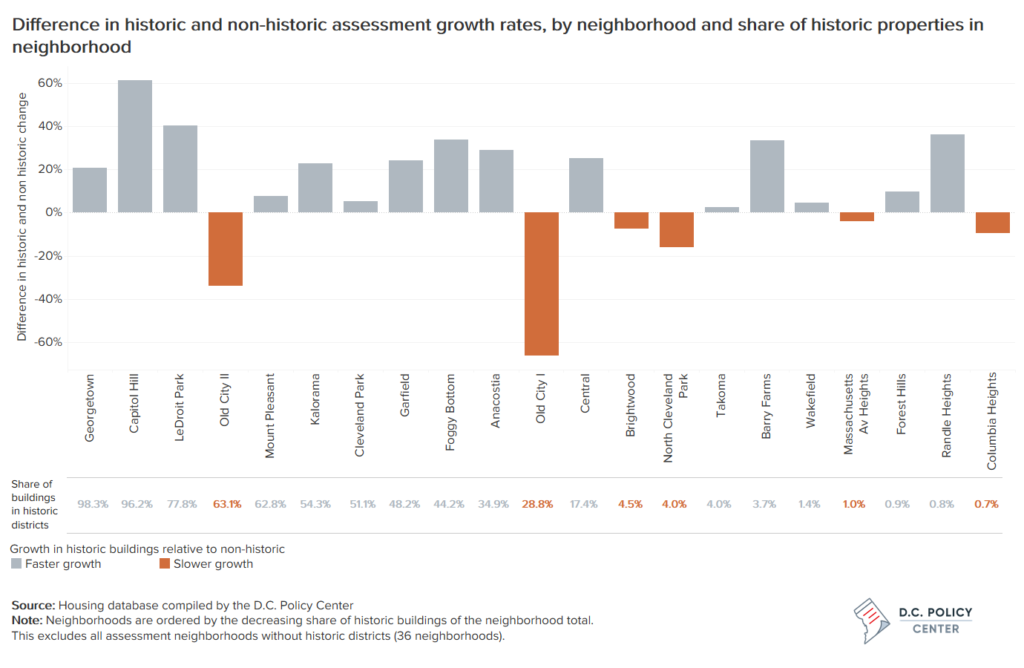
There is no dominant trend in assessment changes when looking at wards. In Ward 6, the value of non-historic properties has grown significantly faster (58 percent more) than that of historic properties, and Ward 1 sees a more muted version of this pattern. We see the opposite in Ward 2, where the value of historic property (the majority of stock) grew by 10 percent more . We see the same in Ward 3, where it grew 14 percent more. Though Ward 4 shows comparable growth between historic and non-historic values, and Ward 8 shows a similar reversal, these two wards contain far fewer historic buildings. Given that the neighborhood historic districts in Wards 5 and 7 were added after 2006, they are excluded.
Assessment changes by building type
Across building types, the rate of value growth between historic and non-historic properties is fairly comparable, except for conversions and apartment buildings, where historic buildings appreciated noticeably slower than non-historic buildings. Between 2006 and 2021, apartment buildings show the largest close in gap between median assessment values of historic and non-historic buildings (a 93 percent decrease). Single-family homes and conversions also see a significant reduction in the value gap, while cooperatives show an increase in this value gap— almost 19 percent—and condominiums see a modest increase of 3 percent.
Data and methodology
This analysis relies on historic snapshots for years 2006 through 2021 of the Integrated Tax System Public Extract (ITS), which is the District’s tax assessment roll. Since the tax rolls dataset tracks condominium units individually (which are unique at the “SSL” variable level), and not entire condominium buildings (which are unique at the “MAT_SSL” level) since each condominium unit has a unique owner. These units were identified as different condominium buildings by using the publicly available Condo Relate file, which groups unique condo SSLs under a MAT_SSL building flag. The ITS database assigns each property a “use code”, through which we identified property types. Use codes and their descriptions can be found in the Integrated Tax System Use Codes Lookup file.
The ITS data was then combined with the Zoning to Property Lot Query Layer, which indicates the historic designation status of a property. Since this data is unique at the building level, we joined the data using the MAT_SSL variable for condominiums, and SSL variable for the remaining buildings. Any unmatched data included only non-residential buildings.
Since the tax assessment data goes back to 2006, we exclude all historic districts registered 2006 onwards. Our analysis includes only neighborhood historic districts, and not those that are categorized as parks, campuses, or military sites.
Endnotes
- As listed in the District of Columbia Inventory of Historic Sites; see more here.
- The program, known as Historic Homeowner Grant Program, is operated by the D.C. Office of Planning and are available only in 15 historic districts. For details, see here.
- Conversions are small multifamily buildings that are typically converted from a single family unit or a combination of single family units.
- See, for example, arguments put forth by the D.C. Preservation League in their 2019 testimony to the D.C. Council, available here: https://dcpreservation.org/wp-content/uploads/2019/04/DCPL-Testimony-OP-2019_final.pdf
- For a summary of these arguments, see Klarnet, Lev (2020) Preserving History or Property Values: Historic Preservation and Housing Prices in Washington, DC Housing Prices in Washington, DC, Undergraduate Economic Review, Volume 17, Issue 1. Available at: https://digitalcommons.iwu.edu/uer/vol17/iss1/1
- The criteria for designation in the D.C. Inventory can be found here.
- Mason, R. (2005). Economics and historic preservation: A guide and review of the literature, The Brookings Institution Metropolitan Policy Program, Washington, D.C. Available at https://www.brookings.edu/wp-content/uploads/2016/06/20050926_preservation.pdf.
- Most studies on this particular topic show a positive impact on individual property values from historic designation. For example, one literature review of 24 scholarly papers on this topic show that 22 out of the 24 studies that use various methods find positive impacts. For details see, Ijla, A. (2008). The Impact of Local Historical Designation on Residential Property Value: An Analysis of Three Slow-Growth and Three Fast-Growth Central Cities in the United States, available at https://engagedscholarship.csuohio.edu/cgi/viewcontent.cgi?article=1138&context=etdarchive
- We compare all value in a neighborhood associated with residential properties rather than providing in a property-level analysis, which can be complicated given the variation in property types. For details, see Rypkema, D.R., Cheong C., and Mason, R.F. (2013). Measuring Economic Impacts of Historic Preservation, A report prepared for the Advisory Council on Historic Preservation, Washington, D.C. Available at https://www.achp.gov/sites/default/files/guidance/2018-06/Economic%20Impacts%20v5-FINAL.pdf
- Since our assessment values start from 2006, we have excluded any historic districts that were added 2006 and after.
- The existing stock consists of 18K buildings in historic districts and 94.3K buildings across in non-historic neighborhoods.