
When neighborhoods are exposed to crime, children are less likely to play outside, more likely to be stressed out or experience poor mental health. They worry about safe passage to their schools and fall behind in their schoolwork.
The incidence of homicides has increased dramatically in the District of Columbia since 2017. And homicides are increasingly happening in parts of the city that are denser, exposing a larger number of people. But less dense neighborhoods tend have more children, so when adjusted for child population, many more neighborhoods start lighting up on our maps, showing the great toll these events take on the District’s children.
Repeated exposure to neighborhood crime—especially violent crime—can be shocking and traumatic for all residents, but especially children. As noted in the last State of D.C. Schools report, community violence can be a potentially traumatic event for children.1 Even if children are not directly exposed to the crime, the prolonged fear of possible violence can increase stress levels for children, Increased neighborhood crime has been linked to reduced child activity,2 increased stress levels,3 poor mental health,4,5 and decreased academic achievement,6 and severe physical and mental health problems in adulthood,7 among other issues. In a survey of parents of the District’s public school students, the most commonly-reported concern was health and safety.8
Homicide, as a health disparity, is affecting some racial and ethnic groups are more than others.9 These differences become more obvious when homicide numbers are adjusted for exposure—for example, by taking into consideration density or presence of certain subpopulations. Using such analysis, researchers have found that within 800 meters (approximately half a mile), Black residents in Durham, North Carolina were over six time more exposed to violent crimes than white residents.10 Using a similar methodology, this article examines proximity of homicides relative to population, including children, during 2021.
Being a victim or witness to neighborhood violence is considered an Adverse Childhood Experience (ACE). Unfortunately, trauma is pervasive, and approximately one in five children have been exposed to an adverse childhood effect in D.C., including an estimated nine percent of children who have personally witnessed or been victim to violence.11 Stress and exposure to trauma can harm physical and mental health, especially in children. Thus, the strong link between exposure to violent crime and health outcomes renders neighborhood crime is a public health problem.
The analysis shows that nearly 80 percent of District residents lived within a half mile of a homicide that occurred within Washington, D.C. in 2021, and about two-thirds of District residents lived within a half mile of multiple homicides. Additionally, there are racial disparities in proximity to homicide: approximately 68 percent of white District residents lived within a half mile of a homicide, compared to 87 percent of District residents of color—a gap of 19 percentage points. That gap is larger for children: 89 percent children of color live within a half mile of a homicide, where that share is 57 percent for white children: a gap of 32 percentage points.
Higher exposure to homicides for Black and Latino children could have implications for learning and mental health, making it more difficult for them to focus on school or commute to school.
Exposure to a homicide within a half mile in 2021
There were 226 homicides in Washington, D.C. in 2021—a higher number than previous years—but when adjusted for exposure, one can begin to see why violent crimes like homicides are distressing neighborhoods and communities. The first map, below, visualizes the number of homicides that occurred within a half mile of D.C. residents in 2021. The value shown is the number of homicides that happened within a half mile of any given census block. This methodology allows for true exposure because it adjusts for proximity even when the homicides fall out of a given boundary. For example, the area immediately north of Logan Circle appears in the middle category with 11-15 homicides occurring within a half mile of the census blocks, though none of the homicides occurred in that exact location, but to the west (along 14th Street NW), to the north (in the U Street Corridor area), and to the east (Shaw). This approach allows us to correctly capture exposure to homicides since administrative or political boundaries are meaningless when it comes to hearing a gunshot or seeing a bullet fly.
This analysis reveals that in 2021, the census blocks within half a mile of at least one homicide housed nearly 80 percent of Washingtonians. And for census blocks that were within one half of a mile of at least one homicide, the median number of homicide exposures was five. That is, of the roughly 80 percent of District residents who lived within a half mile of a homicide, half of them lived within a half mile of at least five homicides.
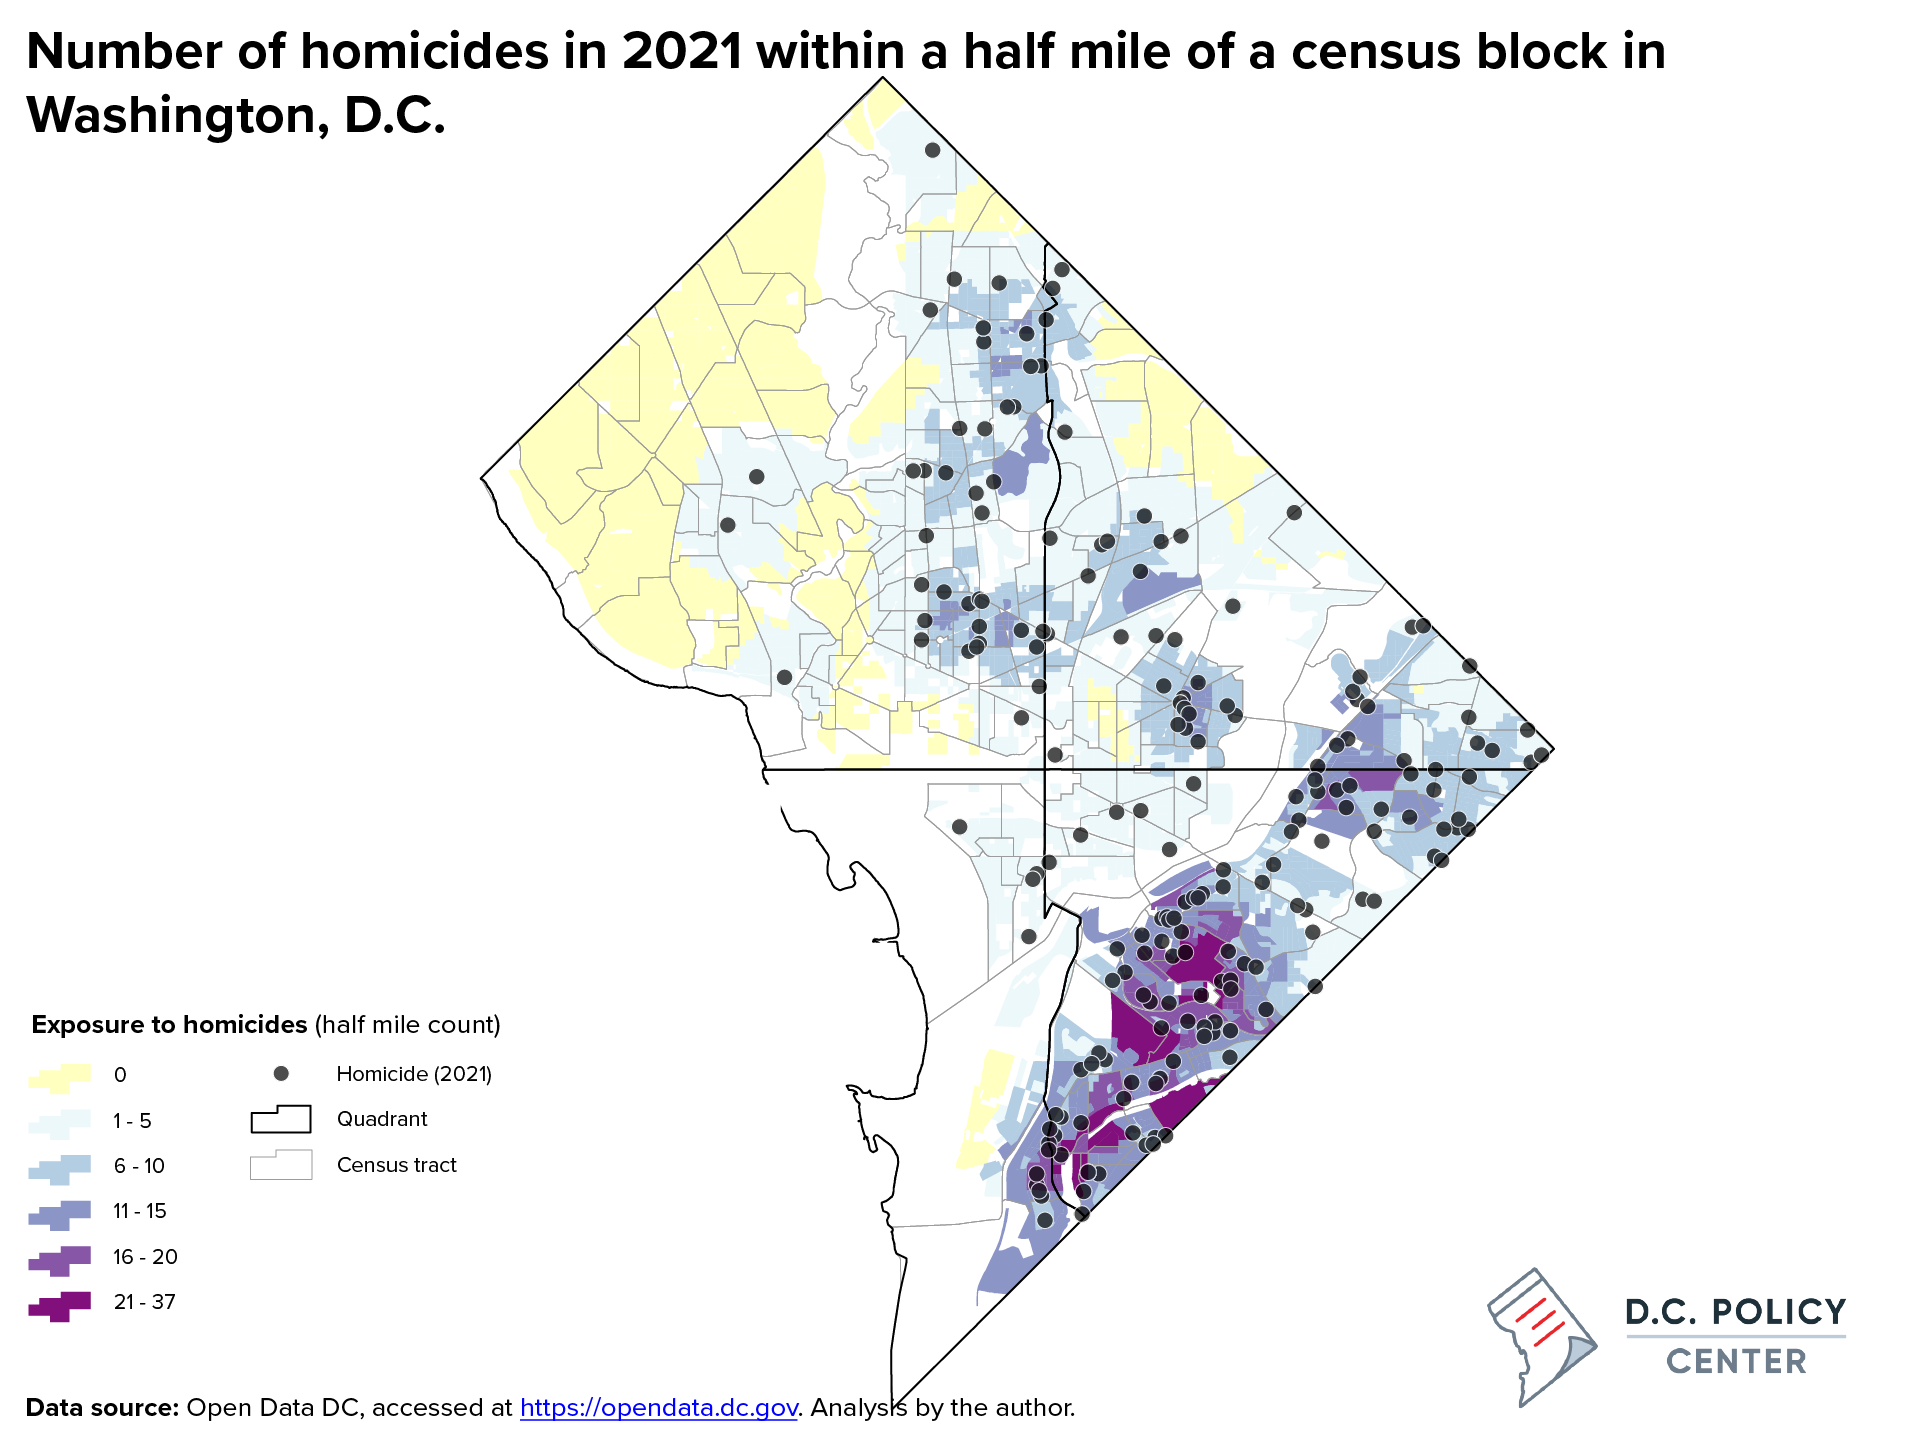
Exposure to homicides is not evenly distributed throughout the District. Areas in Northwest D.C. that are east of Rock Creek Park generally had some exposure to homicides within half of a mile, between 1 and 11 homicides. Northwest D.C. close to the city center generally had higher exposure, while neighborhoods in western D.C. had little to no exposure. West of Rock Creek Park, there were no homicides within a half mile of most census blocks during 2021, with only two occurring in this section of the city.
Northeast D.C. had a wide range of exposure to homicides. The no exposure areas were along the city’s edge in Woodridge and immediately around the Federal buildings in Capitol Hill. High homicide exposure neighborhoods were concentrated in Ivy City, Trinidad, Carver-Langston, and around Benning Road and Minnesota Avenue NE. The rest of the quadrant had at least one homicide exposure but was generally lower than these neighborhoods.
All census blocks in Southeast D.C. (920 total blocks) were within a half mile of at least one homicide that occurred within the District during 2021. Neighborhoods in Southeast D.C. that are west of the Anacostia River, such as Capitol Hill, Barney Circle, and Hill East, had lower exposures to homicides (5 or fewer) while other neighborhoods, particularly those east of the Anacostia River, that had much greater exposure to homicides.12 Washington Highlands, the neighborhood in far southeast D.C. between Oxon Run and the Maryland border, had some of the highest exposure to homicides in the District, between 6 and 30 homicides within a half mile. Exposure to homicides would certainly be increased if homicides that happened in Prince George’s County, Maryland were included in this analysis.
What about children’s exposure to homicides?
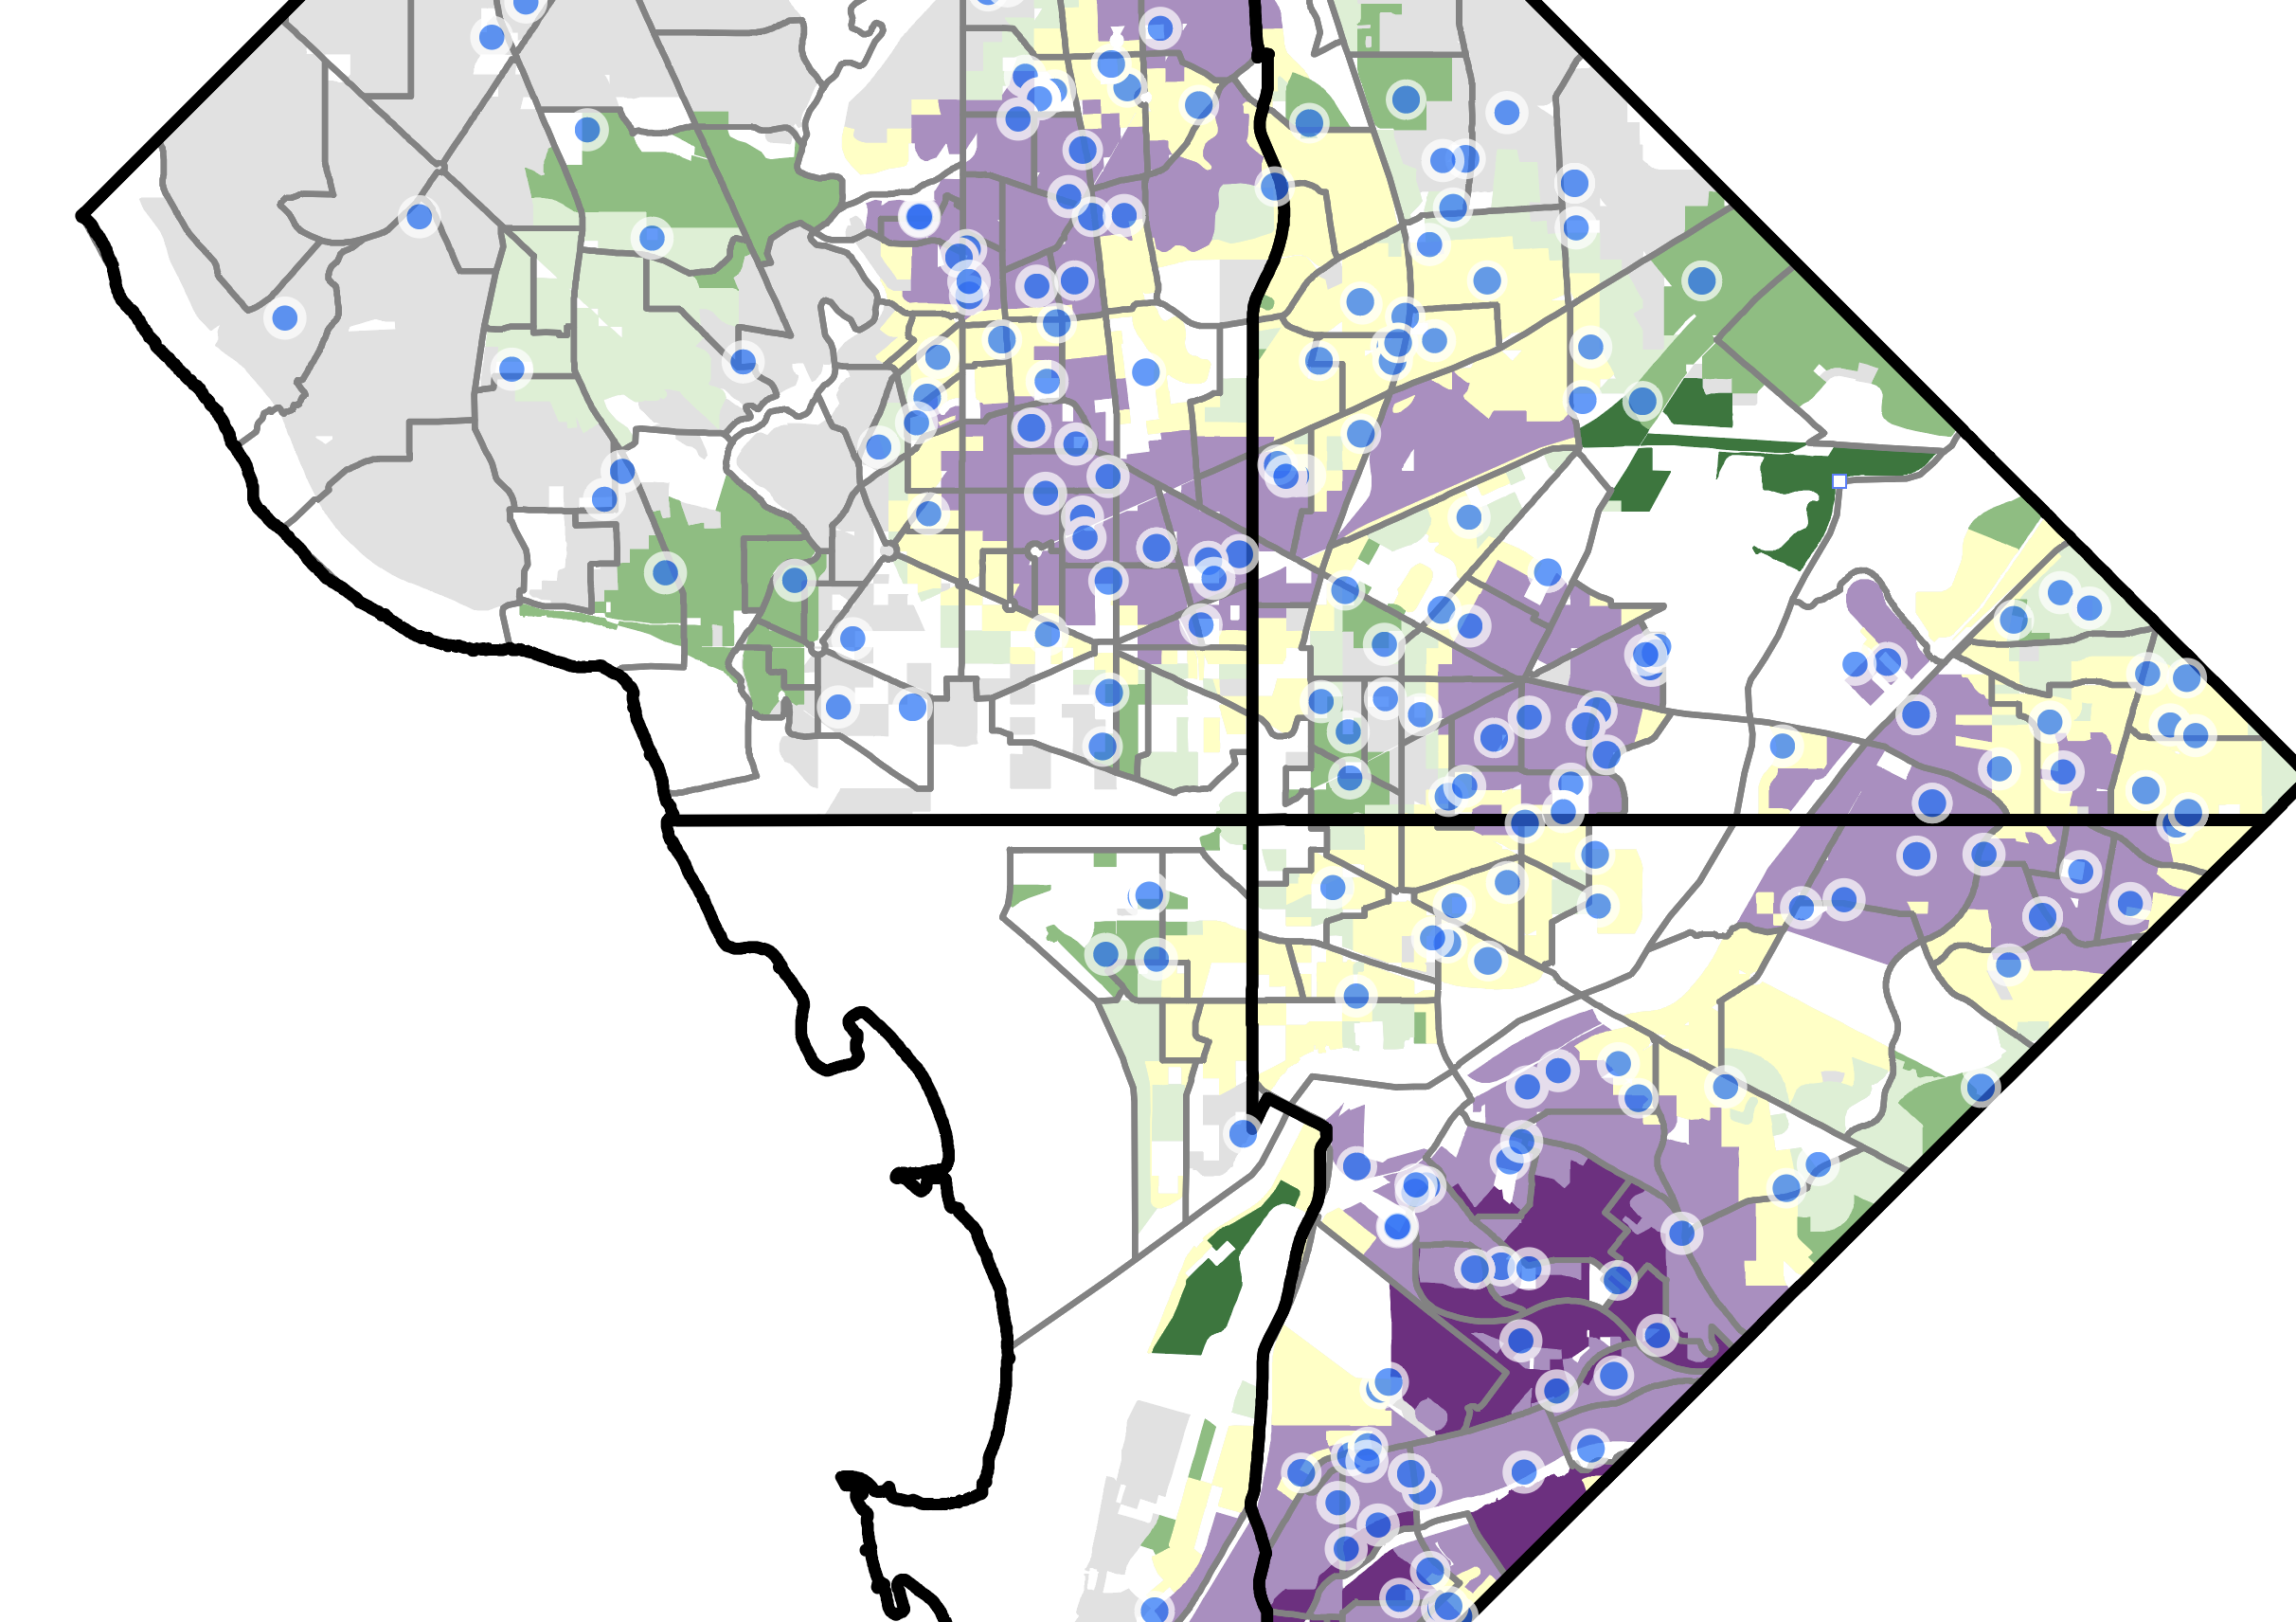
To analyze the exposure between homicides and proximity to children (residents under the age of 18), the map below uses two steps (known as two-step floating catchment method)13 to estimate the number of times a child was exposed to a homicide in each census block. First, for each homicide, the number of children within a half mile of the event is added together. The median number of children within a half mile of a homicide is 2,622 (the average is 2,755). Then, from each census block, instead of counting the number of homicides within a half mile, as in the first map, the total number of children in census blocks within a half mile of each homicide are added up. The purpose of this method is to give increased weight to homicides that occur near children so we can truly visualize the intensity of impacts in places where there are lots of homicides and lots of children.
This exercise shows the great disparity in exposure to violent crime for children living in D.C. The map below shows the distribution of census blocks by the incidence of child exposure to homicide. The yellow areas are where the number of times a child was exposed to a homicide is in the middle of this distribution. Areas in purple have more homicides in proximity to children, while areas in green have fewer homicides in proximity to children.
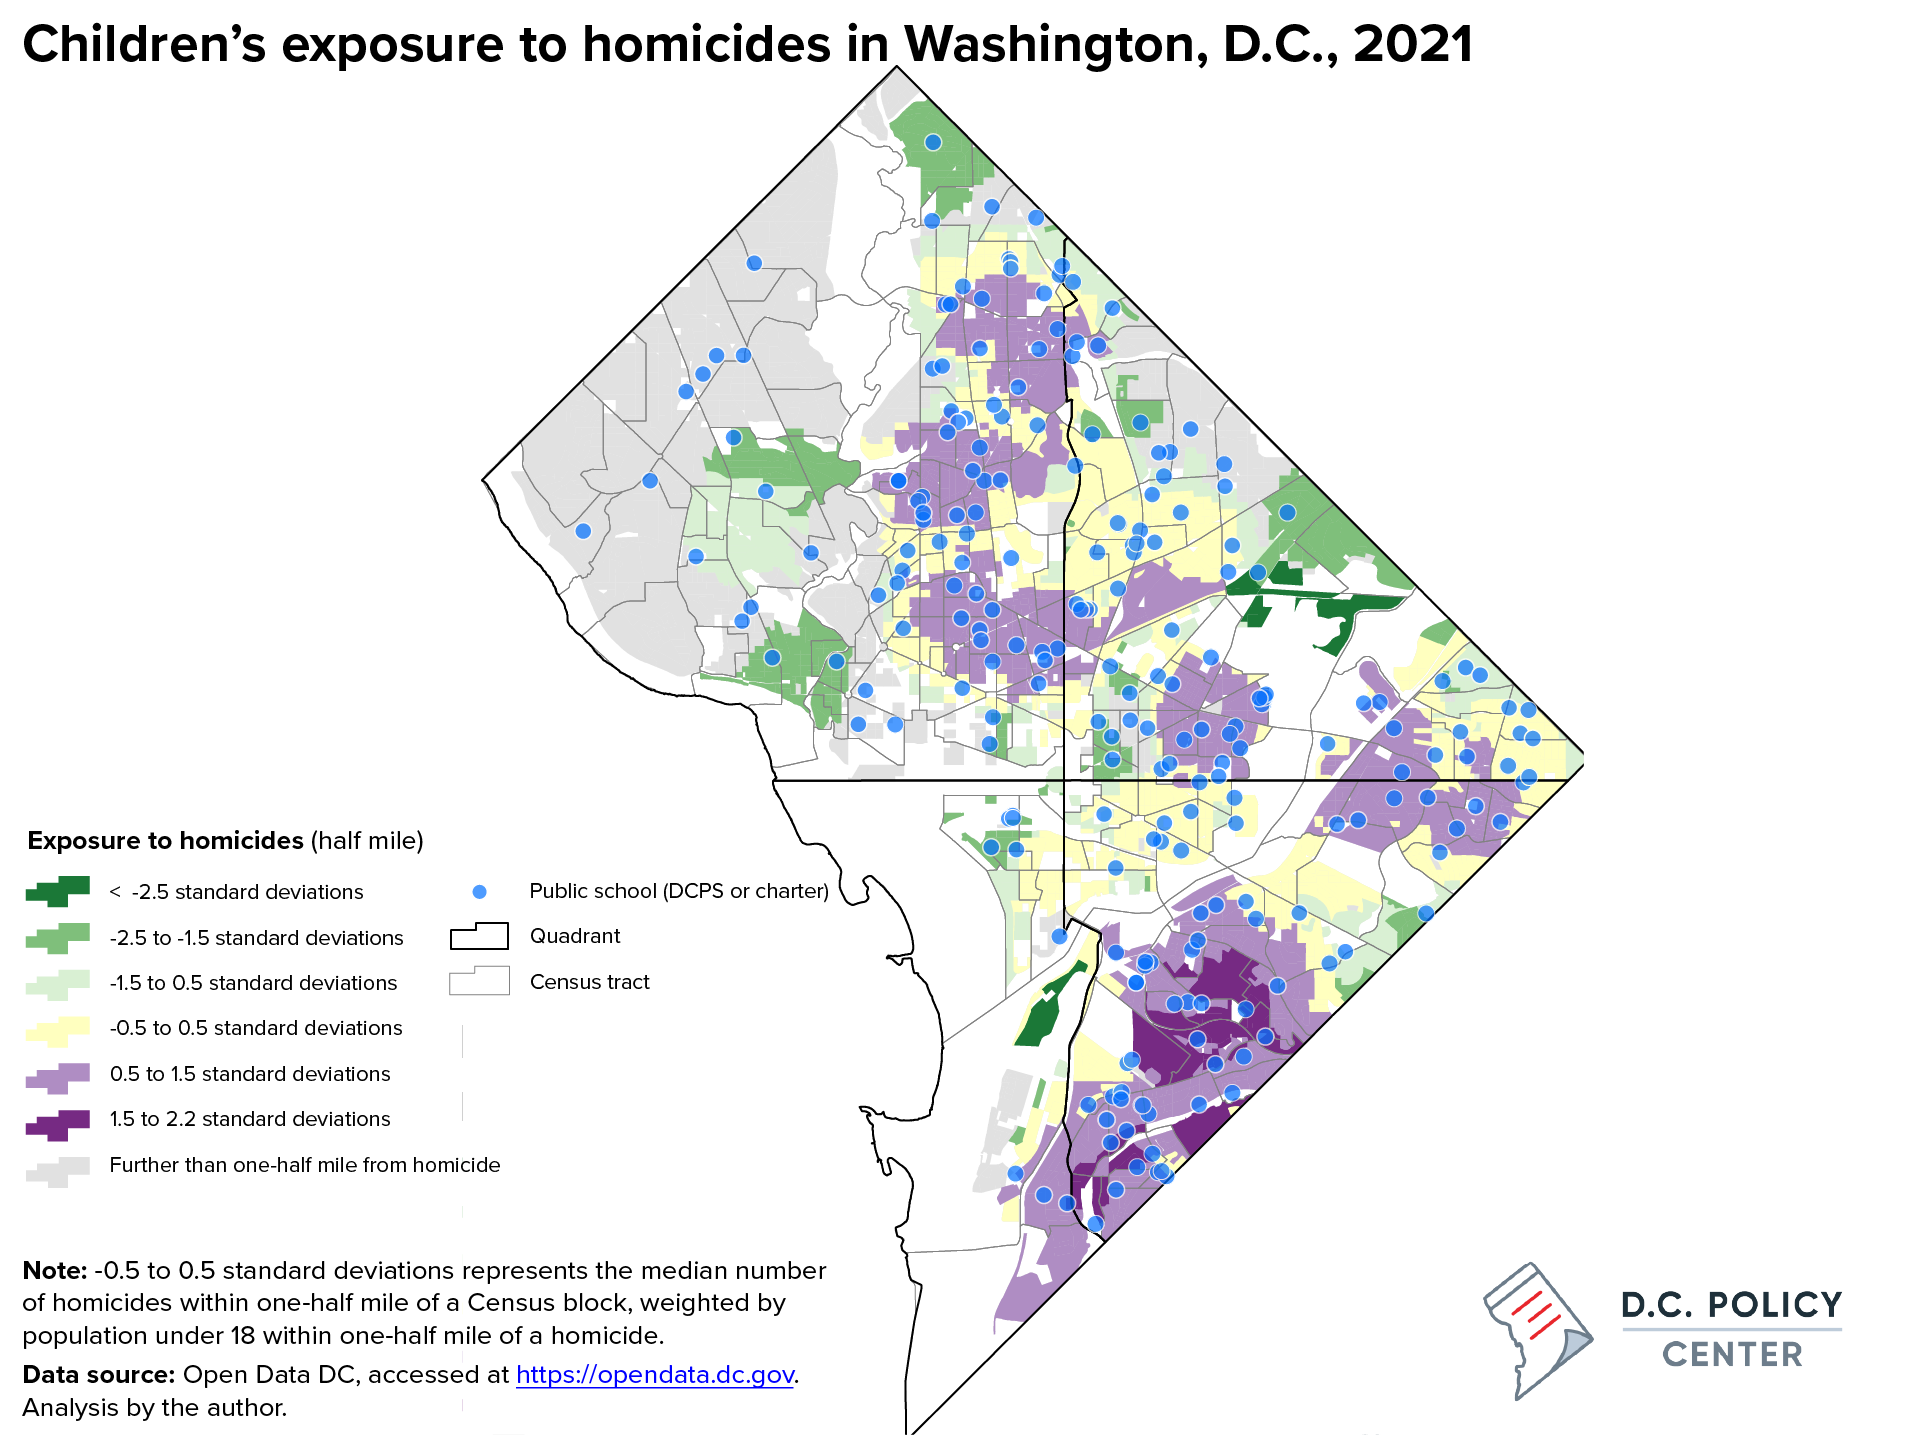
Much of Northwest D.C. has little-to-no exposure to homicide for areas where children live. Areas in Northwest D.C. that are close to the center of the District such as LeDroit Park, as well as neighborhoods in the far eastern sections of Northwest like Brightwood, are those where children have more exposure to homicides.
Northeast D.C. has a wide range of exposure of children to homicides by neighborhood. The areas that have no homicide exposure to children are primarily in Woodridge and Michigan Park neighborhoods, north of South Dakota Avenue NE. Areas with low child exposure to homicides are spread out in this quadrant and include neighborhoods on both sides of the Anacostia River. In Northeast D.C., neighborhoods with high child exposure to homicide are concentrated in Trinidad and Carver-Langston, west of the Anacostia River, and along Minnesota Avenue NE and East Capitol Street NE.
In Southeast D.C., the low exposure areas are primarily in Capitol Hill for areas west of the Anacostia River, and in Penn Branch and Hillcrest for areas east of the river. The high exposure areas are in Historic Anacostia (the area immediately east of the Anacostia River), in far Southeast D.C., around the Douglass and Congress Heights neighborhoods, and around the St. Elizabeths campus.
The Southwest quadrant of Washington D.C. is bifurcated by the Anacostia River and a sprawling set of military installations. The Southwest Waterfront area is a neighborhood of low exposure of homicides to children. However, looking back at the first map, there were some homicides that occurred in that section of the quadrant (or nearby). It may be that there are fewer households with children in that section of the District compared to other neighborhoods. The other side of Southwest D.C., the Bellevue and Blue Plains neighborhoods, has high homicide exposure to children.
As these maps show, in some parts of the city, residents were exposed to a homicide, on average, nearly every other week, and over the year, there were thousands of incidences of a child exposure. Exposure to community violence can have a traumatic impact, especially for children. This makes it critical to consider where homicides occur in the city, and how close they are to communities where more children tend to live.
About the data
Data for this analysis came from Open Data DC:
- Census Blocks in 2020
- Census Tracts in 2020
- Crime Incidents in 2021 14
- Quadrants
- Public Schools
- Charter Schools
Analysis was performed by the author. Proximity analysis was performed at the census block level, the most granular level of Census administrative geography. The maps include census tracts to provide visual neighborhood context to the map reader. Population and children data came from the Census Blocks in 2020 dataset provided by Open Data DC which contained data from the 2020 Decennial Census.
Endnotes
- For more information, see The National Child Traumatic Stress Network: https://www.nctsn.org/what-is-child-trauma/about-child-trauma
- Kneeshaw-Price, et al. (2015). Neighborhood Crime-Related Safety and Its Relation to Children’s Physical Activity. Urban Health 92(3): 472-489. doi: 10.1007/s11524-015-9949-0.
- Mayne, et al. (2018). Longitudinal associations of neighborhood crime and perceived safety with blood pressure: the multi-ethnic study of atherosclerosis (mesa). American Journal of Hypertension 31(9): 1,024-1,032. https://doi.org/10.1093/ajh/hpy066.
- Lorenc et al. (2012) Crime, fear of crime, environment, and mental health and wellbeing: Mapping review of theories and causal pathways. Health & Place 18(4): 757-765. https://doi.org/10.1016/j.healthplace.2012.04.001
- Baryani, et al. (2021). The impact of neighbourhood crime on mental health: A systematic review and meta-analysis. Social Science & Medicine 282. https://doi.org/10.1016/j.socscimed.2021.114106
- Miliam, A.J., C.D.M. Furr-Holden, & P.J. Leaf. (2010). Perceived school and neighborhood safety, neighborhood violence and academic achievement in urban school children. The Urban Review 42: 458-467 https://doi.org/10.1007/s11256-010-0165-7
- Mayne, et al. (2018). Longitudinal associations of neighborhood crime and perceived safety with blood pressure: the multi-ethnic study of atherosclerosis (mesa). American Journal of Hypertension 31(9): 1,024-1,032. https://doi.org/10.1093/ajh/hpy066.
- Parents Amplifying Voices in Education (PAVE). 2022. PAVE 2021 End of the School Year Parent Survey Report. https://dcpave.org/school-leader-covid-19-impact-survey-april-2020/summer-2021-pave-end-of-year-parent-survey-report/
- Smith, J., and Patton, D.U. (2016) Posttraumatic Stress Symptoms in Context: Examining Trauma Responses to Violent Exposures and Homicide Death Among Black Males in Urban Neighborhoods. American Journal of Orthopsychiatry 86 (2): 212–223. https://dx.doi.org/10.1037/ort0000101
- Lodge, et al. (2021). Estimating exposure to neighborhood crime by race and ethnicity for public health research. BMC Public Health 21: 1078. https://doi.org/10.1186/s12889-021-11057-4.
- Yunsoo, P. (2020). When students don’t feel safe in the neighborhood: How can schools help? D.C. Policy Center. https://www.dcpolicycenter.org/publications/mental-health-supports/
- Not all neighborhoods in Southeast D.C. that are east of the Anacostia River had such high levels of exposure. Neighborhoods along Pennsylvania Avenue like Penn Branch and Hillcrest had lower exposures.
- Luo, Wei and Fahui Wang. (2003). Measures of spatial accessibility to health care in a GIS Environment: Synthesis and a case study in the Chicago region. Environment and Planning 30 (6). https://doi.org/10.1068%2Fb29120
- There were 226 homicides in Washington, D.C. in 2021, however, the Crime Incidents in 2021 dataset contained only 224 homicides. Incomplete crime data in Washington, D.C. is a known issue. Ciruzzo, Chelsea and Cuneyt Dil. 2022. D.C. and Prince George’s County police submit incomplete 2021 crime data. Axios. https://www.axios.com/local/washington-dc/2022/06/14/dc-prince-georges-county-incomplete-2021-crime-data