While much of D.C.’s recent population boom has been driven by an influx of new residents, the overall number of children born in the District has also been rising since the early 2000s. However, the actual fertility rate among D.C. residents—the number of births per 1,000 women—was actually declining during much of the District’s population boom, and has been holding steady in recent years.
In 2005, the 5-year fertility rate for women ages 15-50 in D.C. was at 62 per 1,000, based on data from the American Community Survey, and fell to a low of 43 per 1,000 in 2008. Since then, overall fertility rates have declined slightly or held steady.[1]
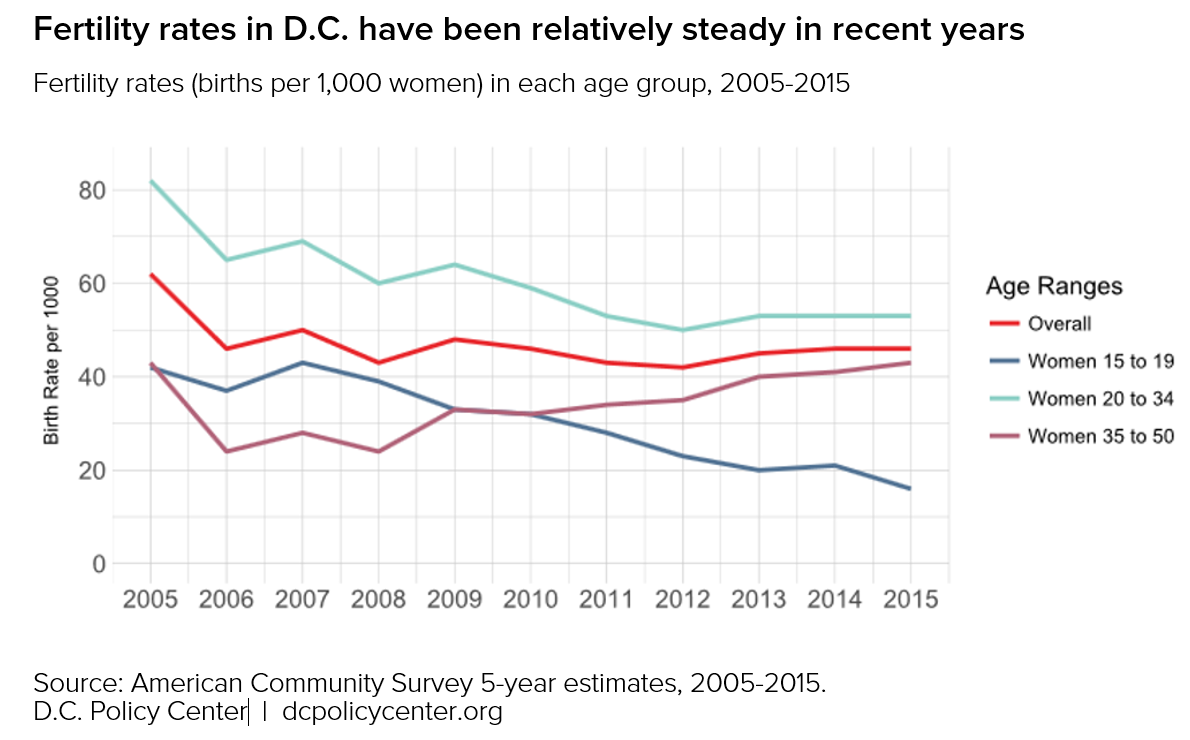
However, these trends have not been even across age groups. Women ages 35 to 50 have seen a steady rise in fertility rates, which have recovered to 2005 levels at 43 births per 1,000. Women ages 20 to 34 have for the most part mirrored the overall trend, keeping a relatively stable rate over the previous years, steadying at 53 births per 1,000 in 2015 (nearer to the national rate.) And the proportion of births among teens has dropped dramatically, now at 16 per 1,000 among young women ages 15 to 19.[2]
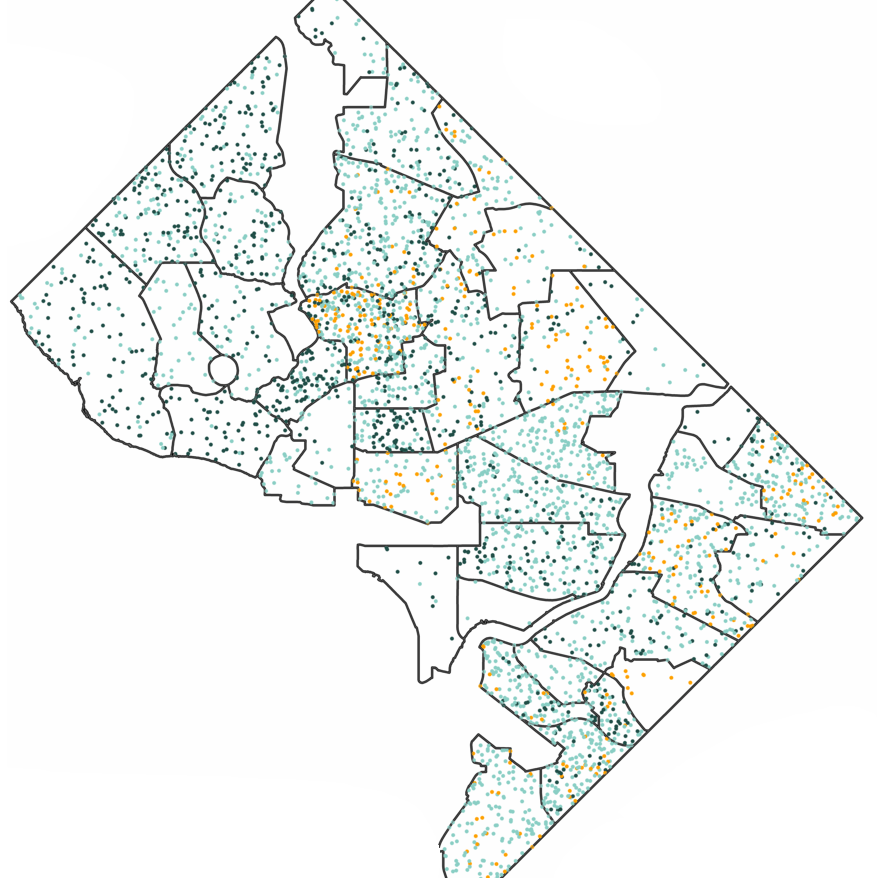
How birth patterns changed in D.C. between 2009-2015
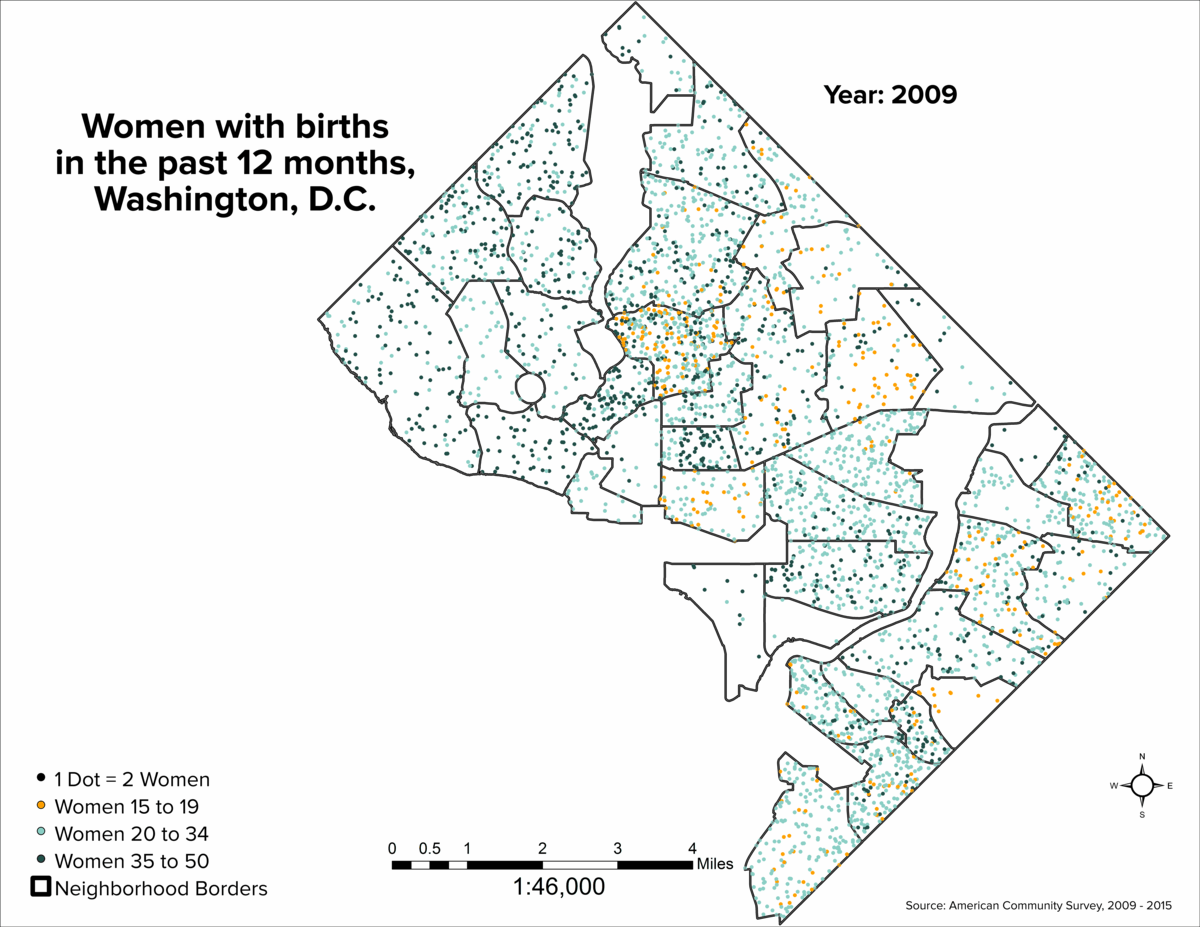
The animated map below shows the shifts in where women of each age groups are having children in D.C. from 2009 to 2015.
Note: In order to analyze changes in fertility rates within the city, this analysis uses 5-year estimates from the American Community Survey. These estimates therefore lag somewhat behind the actual annual fertility rates reported by the D.C. Department of Health in its natality reports.
Fertility rates in D.C. by neighborhood cluster, 2009-2015
View individual years on our datablog
D.C. Policy Center | dcpolicycenter.org
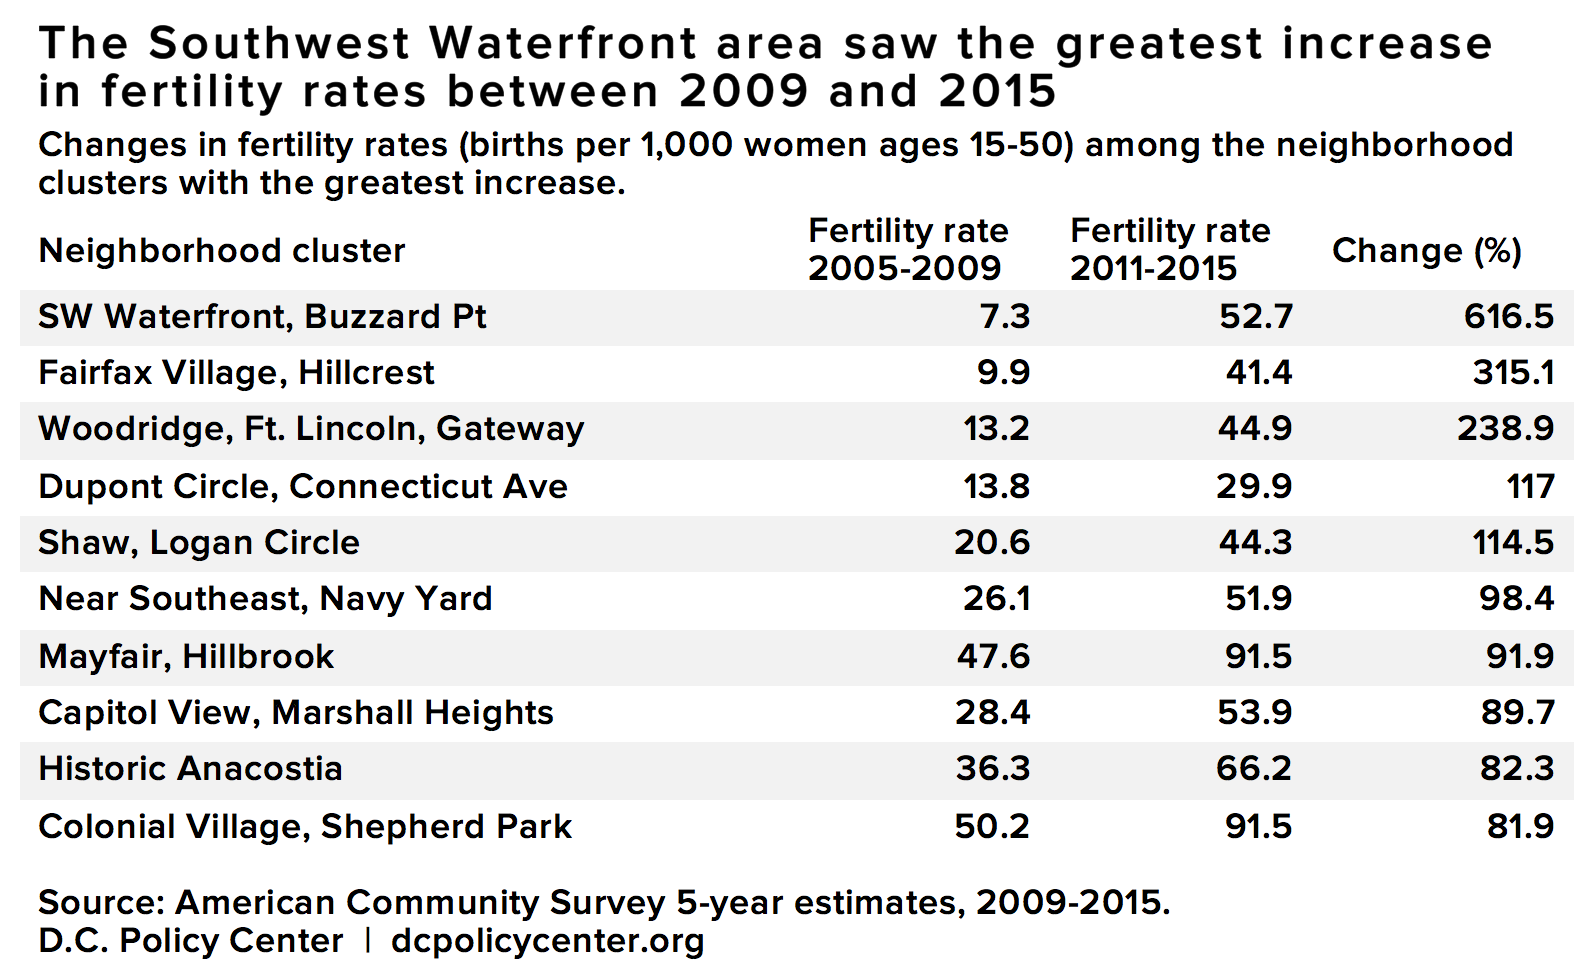
A few clear trends stand out immediately. Columbia Heights has seen a drastic shift from a large portion of births among teens ages 15 to 19 from 2009-2013 to almost none in that age group in 2014 and 2015. In addition, Mt. Pleasant has started to see saw a shift in births from women ages 20 to 34 to those ages 35 to 50. Another stark change is the increase in the number of births among women ages 35 to 50 in the Southwest Waterfront and Navy Yard neighborhoods; that area of the city also saw a large influx of residents—including younger residents ages 22 to 34—during this general time period. Among all neighborhoods in D.C., the Southwest Waterfront has had the most dramatic increase in fertility rates, from 7.3 births per 1,000 women in 2009 to 52.7 in 2015.
Declining rates in births among teens
One of the most positive recent trends was the city’s sharp decline in fertility rates among teens. There has been a 62 percent drop in the fertility rate of young women ages 15 to 19 since its highest point in 2007 to its 2015 level of 16 per 1,000.
Teen fertility rates have been falling across the country, and researchers are still exploring the causes. In an interview with the Washington Examiner, Jay Cooper, public policy director of the D.C. Campaign to Prevent Teen Pregnancy, noted that, “access to contraceptives, along with providing safe spaces for teenagers to ask questions about sexual health and providing better education and after-school activities, could be helping” to reduce the number of births to teens. In D.C., these changes also take place as the District is experiencing gentrification and displacement in many neighborhoods; as George Washington University professor Antwan Jones has noted, some portion of the reduction in D.C.’s teen fertility rates could also reflect changes in D.C.’s demographics as low-income families are pushed beyond its borders by rising rents and other pressures.
Infant mortality in the District
D.C.’s infant mortality rate has dropped significantly in recent years. As of 2014, the city reported 7.6 infant deaths per 1,000 live births, about half the rate of its most recent high of 13.1 in 2007. However, it is still somewhat above the national rate of 6.0.
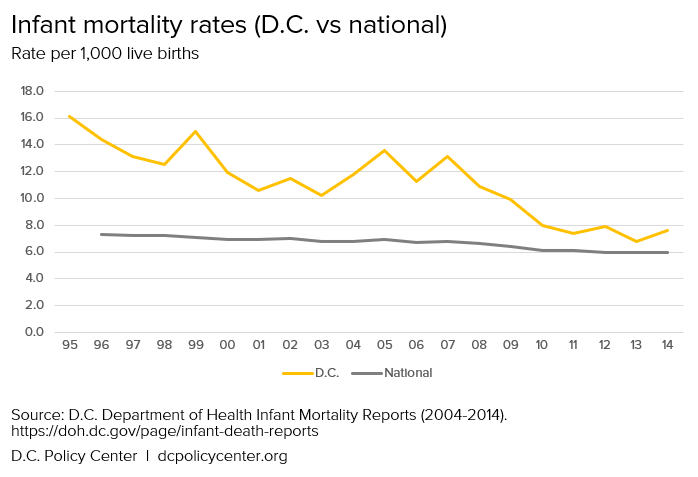
Even as the District’s overall infant mortality rate approaches the national level, rates can be much higher among different groups within the city. DOH data from 2014 shows that the infant mortality rate for black (non-Hispanic) residents is 10.5, more than three times the rate for white (non-Hispanic) infants (3.7).[3] And in 2015, the Washington Post reported that infants born to low income households are more than 10 times as likely to die as those born to high-income households.
Maternal mortality
Researchers at the University of Maryland found that maternal mortality is actually on the rise in the U.S., even as it has been declining elsewhere in the world. While state- or city-level data can be hard to come by, national data suggests that maternal mortality rates are much higher for black women (43.5 deaths per 100,000 live births) than for white women (12.7).
According to 2010-2014 data pulled from the CDC’s National Vital Statistics System by the United Health Foundation, D.C.’s maternal mortality rate was 40.7 per 100,000 live births, compared with 19.9 for the U.S. as a whole; in addition, the rates of pregnancy-related deaths for black women nationally are almost four times greater than for white women.[4] Maternal health in the District is under a spotlight after the closure of two local maternity wards this fall, leaving “a maternity care desert” on the eastern side of the city. The D.C. Council is currently considering legislation that would establish a Maternal Mortality Review Committee to focus on the issue.
Notes
[1] These data are based on author’s calculation of ACS 5-year estimates among women ages 15-50; CDC fertility rates are reported for women ages 15-44, and therefore are expected to differ from the data in this piece. Among women ages 15-44, the CDC data shows that D.C.’s fertility rate was 52.8 as of 2015, compared with 62.5 nationally.
[2] In order to analyze changes in fertility rates within the city, this analysis uses 5-year estimates from the American Community Survey. These estimates therefore lag somewhat behind the actual annual fertility rates reported by the D.C. Department of Health in its natality reports.
[3] Rates are for black (non-Hispanic) and white (non-Hispanic) infants in 2014. The infant mortality rate for Hispanic infants (of any race) was 4.7. https://doh.dc.gov/sites/default/files/dc/sites/doh/publication/attachments/IMR_2014_Edits_6.19.17.pdf
[4] “Number of deaths from any cause related to or aggravated by pregnancy or its management (excluding accidental or incidental causes) during pregnancy and childbirth or within 42 days of termination of pregnancy, irrespective of the duration and site of the pregnancy, per 100,000 births.”
About the data
Fertility demographic data is from the U.S. Census Bureau’s , unless otherwise noted. Complete code for the analysis and visuals is available on my GitHub page.
D.C. Policy Center Senior Fellow Randy Smith is a Geographic Information Systems (GIS) Specialist, and has an MSc in Geospatial and Mapping Science from the University of Glasgow. He has a passion for maps, baking, and running. He lives in Tenleytown with his wife. For more about his current projects, visit www.rhsmithjr.com.