The recent D.C. Policy Center report, Access to schools that level the playing field for D.C.’s at-risk students, examined where in the city at-risk students have the shortest commutes to “leveler schools”—schools with the very highest growth for at-risk students.[1] About a third of the population under 18 lives within a typical commute on public transit (14 minutes for elementary school students, and 20 minutes for middle school students) to a leveler elementary and a leveler middle school. Out of 24 neighborhood clusters with higher concentrations of at-risk students, 10 lack easy access to leveler elementary schools and eight lack easy access to leveler middle schools if students are commuting to school via public transit.
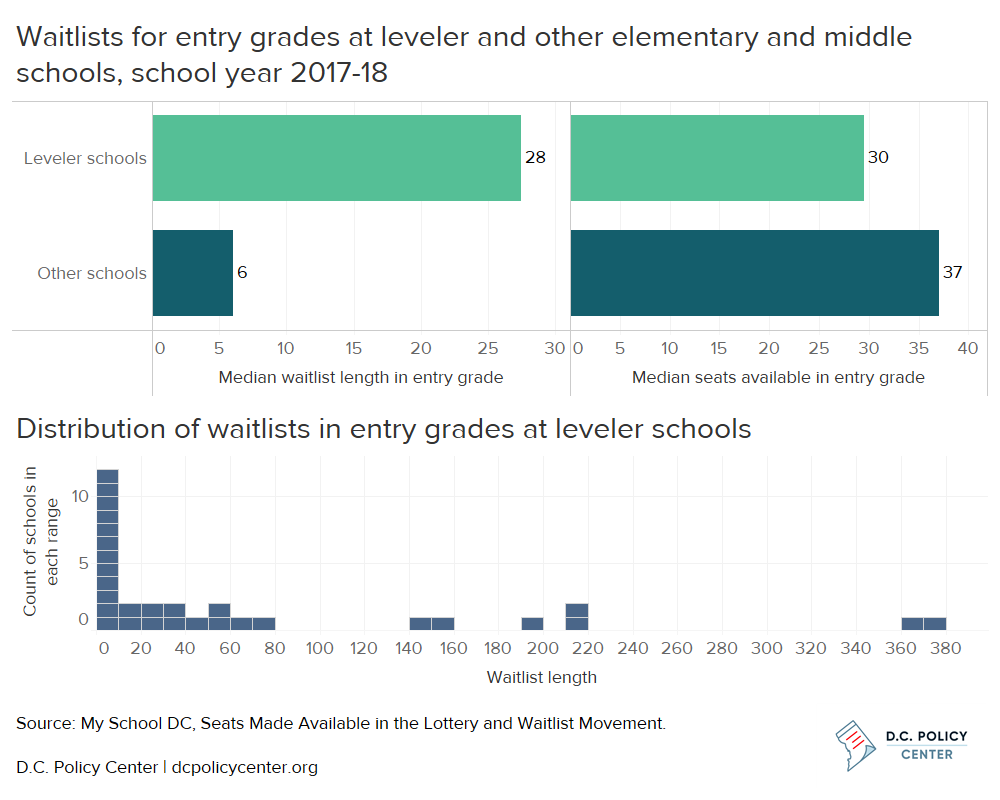
While geographical proximity is a critical factor influencing school choice, it is not the only measure of access to schools. Before students tackle a potentially difficult commute, they must be able to enroll—a process that can be made less certain by long waitlists at some leveler schools. The median waitlist in an entry grade at a leveler schools has 28 students, compared to six at other elementary and middle schools.
Within the D.C. public school system, students have a guaranteed kindergarten through grade 12 spot at a school if it is their in-boundary school; if their target school is not their in-boundary school or if they are in pre-kindergarten, they must apply through the city’s common lottery. On average, leveler schools do have room for out-of-boundary students, who make up about 45 percent of their enrollment. However, waitlists at leveler schools tend to be longer than those at other schools, and leveler schools are less likely to completely clear their waitlists by fall than other elementary and middle schools.
In-boundary enrollment does not limit access to leveler schools in most cases
If students wish to attend a leveler school, they have a guaranteed spot at the 18 DCPS leveler elementary and middle schools aside from pre-kindergarten grades if they live within a school’s boundary.[2] Otherwise, they can apply through D.C.’s common lottery to attend one of the DCPS leveler schools as an out-of-boundary student or to attend one of the 14 public charter leveler schools.
Across DCPS leveler schools, in-boundary students comprise 55 percent of students, which varies from 27 percent at Hardy Middle School to 84 percent at Maury Elementary School. This leaves some room for out-of-boundary students: while the numbers vary from school to school, overall, about 45 percent of seats at DCPS leveler schools are available to out-of-boundary students. This is the same as the average percentage of seats at other DCPS elementary and middle schools that are available to out-of-boundary students. Spaces at DCPS leveler schools are not limited to students living within their boundaries, which allows out-of-boundary students to enroll at them just as easily as they would at other schools.
Waitlists at leveler schools tend to be longer than those at other schools
The number of students on a waitlist gives an indication of how many students would like to attend a particular school but were not matched initially to the school because all available spaces had been filled. Waitlists in entry grades are the most informative as the length of the waitlist only in the school’s entry grade corrects for school size (a school that offers three grades is likely to have a lower total waitlist than a school that offers eight grades, for example).[3] Entry grades are also the most common transfer point to a school.
Across all elementary and middle schools, 20 percent do not have any students on their waitlists in the spring, and an additional 32 percent have waitlists with fewer than 10 names in their entry grade. On the other hand, some waitlists are prohibitively high: another 26 percent of elementary and middle schools have waitlists with more than 100 students. Data show median waitlists of 28 names at leveler schools compared to 6 names at other elementary and middle schools. That is, students are more likely to be waitlisted (and not matched initially) at leveler schools. At leveler schools, waitlists in entry grades range from no students to over 350 students at Marie Reed ES and DC Bilingual PCS. Three leveler schools had no students on their waitlists, and an additional nine leveler schools had fewer than 10 names. Leveler schools also tend to offer fewer seats in their entry grades.


Leveler schools tend to have more students who remain on waitlists
Students who are on waitlists instead of matching to their top choice at the time of the lottery may receive an offer at a later date, depending on other students’ enrollment decisions. If a student who got a spot through the lottery decides to attend another school, this spot is offered to the first student on the waitlist. The number of offers made to those on waitlists shows a student’s chances of getting a spot at a particular school even if they don’t initially match.
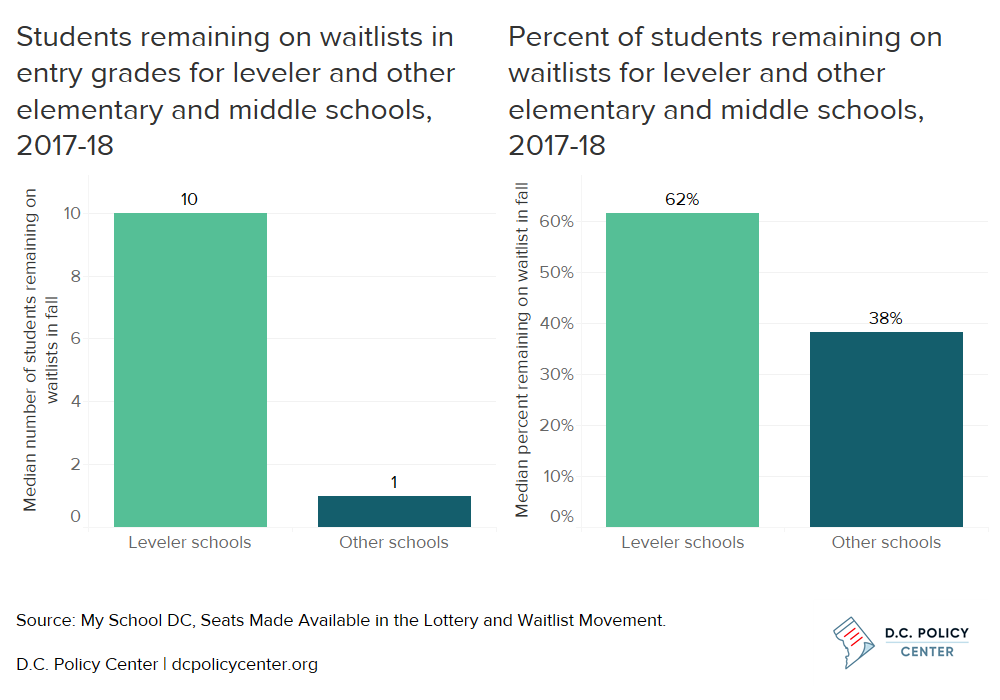
Given the length of waitlists and the number of offers made to students, more students remain on waitlists by the fall at leveler schools (10 students at a typical leveler school compared to one student at other elementary and middle schools). This means that 62 percent of students on waitlists at leveler schools do not receive an offer by October, compared to 38 percent of students at other elementary and middle schools. Put another way, almost half (49 percent) of other elementary and middle schools completely clear their waitlists by October, compared to 37 percent of leveler schools. This makes leveler schools less of a sure bet if students don’t match initially.


Waitlists are higher at schools with better growth for all students, but the story isn’t clear for at-risk students
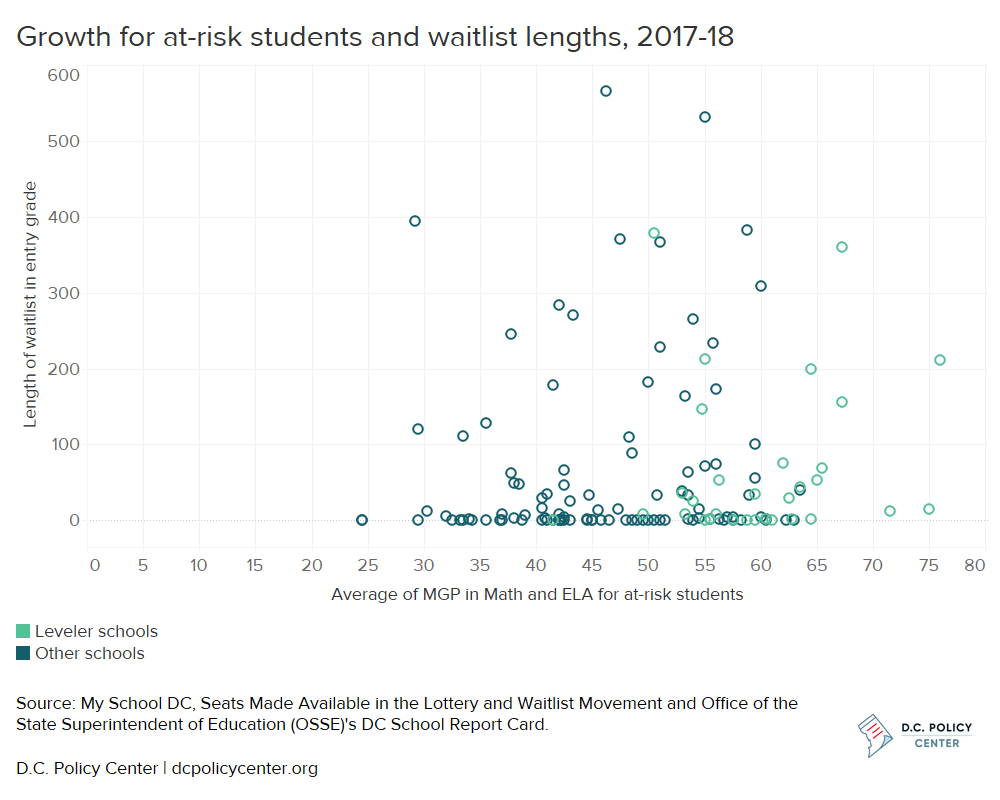
A study of applications to D.C.’s common lottery revealed that families use distance to school, school demographics, and academics as key factors when making decisions about where to attend school. Looking at growth for all students and comparing it to waitlists for all students, it appears that families are more likely to apply to schools with higher growth in learning outcomes. There is a significant relationship[4] between length of waitlists and growth in test scores as measured by Median Growth Percentile (MGP)[5] for all students, and the two are moderately correlated.[6]


It appears that students and families are applying at higher rates to schools that have higher growth for all students, but it isn’t possible to say the same for at-risk students. First, at-risk students make up 47 percent of all students, so waitlists for all students wouldn’t be expected to reflect demand for high growth of scores for only at-risk students. In other words, waitlists reflect all students’ preferences, while growth for at-risk students may be more relevant for students who are at-risk. In addition, at-risk students are less likely to participate in the common lottery: according to a My School DC study they make up approximately 35 percent of lottery applicants, 12 percentage points lower than all students. Thus, low participation in the lottery among families of at-risk students further reduces the observed importance of academic growth metrics for at-risk students. Availability of data on waitlists only for at-risk students would allow for a more targeted analysis.
Using academic growth to make school decisions
In school year 2017-18, about 5,800 at-risk students attended the leveler schools that boasted the highest growth for at-risk students. At leveler schools, at-risk students comprised 46 percent of students, similar to their representation across the city. If at-risk students enrolled at the schools that serve them the very best in higher numbers, one would expect higher percentages of at-risk students at leveler schools. However, some factors like commutes to school, as examined in Access to schools that level the playing field, can limit enrollment of at-risk students at leveler schools. As this piece shows, access to leveler schools may also be restricted by long waitlists or limited to students living within a certain DCPS school boundary.
On average, leveler DCPS schools are open to students living both within and outside of their boundaries just as other schools are. However, waitlist lengths and offers to students on waitlists show that it can be somewhat more difficult for students to get a spot at a leveler school through the common lottery. Encouraging families to look at outcomes by subgroups like at-risk (or Special Education and English Learners) could provide a key data point and perhaps target applications to schools that are more likely to improve their scores. A more specific analysis of growth and waitlists only for at-risk students would shed light on their current preferences.
Chelsea Coffin is the Director of the Education Policy Initiative at the D.C. Policy Center.
Feature photo from the U.S. Department of Education shadowing teachers at D.C. Bilingual PCS in Washington D.C. courtesy of the U.S. Department of Education (Source).
Notes
[1] Instead of looking at a school’s overall STAR school quality rating, the report focused on growth in test scores for at-risk students as its metric, identifying elementary and middle schools as leveler schools if they met the ambitious target for at-risk students’ growth target on the state report card.
[2] Only one of the DCPS leveler elementary schools (Aiton ES) is an Early Action school that guarantees enrollment to students in pre-kindergarten grades.
[3] Waitlist data for 2017-18 are not available for closed schools and schools that do not participate in the lottery (nine schools out of 212).
[4] Significant at the 99 percent level with p-value less than 0.01.
[5] On D.C.’s school report card, growth in test scores is measured by the Median Growth Percentile (MGP), the typical growth for individual students compared to academically similar students in the previous year. For elementary schools, growth scores are only available for students in grades 4 and 5 with a PARCC score in the previous year.
[6] Correlation coefficient of 0.4.
