For the past several years, Mapping Segregation in Washington DC has been documenting the historic role of real estate developers, citizens associations (white homeowner groups), and the courts in segregating the city. Our work has been focused on documenting properties subject to racially restrictive deed covenants, which barred the sale or rental of housing to African Americans. Racial covenants often applied to other groups—most commonly to Jews, in D.C.—but they always listed black people among those who must be excluded. Once a deed was signed, covenants were legally binding, and as we have described on our website and elsewhere, neighbors frequently used the courts to enforce racial covenants. They came into wide use around 1900, as new subdivisions developed north of Florida Avenue and east of the Anacostia River, and remained in use until the Supreme Court ruled them unenforceable in 1948. Prior to the advent of zoning here in 1920, covenants also served to regulate land use more generally, stipulating, for example, that only single-family detached houses could be built, or that construction costs exceed a designated minimum amount.
The Home Owners’ Loan Corporation
During the period since we launched this project in 2014, the work of Ta-Nahesi Coates and Richard Rothstein, among others, as well as local exhibits throughout the country that are exploring the history and legacy of entrenched segregation, have brought increased attention to what Rothstein dubs “the forgotten history of how our government segregated America.”[1] The Home Owners’ Loan Corporation (HOLC) maps, made in 1935-1940 and geocoded at Mapping Inequality, provide the most dramatic visual example of this. Made for 239 American cities, these maps designate areas that black residents lived in or near as the riskiest for real estate investment, on a scale from A to D. Just as black people weren’t the only target of racial deed covenants but were always listed among those barred, HOLC used other factors to grade sections as D, or “hazardous,” but always used this designation for areas occupied by or close to where black residents lived. Although use of the term “redlining” to describe the denial of loans to such areas by banks and insurers predates widespread public knowledge of HOLC’s maps, the term has more recently come to be associated with HOLC’s use of the color red for D-grade “hazardous” areas
HOLC maps of Syracuse, Richmond, and Miami
Areas in red mark D-grade “hazardous” areas, which included any neighborhoods where black residents lived.


Source: National Archives
Notably, there is no such map for D.C. In fact, if there ever was one, it has been missing from the National Archives since at least 1977, when historian Kenneth T. Jackson gave the first annual Letitia Woods Brown Memorial Lecture for the Columbia Historical Society, now the Historical Society of Washington, D.C. The published version of this lecture was the basis for two key chapters in Jackson’s 1985 book Crabgrass Frontier, which first brought significant attention to the HOLC maps and their use of race as mechanism for valuing property. A footnote says that D.C. “is one of many areas for which [HOLC] Residential Security Maps…are missing.”[2] Planning scholar Amy Hillier has also noted D.C.’s absence from a list of cities for which the maps were produced. “It is not clear if HOLC chose not to survey Washington or if the survey results and maps simply were not preserved,” wrote Hillier in 2005.[3]
Hillier has argued that the HOLC maps were less influential—in part, because the maps were not distributed outside the federal government—than they were reflective of existing real estate practices and corresponding settlement patterns. These maps were not the source, she explains, but rather a product and federal endorsement of longstanding discriminatory practices. Hillier also noted that HOLC did not practice redlining itself, which has recently been confirmed by Todd Michney and LaDale Winling’s research showing that the agency underwrote mortgages for African Americans at a surprisingly high rate, almost in proportion to black homeownership.[4] Although Michney and Winling affirm that the HOLC maps reinforced the use of race as a determinant of property value, and that the agency’s lending practices upheld racial segregation by refinancing black-owned properties “in already-established centers of black residence,” they emphasize that the Federal Housing Administration and the Veterans Administration were “far guiltier of promoting housing inequality” during the first half of the 20th century.
The Federal Housing Administration
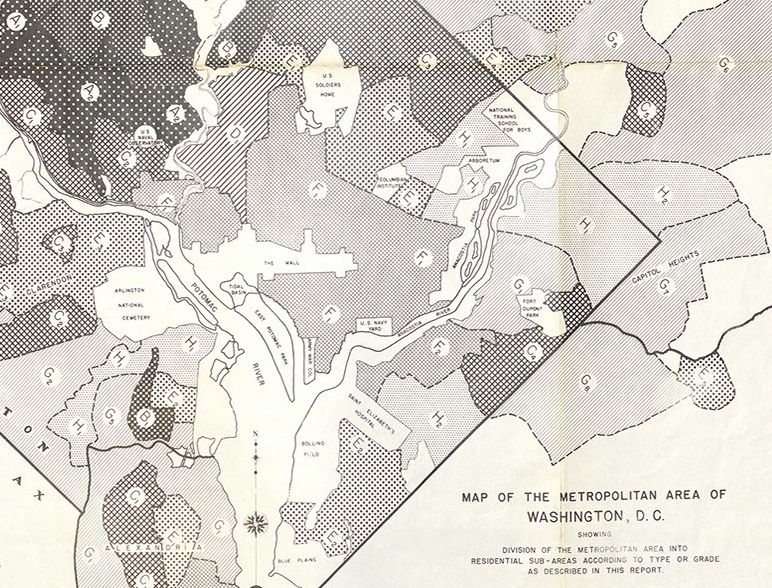
Established in 1934, the Federal Housing Administration (FHA) institutionalized racial exclusivity as a criterion for mortgage lending. Until 1950, the FHA’s underwriting manuals all but required the use of racial covenants for ensuring the future value of new housing. The FHA also produced maps like this one, showing the racial composition of every D.C. block in 1934, for at least 64 cities, and beginning in 1937, undertook a series of Housing Market Analyses resulting in this map of the D.C. metro area (below).[5]
Residential Sub-Areas, Federal Housing Administration (1937).
This map grades sections of D.C. and its suburbs, using race as a criterion. Click here for area descriptions, or view as a geocoded map overlay.
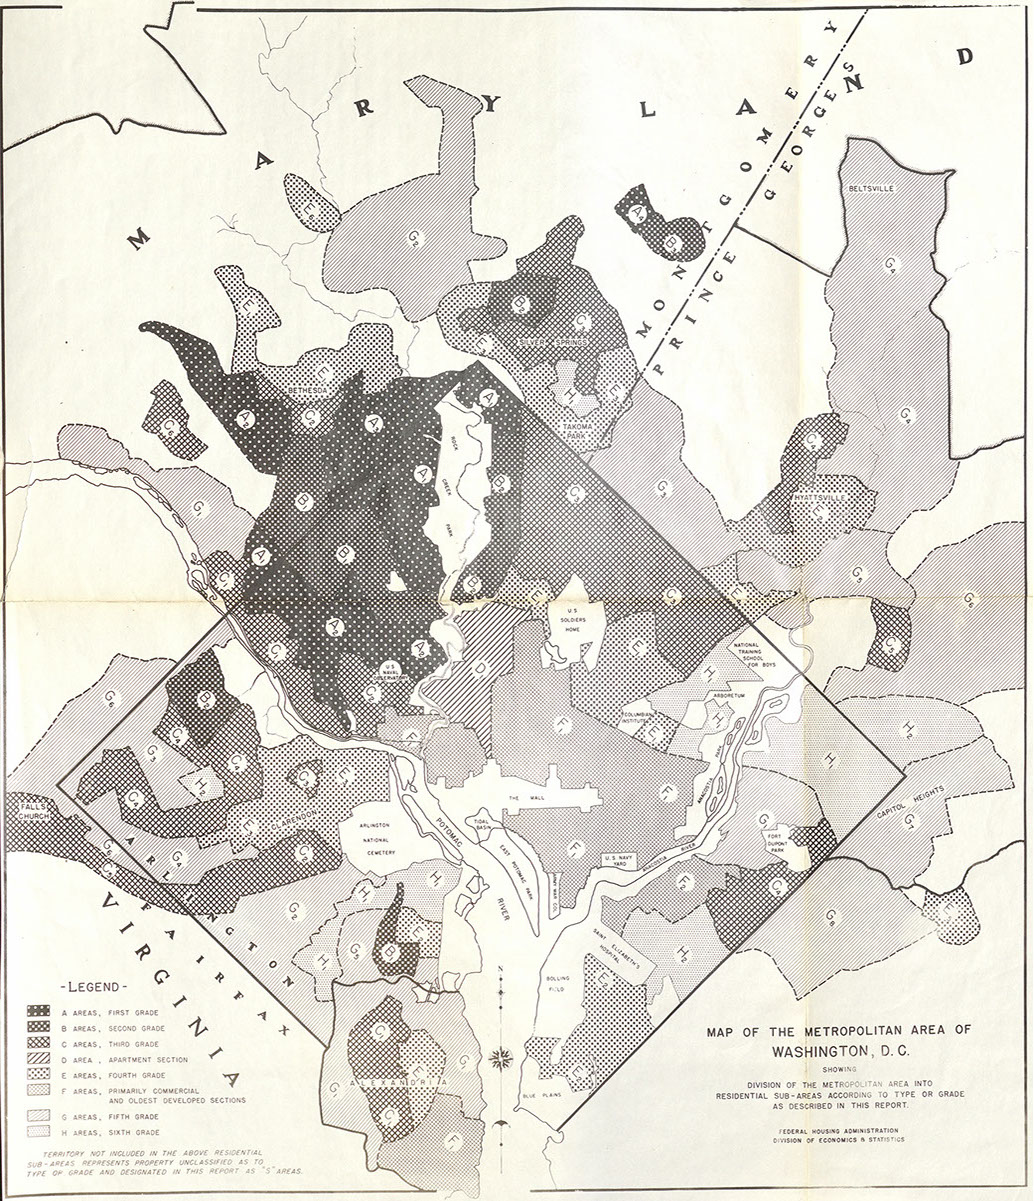
Source: National Archives (Mapping Segregation in Washington DC)
This map is not as visually dramatic as those produced by HOLC, but its grading system reveals the extent to which the FHA devalued blackness. Area descriptions accompanying the map explain the letter grades, and explicitly point to race as a criterion for investment in housing. Type F areas—Southwest, Capitol Hill, Foggy Bottom and Georgetown, and the blocks between 16th Street NW and North Capitol Street, all the way from the Mall to Park Road,
have lived their span of life as residential areas and are now declining into very undesirable sections….The areas are subject to commercial and industrial encroachment and the properties are no longer good residential investment…These areas house over three-fourths of the negroes in the metropolitan district and are showing the effects of negro occupancy…tending to become slums if they are not already.
Within five years of this map’s publication, the construction of Suitland Parkway and a massive public housing project displaced the F-graded historic Barry Farm community in Anacostia, which dated to 1867. The area encompassing the established black communities of Queen City and East Arlington, adjacent to Arlington National Cemetery, were assigned a grade of H. This applied to “negro developments and the lowest grade of residential area….The only possible future…is that the present scattered structures may be razed and new planned subdivisions instituted in their place.” In 1942, residents here were given less than a month’s notice that their neighborhood would be replaced with a parking lot and roads to serve the Pentagon.
Reports accompanying this map also make frequent reference to race:
Races other than white occupy 0.6 percent of the units in the A areas, and 63.2 percent of the units in the H areas.[6]
The Negro problem has not improved. In communities where there is any possibility of infiltration, application for insurance should be rejected.[7]
More than elsewhere the white family has been giving ground in the southeastern and northeastern sections of the city and in nearby Prince Georges County. If sufficient new quarters built at sufficiently low cost to be marketable to Negroes were built on vacant land in these sections, which are already dotted with Negro habitations, important sections of the District might be saved from “the rising tide of color.”[8]
On the whole…it can be said that supply of negro housing depends on the rate of obsolecense of white housing.[9]
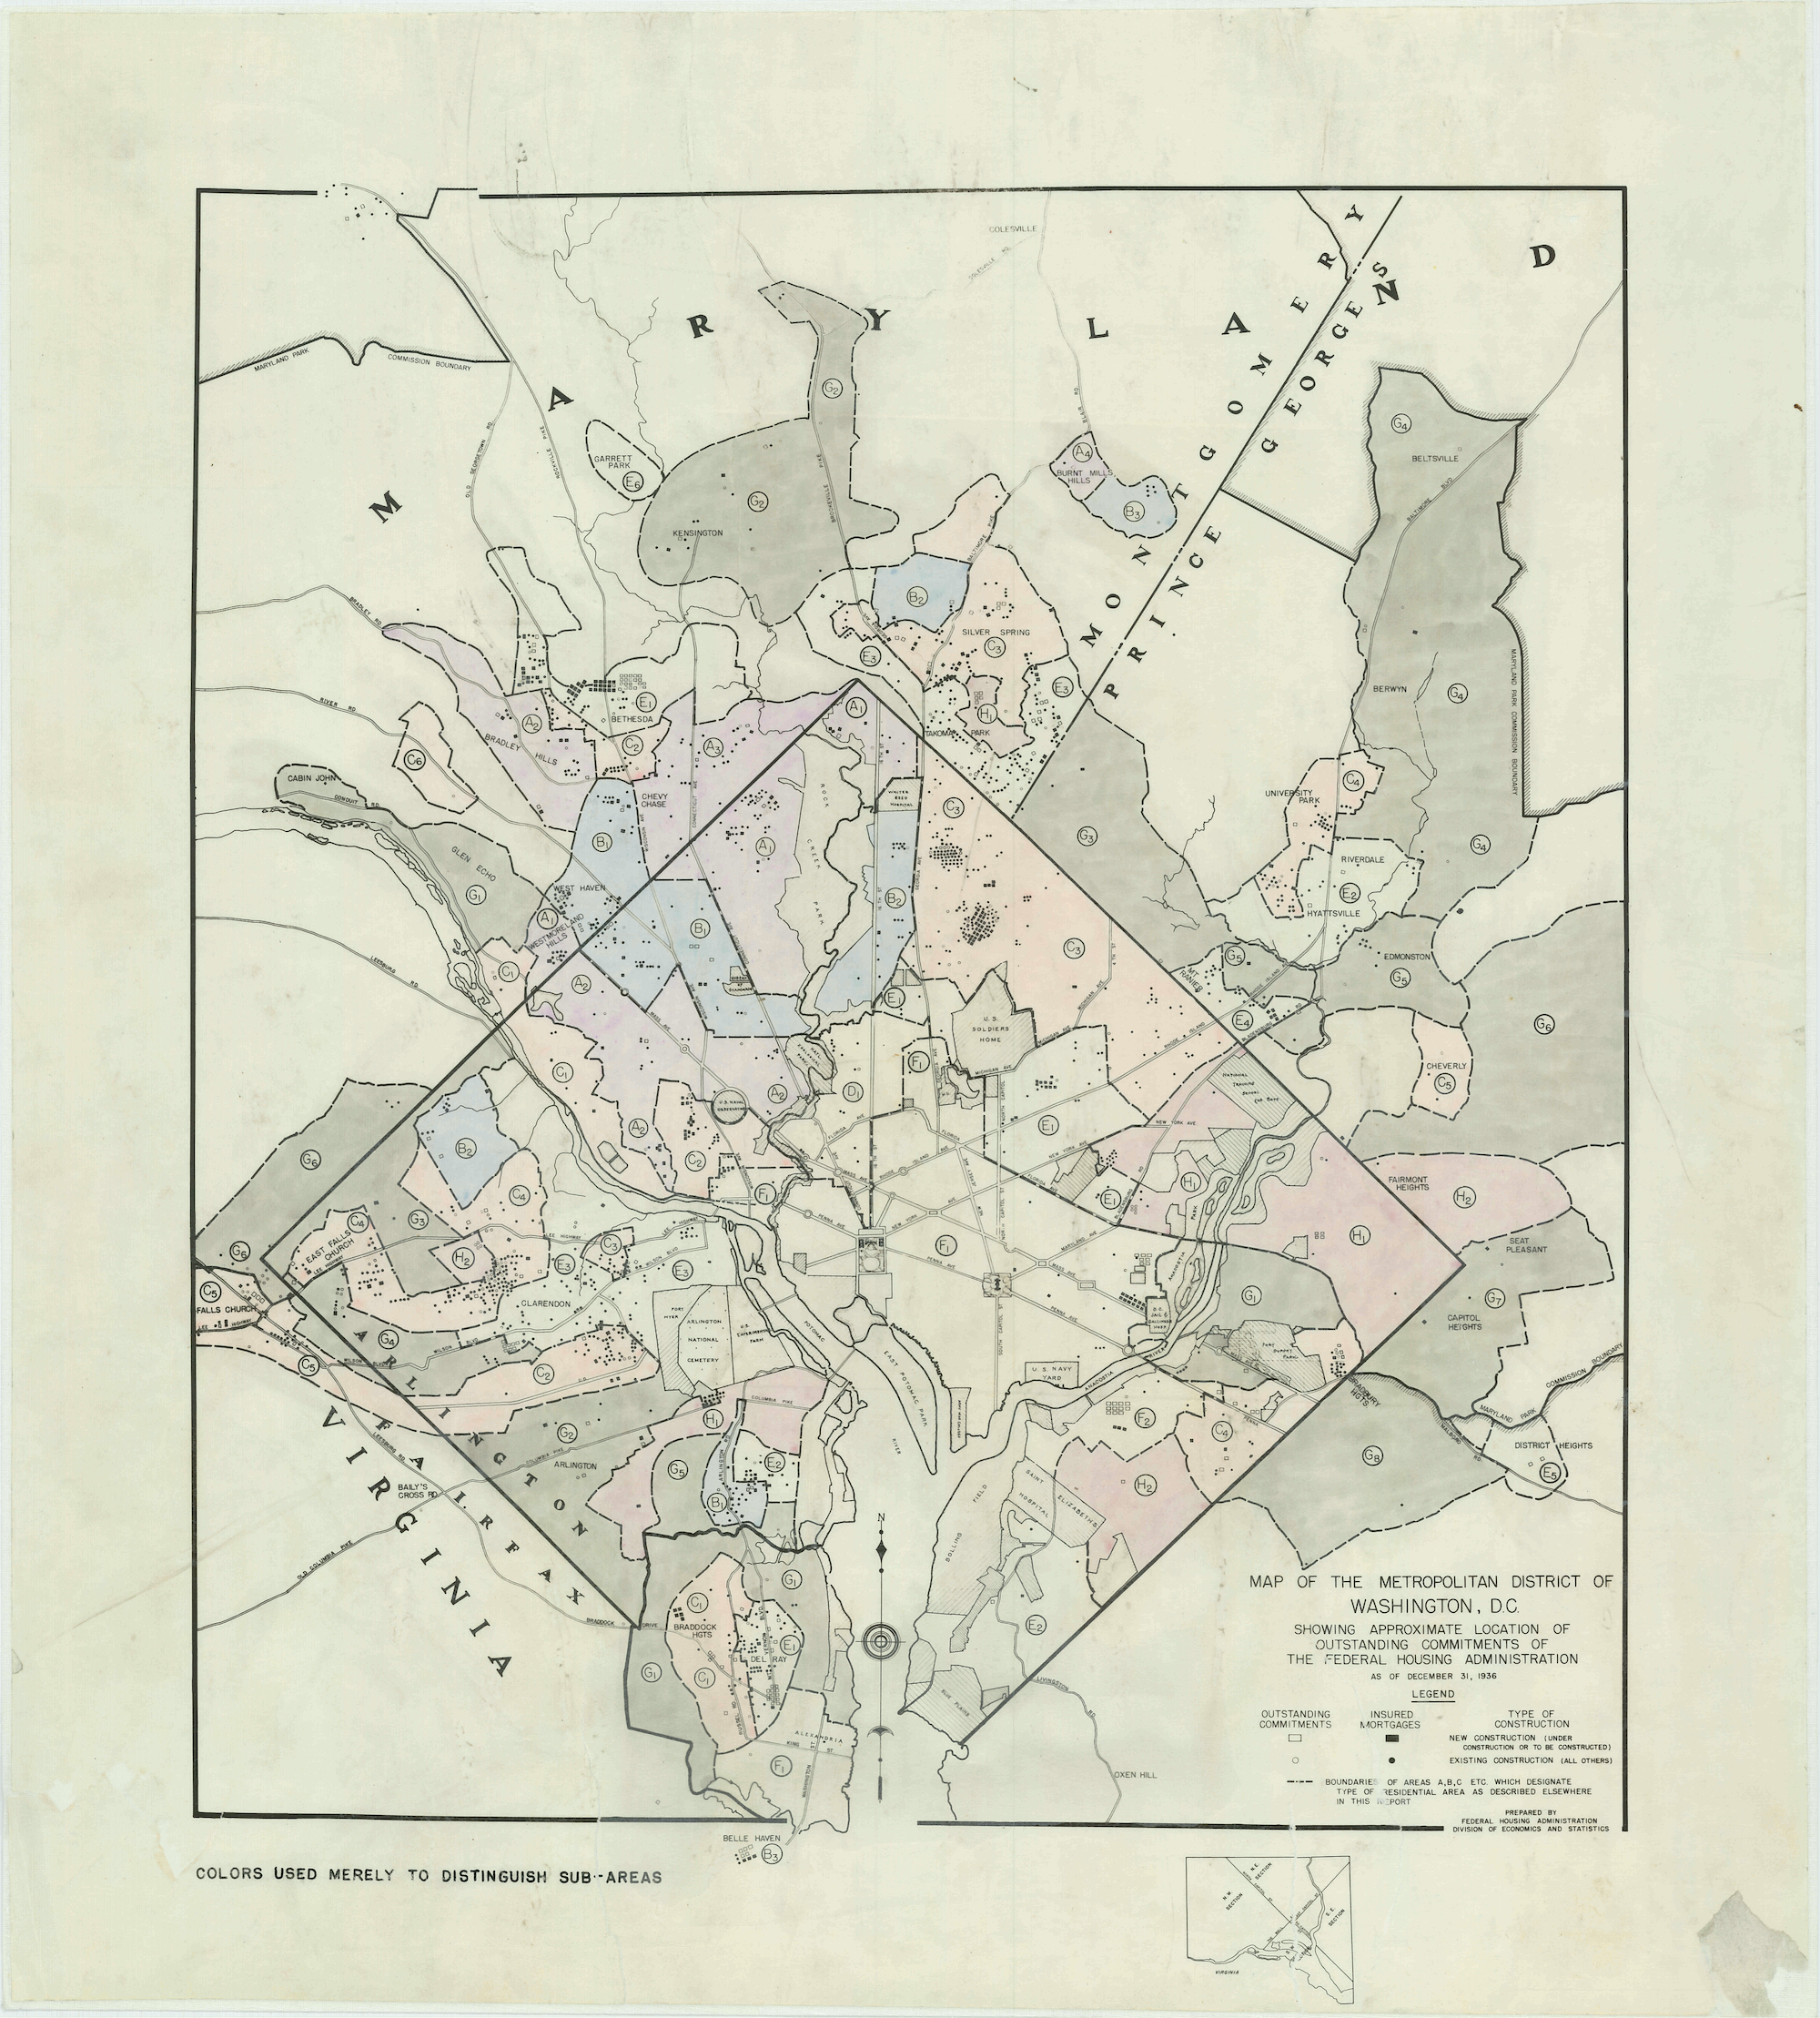
Maps and data showing where the FHA invested confirm the agency’s outsized role in supporting development in the city’s whitest neighborhoods; FHA-insured housing was concentrated west of Rock Creek Park and north of Missouri Avenue. A report on such housing built for African Americans in 1940-49—all of which were rental apartments in far northeast and southeast D.C.—lists a total of nine projects, or 1,807 units.[10] In 1949 alone, the FHA insured more than 12 times this number of units in the entire D.C. area.[11] The FHA (and the VA, beginning in 1944) also subsidized individual mortgages almost exclusively for white homebuyers, and denied loans for purchasing[12] or improving houses in neighborhoods deemed too black. Black homeowners received just 2.1% of all FHA/VA-backed mortgages, report LaDale and Winling, “with Washington, D.C., a longtime center of black homeownership, at the bottom of the list.”[13]
Reparations: Restoring Black wealth
Racialized lending policies worked in concert with restrictive deed covenants and exclusionary zoning both to concentrate white wealth and to shrink black access to land and capital. In D.C., decades of such practices, combined with the replacement of rural black enclaves with whites-only housing, led to the stark segregation revealed here:
Share of households that were nonwhite (1950)
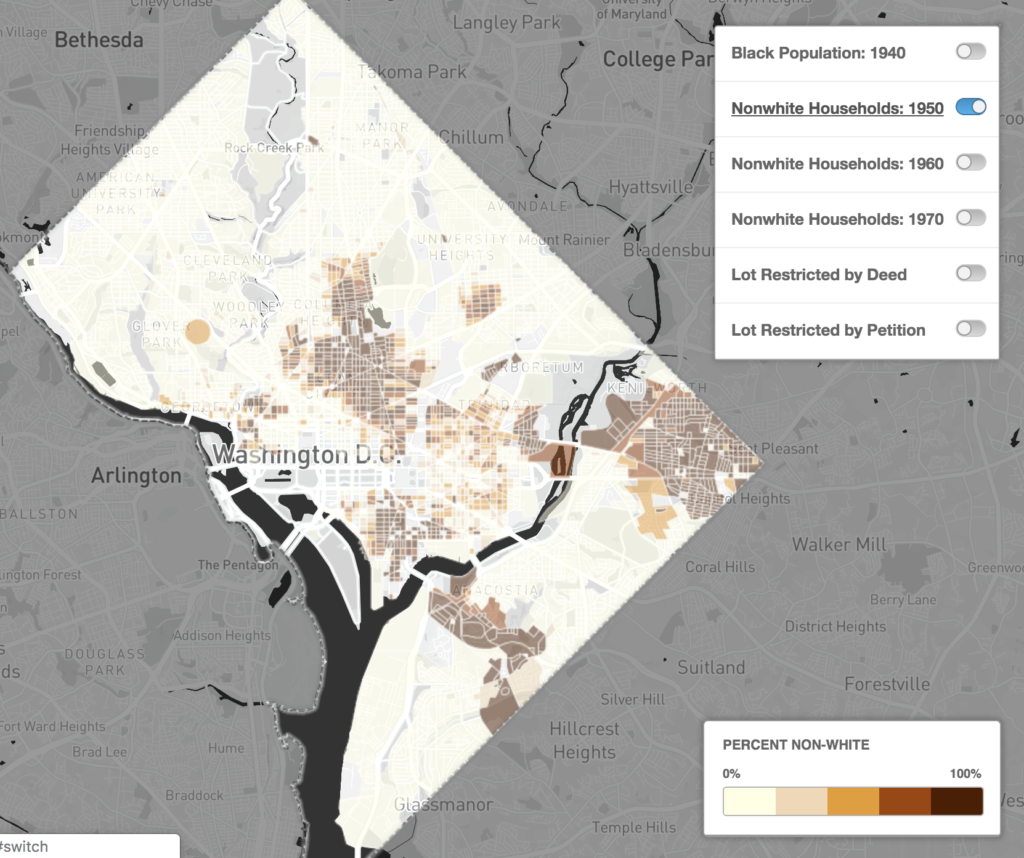
Source: Mapping Segregation in Washington DC
By the end of 1960, the value of FHA-insured property in majority-black D.C. came to less than a seventh of that insured in the white, suburban counties of Fairfax, Prince Georges and Montgomery.[14] Newly-launched maps of detailed, block-level Census data for the entire city (the data are also available for download)—show the entrenchment of racial segregation over the course of three decades after the FHA’s residential grading map was produced.[15]
Recognition of these discriminatory housing practices—including the publicly-financed displacement of black Washingtonians over the past two decades—should be an essential component of the Racial Equity Achieves Results legislation currently being considered by the D.C. Council. Restoring black wealth must be central to this conversation.
Update, 1/1/2020: Explore how the Federal Housing Administration shaped D.C. through a story map from Mapping Segregation in Washington DC.