
This year, Metrorail lost its position as the nation’s second-busiest mass transit system, with ridership numbers for 2016 and 2017 displaying consistent declines. While the Greater Washington region is not alone among American metropolitan areas in experiencing declines in transit utilization in recent years – in 2016, only Seattle, Houston, and Milwaukee posted net ridership gains greater than 1 percent – here the bleeding is occurring against the backdrop of a systemic state-of-good-repair crisis on its heavy rail rapid transit network. (Click here to see the ridership chart for the entire Metro system since 2000.)
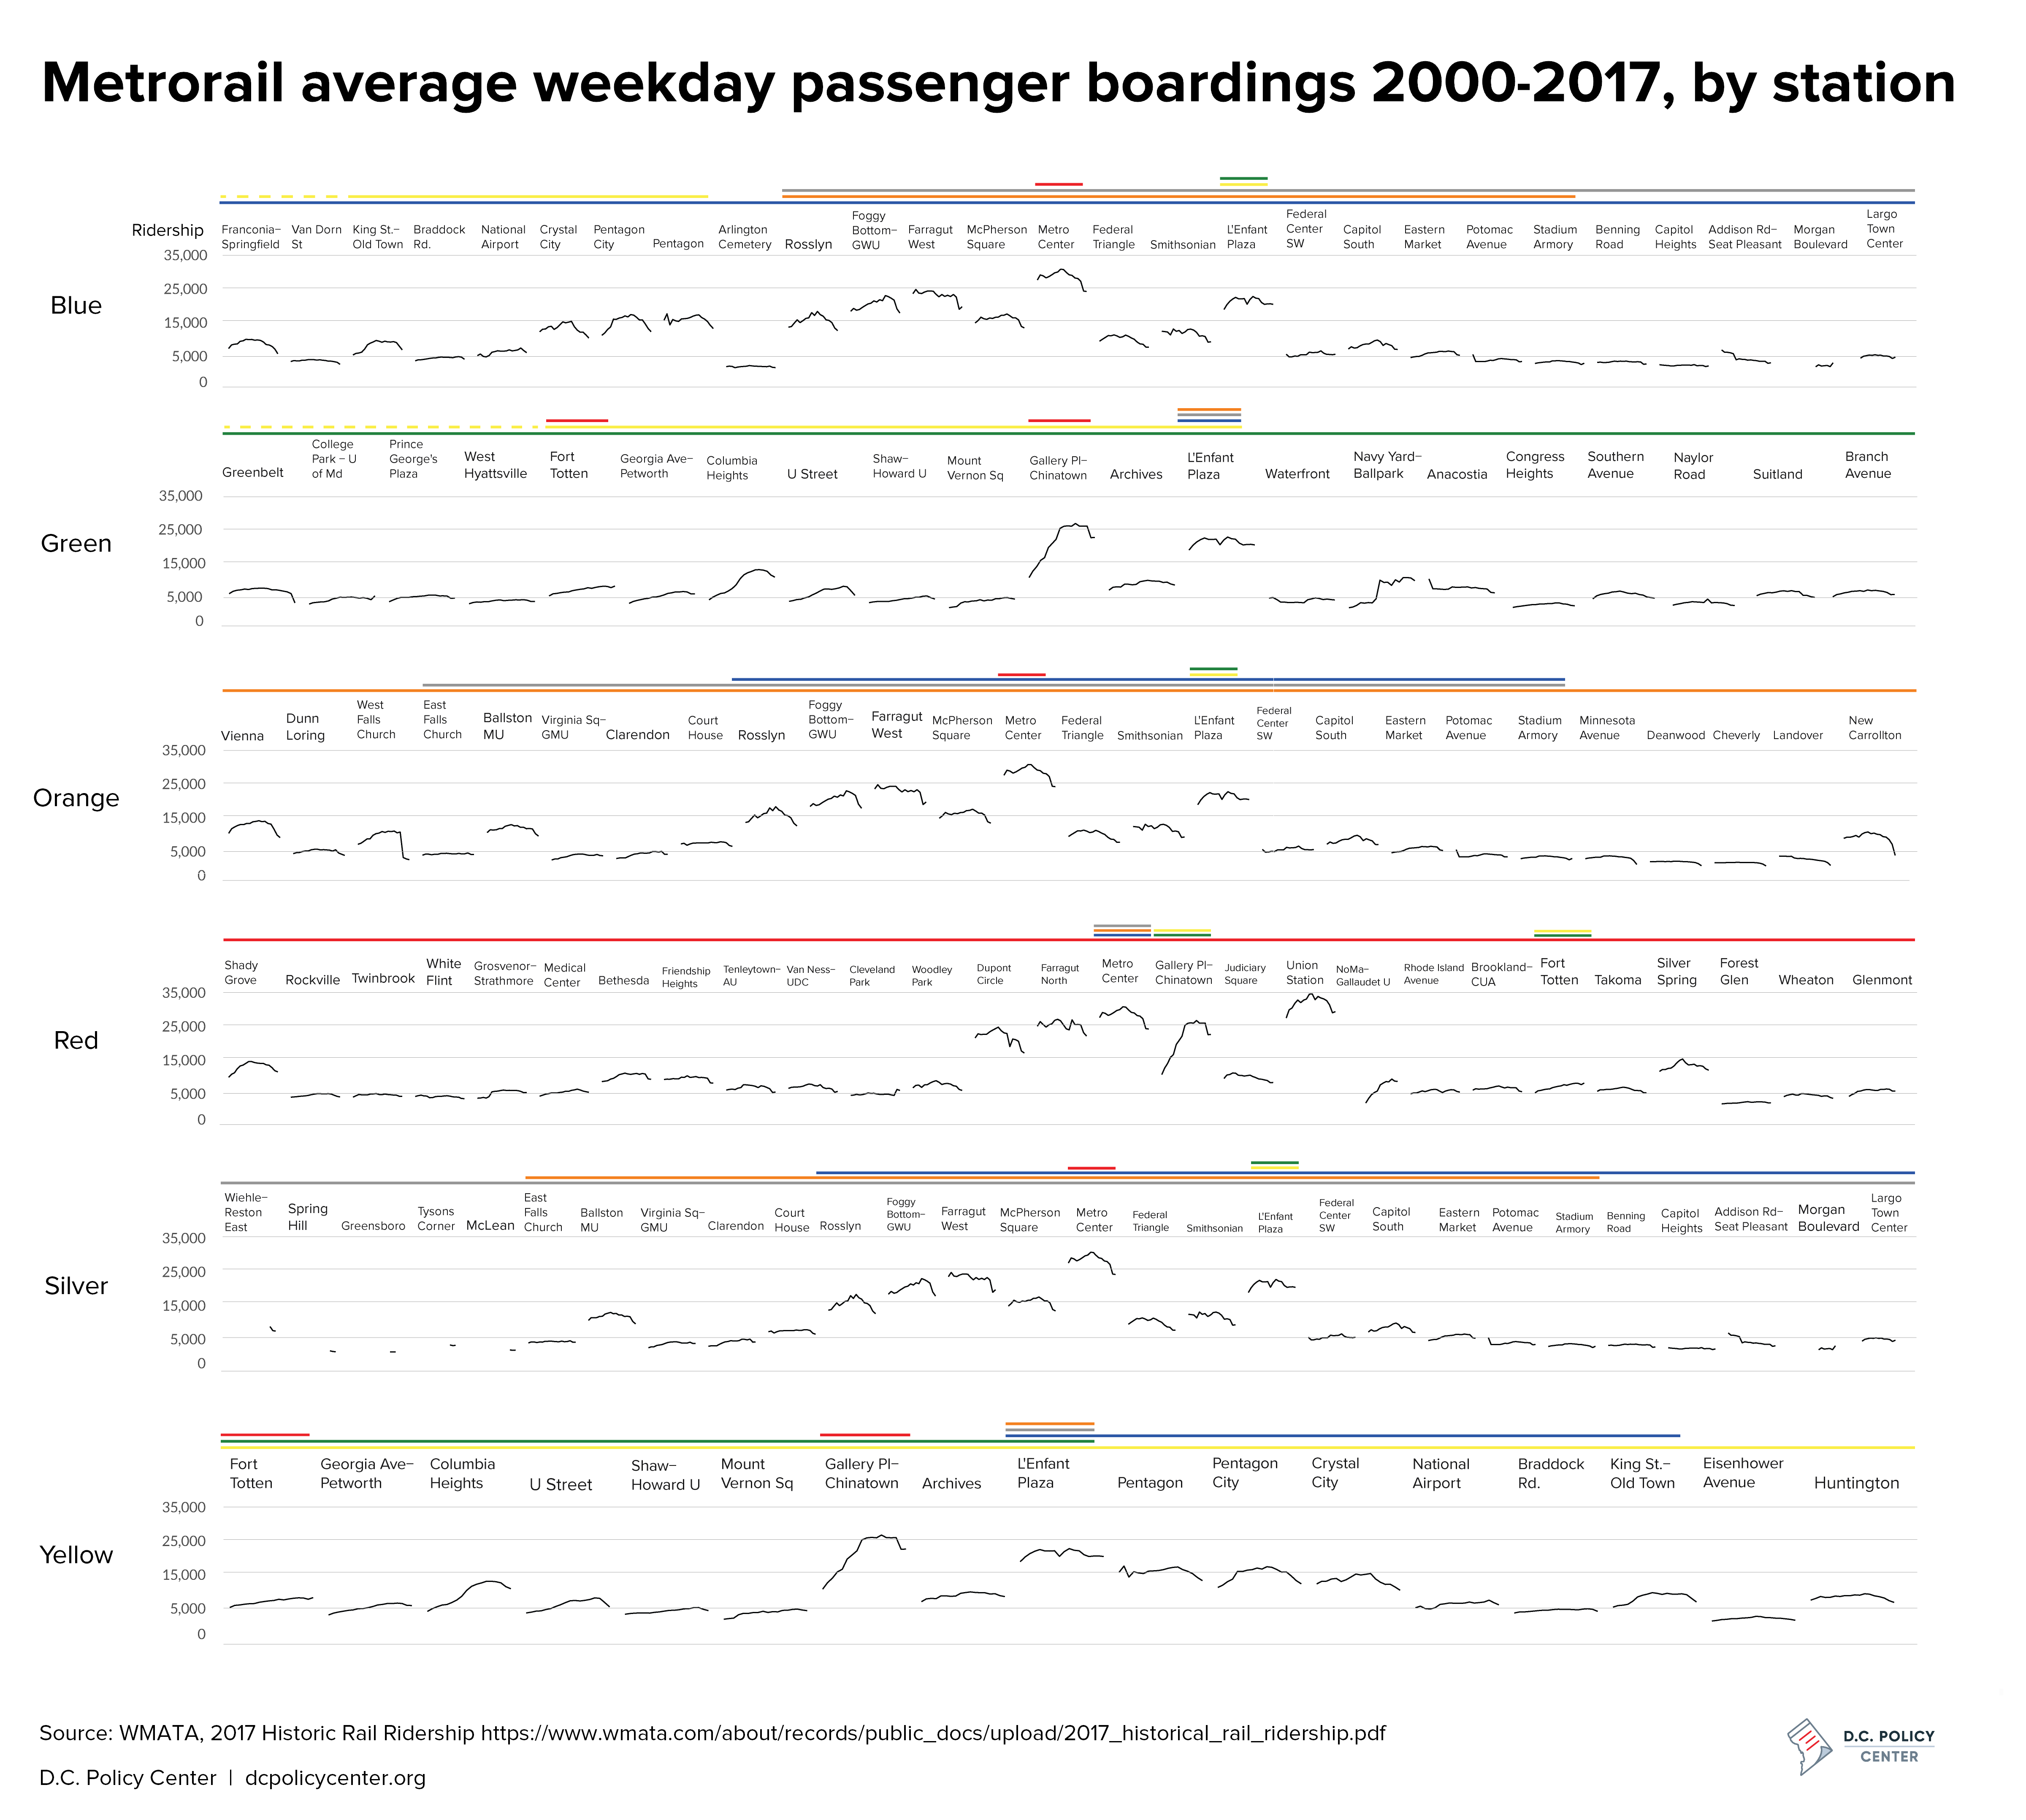
Click for larger image. Chart includes stations served by multiple lines.
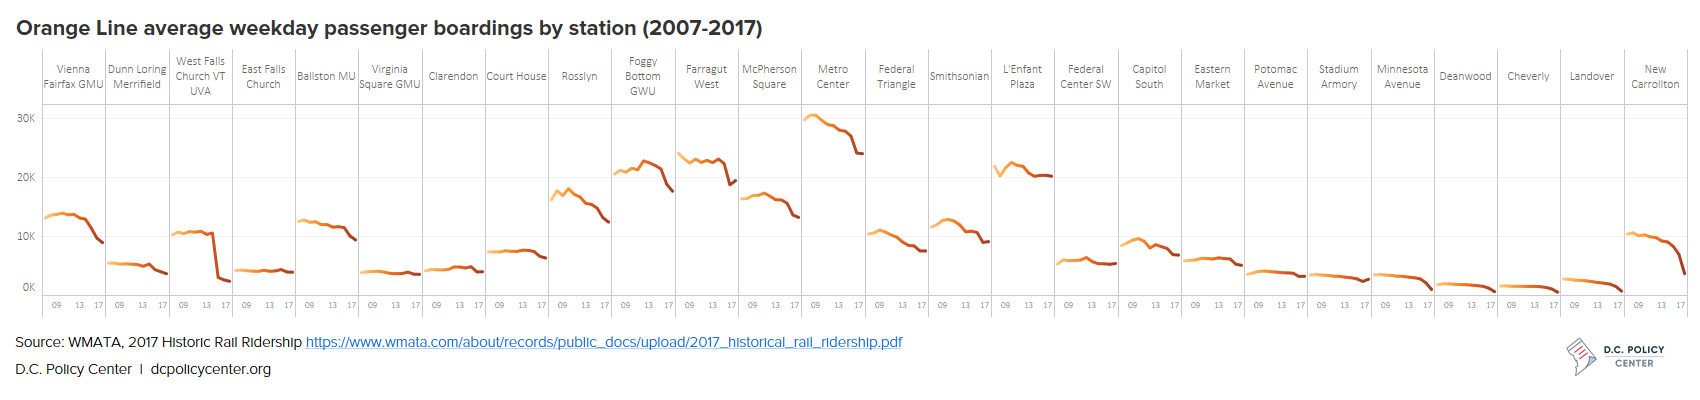
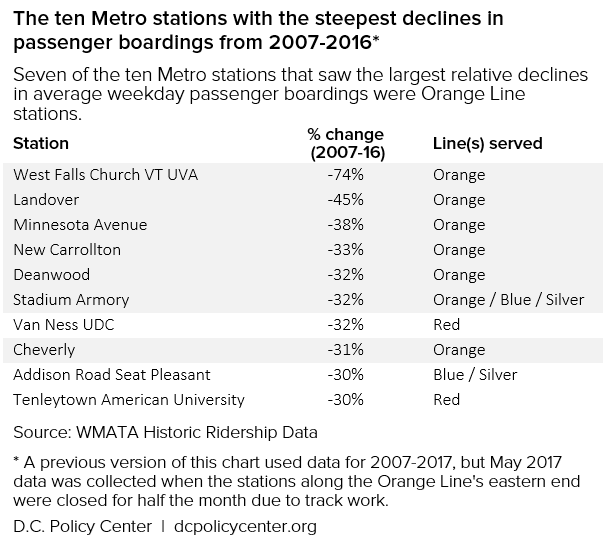
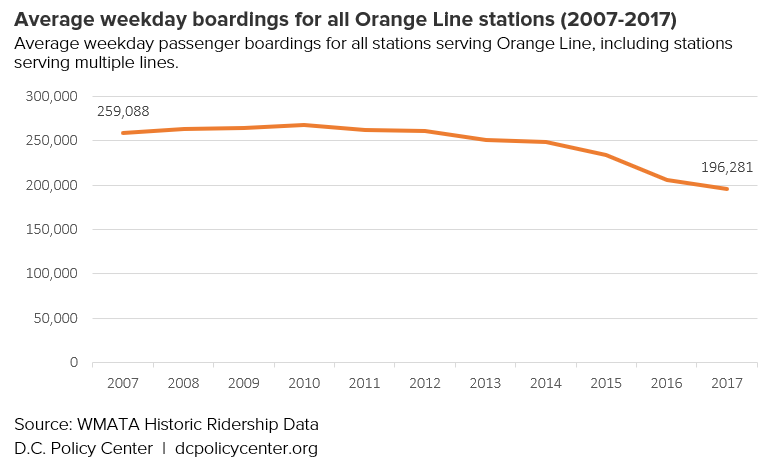
Focusing on passenger boardings over the past ten years reveals that the Orange Line, which connects the District with Arlington, Falls Church and Fairfax in Virginia, and Prince George’s County in Maryland, has been hit particularly hard. Between 2007 and 2016, each one of Orange Line stations sustained a decrease in average weekday passenger boardings, and among the top ten stations that have seen the largest relative declines across the system, seven are Orange Line stations. (Among the 27 stations along the Orange Line, eight are only served by the Orange Line.) These declines were more drastic for 2017, but this is likely because data for 2017 was collected in May, when the stations along the Orange Line’s eastern end were closed for half the month due to track work; this piece has been updated and corrected throughout to reflect this.
However, even though other lines, such the Red and Blue lines, have experienced significant on-time performance challenges—and the Red Line’s overall decline has been steeper—the stations on these corridors have not seen the same level of relative rider loss over the past decade. This suggests that other factors are contributing to the Orange Line’s particular crisis.
Given the problems facing Metro’s operations, poor performance is a possible explanation for why the Orange Line’s stations have suffered so drastically. In 2016, it had the worst on-time performance: only 56 percent of passenger journeys were completed on time. Subsequent years have shown improvements, but the Orange Line’s performance remains low overall compared to most other lines.[1]
The effect of the Silver Line at the western end of the Orange Line
The addition of the Silver Line in 2014 appears to have contributed to fewer weekday passenger boardings at Orange Line stations west of D.C. The Silver Line uses the same tracks as the Orange Line through the District and much of Fairfax County, before splitting off to Tysons Corner and reaching Wiehle-Reston East. Research from the Virginia Transportation Research Council strongly suggests that while the addition of new Silver Line trains increased overall Metro ridership, about half of Silver Line’s ridership came from passengers who previously used existing lines—such as the Orange Line.
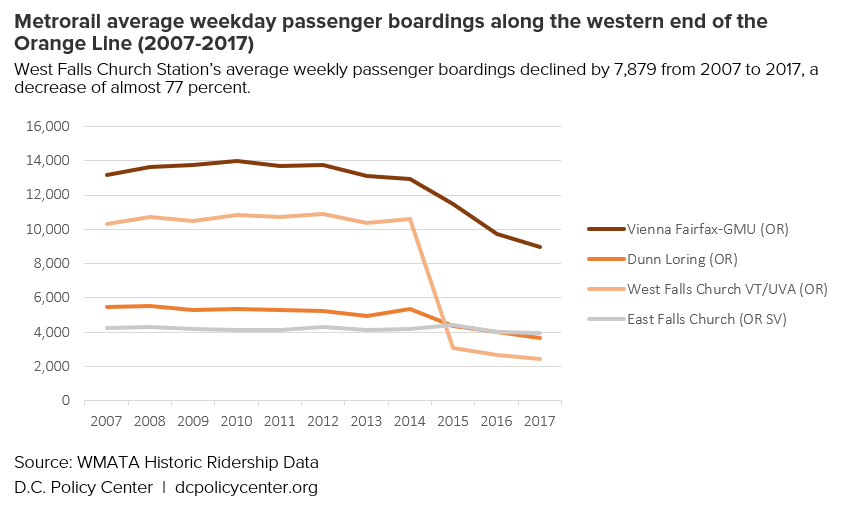
The Orange Line station with the greatest drop in ridership between 2007 and 2017 is West Falls Church—the last station on the Orange Line before it merges with the Silver Line. Over the 10-year period between 2007 and 2017, West Falls Church posted the greatest decline out of all Metrorail stations, consistent with 10-year and 15-year trends. This suggests that many riders who were previously travelling to that station to commute to a destination along the trunk line were more conveniently served by the new branch.[2] Many buses that previously served West Falls Church were also rerouted to serve Silver Line stations.
It seems that while the decline on the Orange Line as a whole predates the Silver Line’s 2014 opening, the addition of Silver Line service likely compounded later ridership losses. However, the other stations posting declines greater than 50 percent are all east of the split between the Orange and Silver Lines. In addition, it’s also possible that even with the added Silver Line service, Metro services has not kept up with demand: Capacity on WMATA is capped at a maximum of 26 trains per hour, but Metro has not been able to consistently operate near this upper limit—especially through the Rosslyn bottleneck. Therefore, it appears that the Orange Line is hampered by systemic problems, rather than a simple case of travel patterns shifting with new infrastructure.
A closer look at declining ridership on the Orange Line’s eastern end
While the western end of the Orange Line serves office jobs and park-and-ride traffic, as well as one major academic institution, stations east of the Anacostia River tend to serve lower-income residential areas that often have fewer commutes, a demographic trend which has only increased in recent years. (Edit 7/26/2017) Ridership was falling through 2016, but data for 2017 was collected in May, when these stations were closed for half the month due to track work. For this eastern stretch of the Orange Line, factors beyond service quality may be impacting ridership.
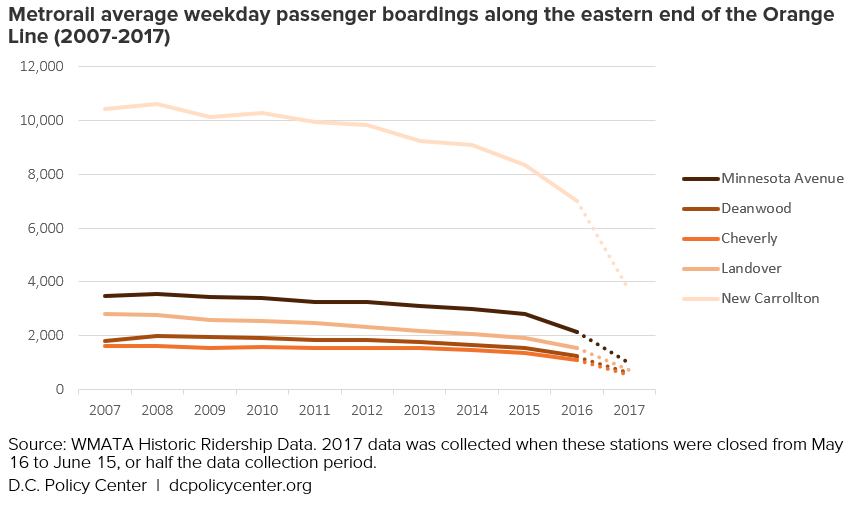
The largest absolute change since 2007 has been the ongoing decline in passenger boardings at New Carrollton, which started with more than 10,000 passenger boardings in 2007. The other Orange Line stations along the line’s eastern end—Minnesota Avenue, Deanwood, Cheverly, and Landover—have never had particularly high ridership levels, with weekday passenger boardings averaging around 2,000 to 4,000 depending on the station. Yet even those already low numbers have been on the decline, with three of these stations reporting average weekday passenger boardings of around 1,500 or fewer by 2016.
Potential effects of the Silver Line
To the east, it is also possible that the Silver Line has impacted ridership on the Orange Line. The addition of Silver Line service added additional frequencies to the eastern end of the Blue Line, between Benning Road and Largo Town Center, located in proximity to the Orange Line and sharing some of its catchment area. While passenger boardings did decline on the Blue/Silver eastern trunk since 2012, they decreased more drastically on the Orange Line’s eastern end. Further, 2017 ridership on what became the eastern Blue/Silver trunk line was higher than 2007 ridership (with the gains coming, notably, entirely from Morgan Boulevard,) whereas the reverse occurred over this period on the Orange Line between 2012 and 2016. The boost in frequencies from the new “interlining” on the southern line may have attracted some riders, particularly park-and-ride commuters, who previously used the Orange Line, or who lived in proximity to the Orange Line but did not ride it because they found service too infrequent.
Changes in residential population
It does not appear that declining ridership along the Orange Line is tied to trends seen elsewhere in the country, such as lower-income households and jobs moving towards the suburbs (rather than inward to the central city). In Portland, Oregon, an investigation found that increased housing prices were positively correlated with decreasing transit ridership, as lower-income riders were forced out of the city and used transit less. A similar analysis was performed as part of this study, but without conclusive results: across the system, rent increases were not predictive of declining station ridership as whole. (It should be noted that the focus on housing prices in Portland, conducted by that area’s transit agency, was more comprehensive, while this analysis focused specifically on rent.) There was a small but statistically significant correlation between rising rents and lower ridership on the western end of the Orange Line, which, as noted previously, has seen some of the most consistent ridership drops.
Looking solely at population changes in census tracts east of the Anacostia River between the five-year periods of 2006-2010 and 2012-2016 (below), we see that residential areas surrounding the Orange Line stations experienced both population increases and decreases.[3] And New Carrollton, which saw steady decreases in passenger boardings over that time period, is surrounded by areas of overall population growth. Based on these analyses, changes in residential population do not appear to be able to explain changes in Orange Line ridership in recent years.
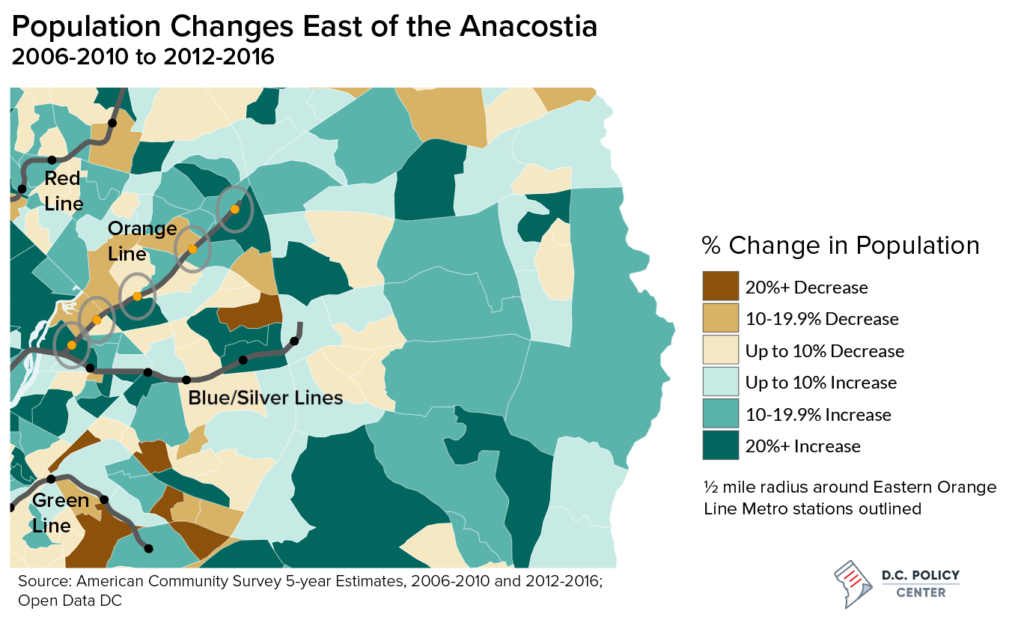
Map by Simone Roy, D.C. Policy Center
Changes in employment patterns
Similarly, there were no clear changes in employment patterns for residents living on the eastern segment of the Orange Line who commute in to D.C., although small sample sizes make exact trends difficult to quantify. [4] For residents of Southeast D.C., home to Minnesota Avenue and Deanwood stations (which had the third and fifth steepest 10-year ridership declines, respectively,) the number of residents employed in low-income work in D.C. remained steady or even increased. Farther out along the eastern end of the Orange Line and along the path of the MARC, there is evidence that while the total number of workers (including low-wage workers) commuting into D.C. hasn’t decreased, the number of commuters under age 30 has decreased slightly; this might have implications for the long-term future of the Orange Line. In the moment, however, recent minor changes to employment patterns are unlikely to have an effect on ridership along the eastern end of the Orange Line because there was always a relatively low number of residents from communities working in Metrorail’s catchment area to begin with.[5]
Mode shift: What are (former) riders doing instead?
If commuters are seeking alternative modes of transportation, some might also have started driving themselves, carpooling, slugging,[6] or turning to carpooling services offered by commercial ride-hailing services like Uber and Lyft.
In terms of data, it’s difficult to compare commuting mode over the full previous ten-year period due to changes in how census tracts are drawn, but we can compare the 2007-2011 and 2012-2016 five-year ACS estimates across census tracts in D.C. and Prince George’s County. In outer Prince George’s County, there generally was a clear pattern of a small decrease in rail commuting and a small increase in car commuting, which could indicate that the ridership at these Eastern orange line stations is affected by commuters driving from further East. However, this analysis does not paint a clear picture across the board, as there was a mix of changes in reported commuting modes in census tracts along the Eastern end of the Orange Line between 2011 and 2016, as the map below shows.
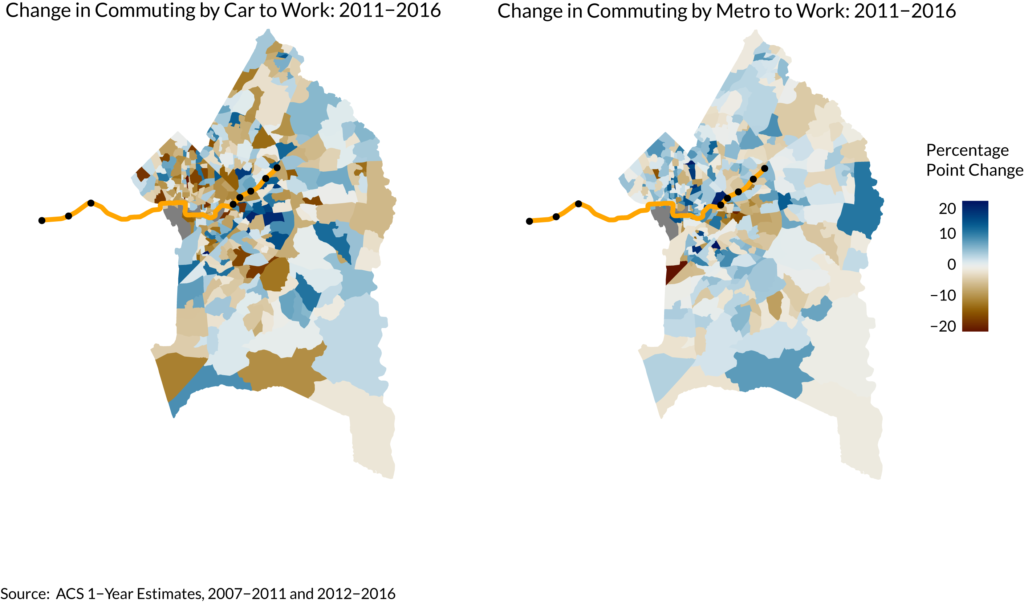
Map by Simone Roy, D.C. Policy Center
Ramifications
Additional service from the Silver Line and mode-shift in response to delays appear to explain the more recent losses in Orange Line ridership to the west. Along the Orange Line’s eastern end (where ridership has never been particularly high to begin with), the largest overall drops have been at the New Carrollton terminus, where riders might be particularly sensitive to service disruptions and other issues that lengthen their already-long commutes.
Some of these factors, such as the Silver Line’s effect on West Falls Church, appear to be specific to the Orange Line. However, others—including the large drop in ridership at New Carrollton—likely reflect riders’ reaction to more systemic problems. To address these underlying issues, WMATA should prioritize measures which improve reliability and increase overall trunk line throughput, not only to retain but also to grow ridership. This would include looking at increasing the capacity of buses: Two of the cities which gained ridership in 2016, Houston and Seattle, did so following a reconfiguration of their bus network to focus on the highest-ridership routes. This is something that Metro may wish to analyze further, particularly with its routes close to the I-66 corridor in the case of the Orange Line. Other stakeholders, such as the D.C. government, should likewise ensure that investment decisions prioritize overall ridership growth and benefits to the system as a whole. It would also be worth examining whether direct bus routes to outlying areas where low-income employment has increased, or other mobility improvements, would be worthwhile.
It is also possible that Metrorail’s overall maintenance dilemma is modestly exacerbating changes to employment locations. If commuters are finding Metrorail service unreliable, they may have been forced to take jobs in other, less accessible locations (and, by extension, purchase or use automobiles, adding to cost burdens.) This possibility reinforces the need for WMATA to move forward on state of good repair improvements, and to ensure reliable, frequent service to meet the District and the region’s mobility needs.
About the data
The ridership data used in this analysis is from WMATA Public Records of Historical Metrorail Ridership as of 2017 (also available from the National Capital Region Transportation Planning Board’s Regional Transportation Data Clearinghouse here). Data represents Average Weekday Passenger Boardings, and was collected in May of each year except when noted by WMATA. For data from 2007 to 2010, average weekday ridership was computed by EDADSE Editing System; ridership from 2011 to 2015 was computed by Crystal Reports System; ridership from 2016 and 2017 was compiled from NCS O-D Database. This piece has been updated (7/26/2018) to include information about data collection for passenger boardings in 2017, which likely overstated ridership drops for the eastern end of the Orange Line.
Aggregate Metrorail performance data is obtained from WMATA Public Records’ Vital Signs Reports from 2016 and 2018.
Employment location data is from the U.S. Census Bureau’s Longitudinal Employer-Household Dynamics data, obtained using the OnTheMap tool (based on primary job).
Population changes were calculated utilizing the U.S. Census Bureau’s American Community Survey, Sample Count of the Population, by block group (from the 2009-13 and 2012-16 5-year estimates) and by census tract (from the 2006-10 and 2012-16 estimates), accessed via American FactFinder.
Data on Metrorail service disruptions covering the period from 2012 to 2016 is originally from Open Data DC (hosted by Code for DC; no longer available on Open Data DC).
Notes
[1] In addition, data on Metrorail service disruptions from Open Data DC shows that the Orange Line experienced 5,177 service disruptions from 2012 to 2016, the second-highest number of Metrorail delays for the system (behind only the Red Line). However, this could also reflect the greater number of stations for these two lines.
[2] The VTRC report speculates that the Silver Line may also have had such an impact on nearby bus ridership.
[3] Population changes were calculated utilizing the American Community Survey’s Sample Count of the Population by block group (from the 2009-13 and 2012-16 5-year estimates) and by census tract (from the 2006-10 and 2012-16 estimates), accessed via American FactFinder.
[4] Employment location numbers were obtained from U.S. Census’ Longitudinal Employer-Household Dynamics data, obtained using the OnTheMap tool (based on primary job).
[5] While the District was the largest concentration of such employment for low-wage workers in many of these communities, most individuals at this income level worked consistently in “other locations,” indicating that job sources are spread out across the region. (In Southeast D.C., by contrast, the majority of low-income workers worked in the District in 2015.)
[6] Under this arrangement, drivers park their cars at large parking lots, in some cases those of Metrorail stations, and share rides to reach their final destinations. While data on slugging usage rates was not available, there are many slug pickup points along the Orange Line, and it is possible that as delays escalated on the Orange Line, riders from further out who did not switch to the Silver Line may have elected to use the Vienna slug pick up point (or others closer to their origin point).
Research Associate Simone Roy contributed data visualization and analysis assistance to this article.
D.C. Policy Center Contributing Fellow Ethan Finlan is a freelance researcher and writer who studies transportation and urban planning. He is currently based in the Boston area. Find him on Twitter at @Ethan_Finlan.