
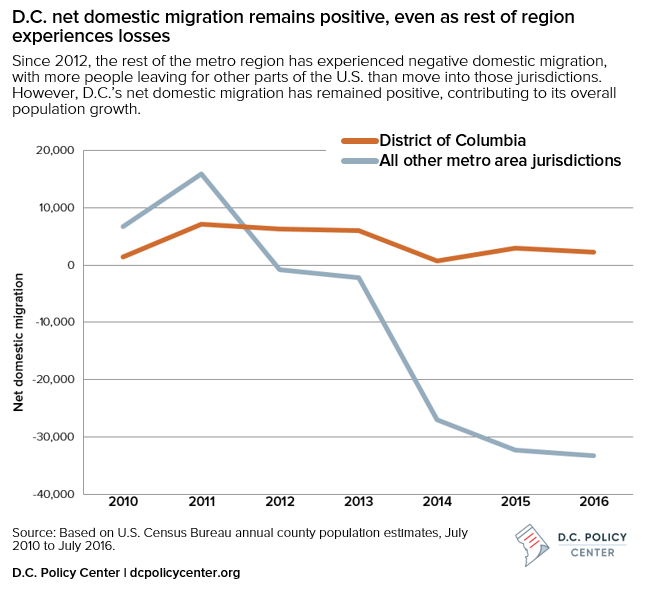
Since 2012, D.C.’s net domestic migration has remained positive, but the rest of the metro region has seen more people leave for other parts of the U.S. than move into those jurisdictions.
Over much of the past decade, the Washington, D.C. metropolitan region has enjoyed relatively strong population gains, and the latest estimates from the Census Bureau suggest the region’s population continues to climb. However, the domestic migration patterns underlying the growth have shifted significantly in recent years. On one hand, there is a large amount of churn in regional migration: 42 percent of departing D.C. residents settle elsewhere in one of five surrounding counties. But a closer look at recent data shows that the District and much of the surrounding jurisdictions are headed in opposite directions, with the District continuing to gain residents domestically while the rest of the region experiences net losses.
The Census Bureau reports annual domestic migration totals—where people are moving to and from within the United States—with the most recent estimates covering the 12-month period ending last July. This post will highlight a few of the more recent trends showing how the District compares to the rest of the region and other areas nationally. (Update: Please note that these are county definitions as used by the Census Bureau for statistical purposes.)
Regional migration shifts
For each of the past three years, more people have left the D.C. metro area for other parts of the country than moved in. In 2016, the reported net domestic migration loss topped 31,000 — the steepest decline in years. That represents a stark reversal from the immediate post-recession period when the region enjoyed especially strong population gains. Much of the shift is explained by the economy: The Greater Washington region weathered the recession better than other parts of the country, but jobs have since returned in places that previously sustained severe job losses.
Reviewing only the District’s numbers suggests that net domestic migration appears to have slowed from recent highs a few years ago, but it still remains positive. According to Census estimates, D.C. registered a net increase of about 2,300 people last year and 2,900 in 2015.
Meanwhile, migration for the rest of the region has plummeted. In 2016, all other jurisdictions lost a combined 33,300 residents, about the same as the year prior.
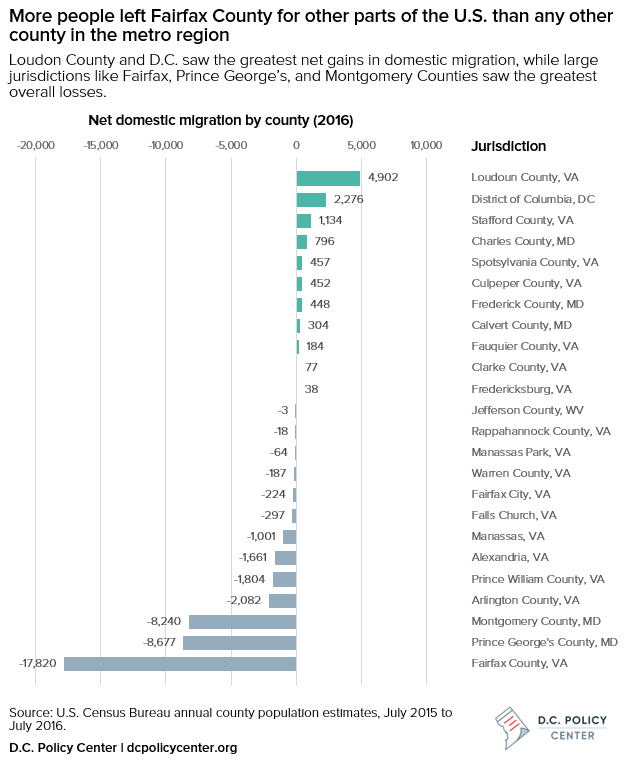
Fairfax County registered the single largest net loss – about 17,800 residents – to other parts of the U.S. last year. Fairfax is also the largest county in the metro region, with over 1.1 million residents; jurisdictions where people left at the greatest rates, as measured by net domestic migration relative to the size of the population, were Manassas and Falls Church Counties.
In fact, the only jurisdiction adding more residents through domestic migration than the District was Loudoun County. Loudoun, of course, has been one of the nation’s fastest-growing large counties for years, and recent estimates suggest its expansion has slowed little. Several outlying Virginia and Maryland counties also registered small increases.
It’s worth noting that the region as a whole still continues to increase in total population. That’s because gains in international migration and births more than offset the losses to other parts of the country.
Over the 12-month period ending in July, the District alone added an estimated 4,100 residents from abroad and another 4,300 from natural change (births minus deaths). These tallies, combined with domestic migration gains, amounted to an overall population gain of about 10,800.
How D.C. compares nationally with other regions
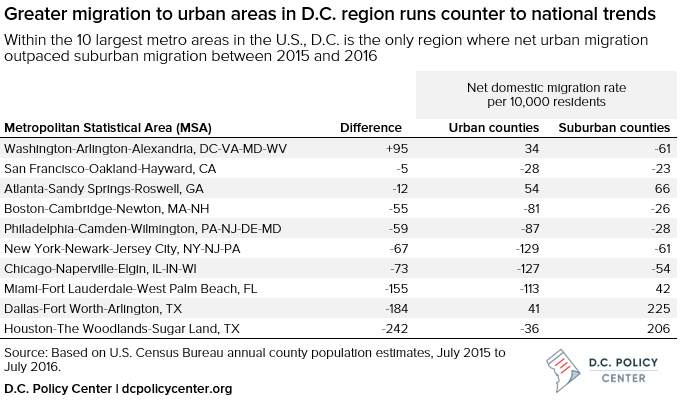
The District’s slight migration gains and the significant losses by its suburbs also run counter to national trends.
Elsewhere, population growth throughout much of suburban America has picked up significantly in recent years, while migration to urban areas has either slowed or reversed—a return to pre-recession patterns.
One way to illustrate this is by comparing county-level net domestic migration rates for jurisdictions within the same regions. Across 82 large metros with both urban and suburban populations at least 100,000, nearly all experienced faster growth in the suburbs. Metropolitan Washington was one of the few regions with greater domestic migration rates in its urban core than surrounding suburbs, along with Richmond, Va., and a few smaller metro areas.
The following table shows how 2016 net domestic migration rates within the D.C. metro area compare with those of the other top 10 largest regions nationally. (Any county containing either a region’s largest city or another city with a population exceeding 200,000 was considered “urban,” while all others were considered “suburban.” Figures for the D.C. region compare the District to all surrounding jurisdictions.)
Even in several of the hottest regions — including Austin, Nashville and Seattle — migration to suburbs far outpaces movement to densely-populated urban counties. Many more cities would be losing population if it weren’t for international migration and births.
It’s true that migration to the District has slowed somewhat the past few years, but its slight gains still far exceed the mounting losses across much of the rest of the region’s suburbs. So, given what’s taken place nationally, D.C. represents somewhat of an anomaly.
Update: The spelling of “Loudoun” in the text has been corrected.
About the data
The Census Bureau publishes county-level population estimates reflecting changes over the 12-month period ending in July of the corresponding year. Data presented here measure domestic migration only and do not reflect international migration or natural changes. This specific data source does not include details about where people are moving to or from, which is instead covered in other surveys.