
How easy is it to get a seat at D.C.’s most diverse schools? This blog post examines the relationship between diversity scores and waitlists as a follow up to the D.C. Policy Center report, Landscape of Diversity in D.C. Public Schools.
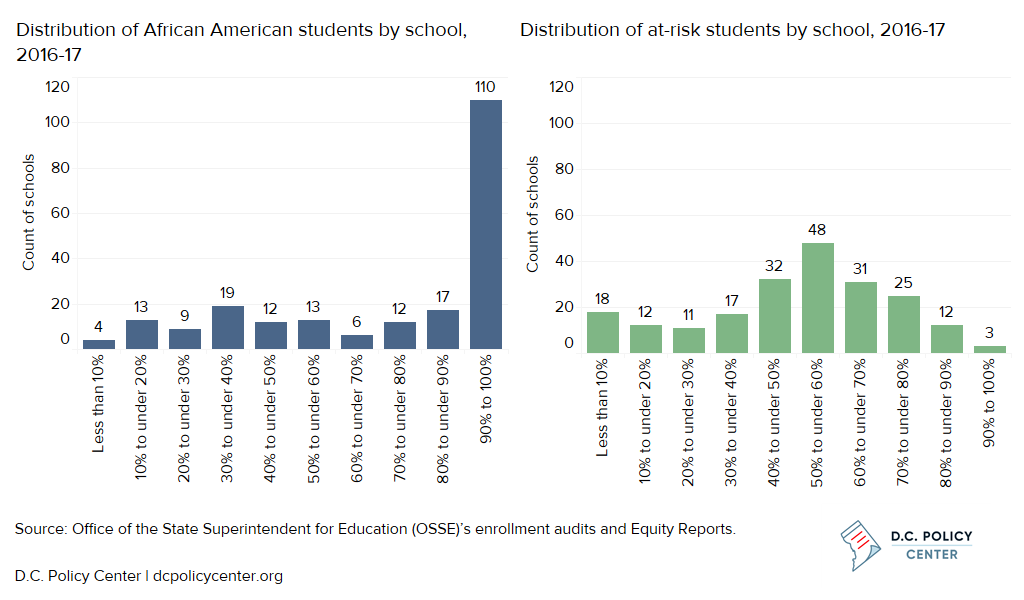
Racial and ethnic diversity in D.C.’s traditional public and public charter schools is low, even considering student demographics, while students are more mixed economically.[1] In 2016-17, 68 percent of students were African American, 18 percent were Latino, and 10 percent were white. However, the distribution of African American students was extremely imbalanced. Half of D.C.’s public schools[2] with students in pre-kindergarten through grade 12 had a student body that was at least 90 percent African American, meaning that the majority of students did not attend school with many peers from other racial or ethnic groups.[3] In the same year, 47 percent of students were at-risk. Over half of public schools had between 40 percent and 60 percent of students who were at-risk, meaning that about half of schools had a balanced share of students from different economic groups.
Distribution of students by percent in group
This analysis builds on the D.C. Policy Center report, Landscape of Diversity in D.C. Public Schools, and compares diversity scores to the number of students on a school’s waitlist after the common lottery results are released. The purpose is to get a sense of how difficult it is to enroll at D.C.’s diverse schools. Diversity is measured by how exposed students are to other groups in terms of race and ethnicity as well as economic status, or the percentage of students who are not in the plurality group (the group with the highest percentage of students).[4] The number of students on a waitlist indicates how many students would like to attend a particular school, but are not matched initially to the school because all available spaces have been filled. School size and the number of grades served matters, but this analysis uses the waitlist length only for the entry grade instead of all grades to correct for school size (for example, a middle school that offers three grades is likely to have a lower total waitlist than a school that offers eight grades).
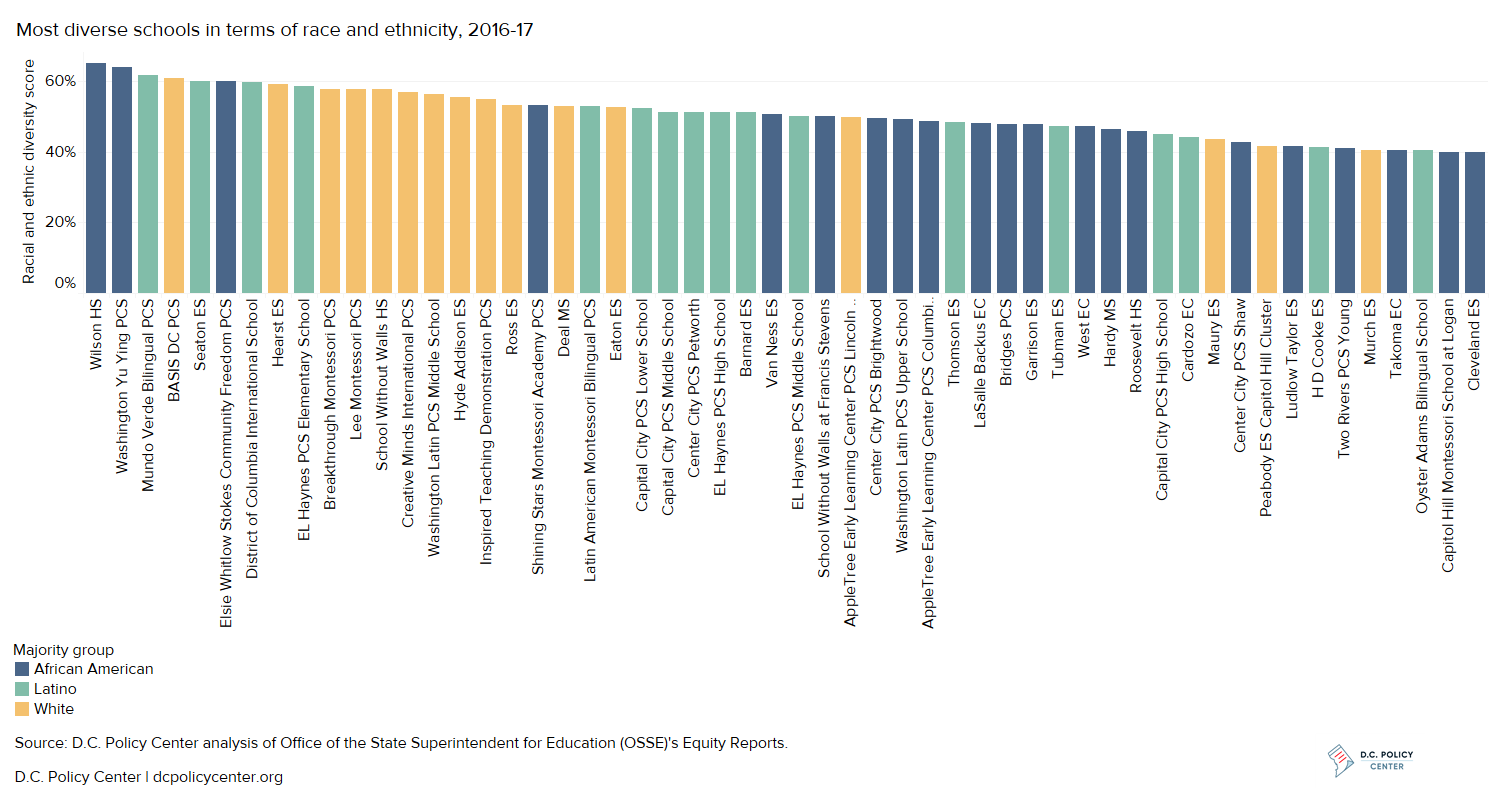
Racially and ethnically diverse schools
Fifty-four schools have student bodies that are relatively more racially and ethnically diverse, as identified by their diversity scores above the 75th percentile (above 39 percent). At these schools, the plurality group represents no more than 61 percent of the student body.[5] Schools with more racial and ethnic diversity are more likely to have a white or Latino plurality group than other schools and be located in particular Wards (1, 2, 3, 4, and 6). District of Columbia Public Schools (DCPS) have higher racial and ethnic diversity than do public charters, especially where a high percentage of students attend their in-boundary school and where there are lower percentages of at-risk students.
Racially and ethnically diverse schools
D.C.’s schools have higher waitlists when they are more diverse racially and ethnically.
These 54 schools provide some options for families seeking more racial and ethnic diversity, but getting a seat is no guarantee at public charter schools, DCPS neighborhood schools for those who don’t live in the boundary, DCPS application high schools, or in pre-kindergarten grades at DCPS schools without guaranteed enrollment until kindergarten. In other words, getting a seat in racially and ethnically diverse schools is hard.
There is a positive and significant association between racial and ethnic diversity scores and the size of the waitlists in an entry grade. As racial and ethnic diversity increases, waitlists increase as well. On average, the most racially and ethnically diverse schools have longer waitlists: their waitlists in entry grades have 190 names, compared to other schools that have an average entry grade waitlist of 40 names. This means that there is no guarantee of a space at racially and ethnically diverse schools unless a student lives in the school’s boundary.
More racially and ethnically diverse schools have higher waitlists
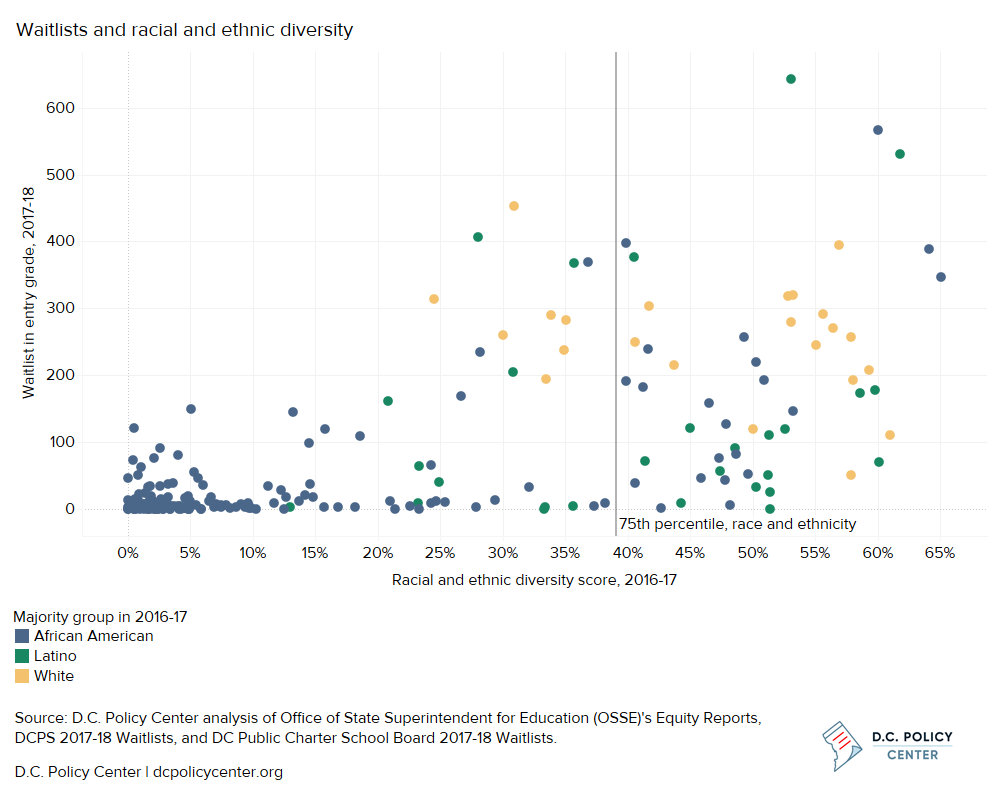
It is unclear what these longer waitlists say about demand for diverse schools. Schools that are more diverse racially and ethnically tend to be plurality white or Latino, and when a school has a white or Latino plurality group, it also tends to have higher waitlists regardless of the level of diversity. On average, the waitlist in entry grade is 255 for plurality white schools, 141 for plurality Latino schools, and 43 at plurality African American schools. This could mean that families have stronger preferences for majority white or Latino schools, but it could also mean that those who are applying to these schools are more likely to apply to multiple schools, or apply to schools in the common lottery at all, which could inflate waitlists for these schools.
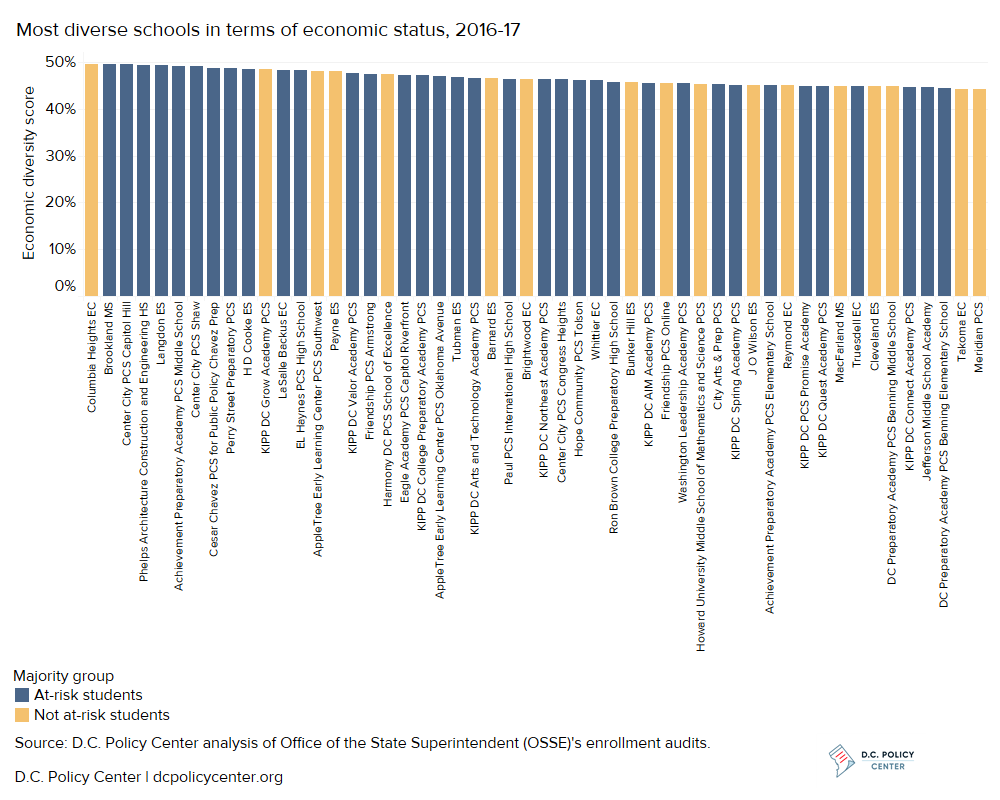
Economically diverse schools
Schools are more likely to have students from a mix of economic backgrounds, as measured by the percentage of students who are identified as at-risk.[6] The 52 most economically diverse schools with scores above the 75th percentile have between 46 and 50 percent of students in one economic group (at-risk or not at-risk), which means students are exposed to more peers from another economic group than at other schools. Public charter schools are more economically diverse than are DCPS schools, and schools with a plurality of at-risk students are more likely to be the most economically diverse.
Economically diverse schools
Seats are easier to find at economically diverse schools
For families who are seeking economic diversity, it is easier to find a seat among economically diverse schools than at racially and ethnically diverse schools. There is a negative and significant relationship between economic diversity and waitlists. More economically diverse schools have lower waitlists. The average waitlist is 29 names at the most economically diverse schools, compared to 94 names for other schools. At the most economically diverse schools, there are no waitlists above 200, but waitlists vary in length from zero to 643 at other schools. This means that families are more likely to get a seat at economically diverse schools.
Waitlists and economic diversity by school
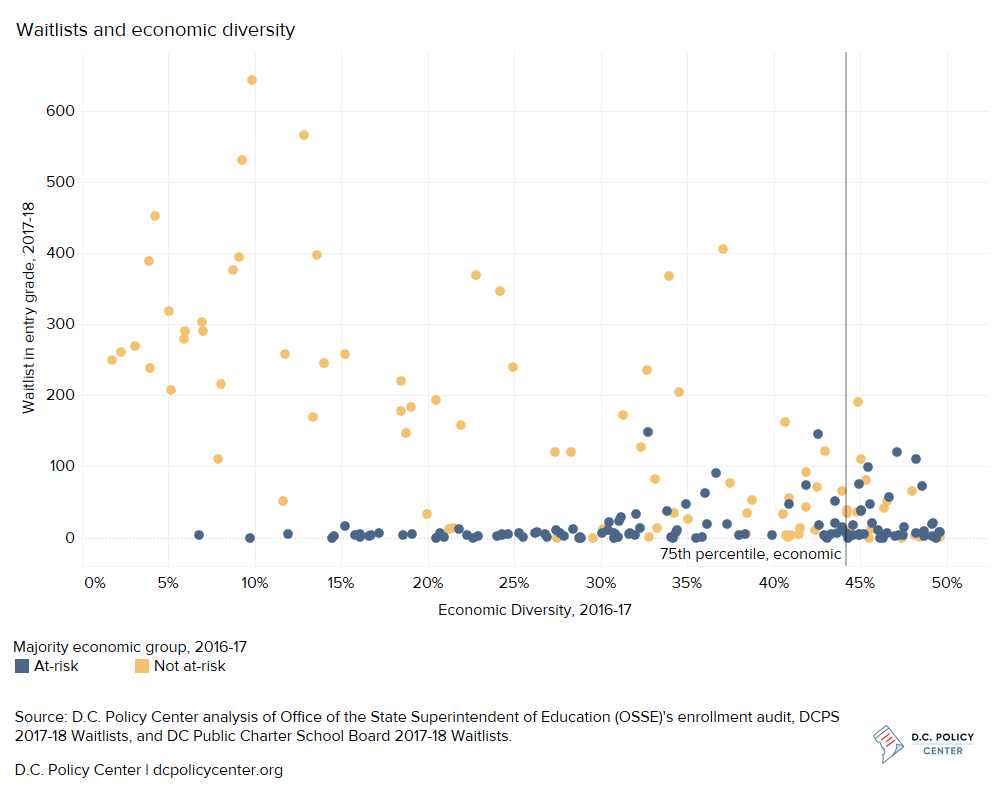
Drawing conclusions about demand for economically diverse schools is difficult. Schools with a plurality of students who are not at-risk have the highest waitlists. The waitlist for the entry grade at majority not at-risk schools is 148 names, higher than at majority at-risk schools (17 names). This could mean that families who apply to schools with a lower proportion of at-risk students are more likely to apply to multiple schools and apply in the common lottery. Data also show that waitlists are likely to be influenced disproportionately by not at-risk applicants, as lottery applicants are less likely to be at-risk than the student population: 35 percent of lottery applicants in 2016-17 were at-risk[7] compared to 47 percent of students.
Families seeking racial and ethnic diversity in D.C.’s schools may have difficulty finding a seat at the type of school they desire unless they live within the boundary for a diverse DCPS neighborhood school. This can be a challenge for low-income families, as almost half (12 out of 26) of the neighborhood options that are the most racially and ethnically diverse are located in Wards 2 and 3, where housing tends to be more expensive.[8] Families seeking economic diversity in schools, on the other hand, are likely to encounter lower waitlists and access seats at economically diverse schools more easily.
Notes
[1] Coffin, C. 2018. Landscape of Diversity in D.C. Public Schools. D.C. Policy Center. https://www.dcpolicycenter.org/publications/landscape-of-diversity-in-dc-public-schools/
[2] Here and throughout, public schools refers to both traditional public and public charter schools.
[3] Office of the State Superintendent for Education (OSSE). 2017. 2016-17 School Year Equity Reports. https://osse.dc.gov/page/equity-reports.
[4] Read about the methodology in Landscape of Diversity in D.C. Public Schools.
[5] Schools with racial and ethnic diversity scores in the 75th percentile (scores above 39 percent) were identified as relatively more racially and ethnically diverse. At these schools, the plurality group with the highest percentage of students represents less than 61 percent of enrollment, and other groups make up at least the remaining 39 percent.
[6] The at-risk category includes students who receive Temporary Assistance for Needy Families (TANF) or Supplemental Nutrition Assistance Program (SNAP) benefits, are homeless, are involved with the foster care system, or over-age in high school.
[7] Peretti, C. and Parrot, A. (2018). Giving At-Risk Students Preference in a Unified Lottery for Public Schools. My School DC. https://www.myschooldc.org/resources/data
[8] The median sale price of single family homes in 2016 were $1,300,000 and $1,173,000 in Wards 2 and 3, respectively, compared to a citywide median sales price of $660,000 according to Neighborhood Info DC.
Feature photo of Capital City Public Charter School by DC Public Charter School Board. Used with permission.
Chelsea Coffin is the Director of the Education Policy Initiative at the D.C. Policy Center.