Many factors impact the trajectory of rents in a city including the increase in renter households relative to the number of available units, incomes, and the overall strength of the economy. In cities like the District, with relatively restrictive land use regulations, rent control laws could put a significant wedge between market rents and rents providers are able to charge in rent-controlled units.
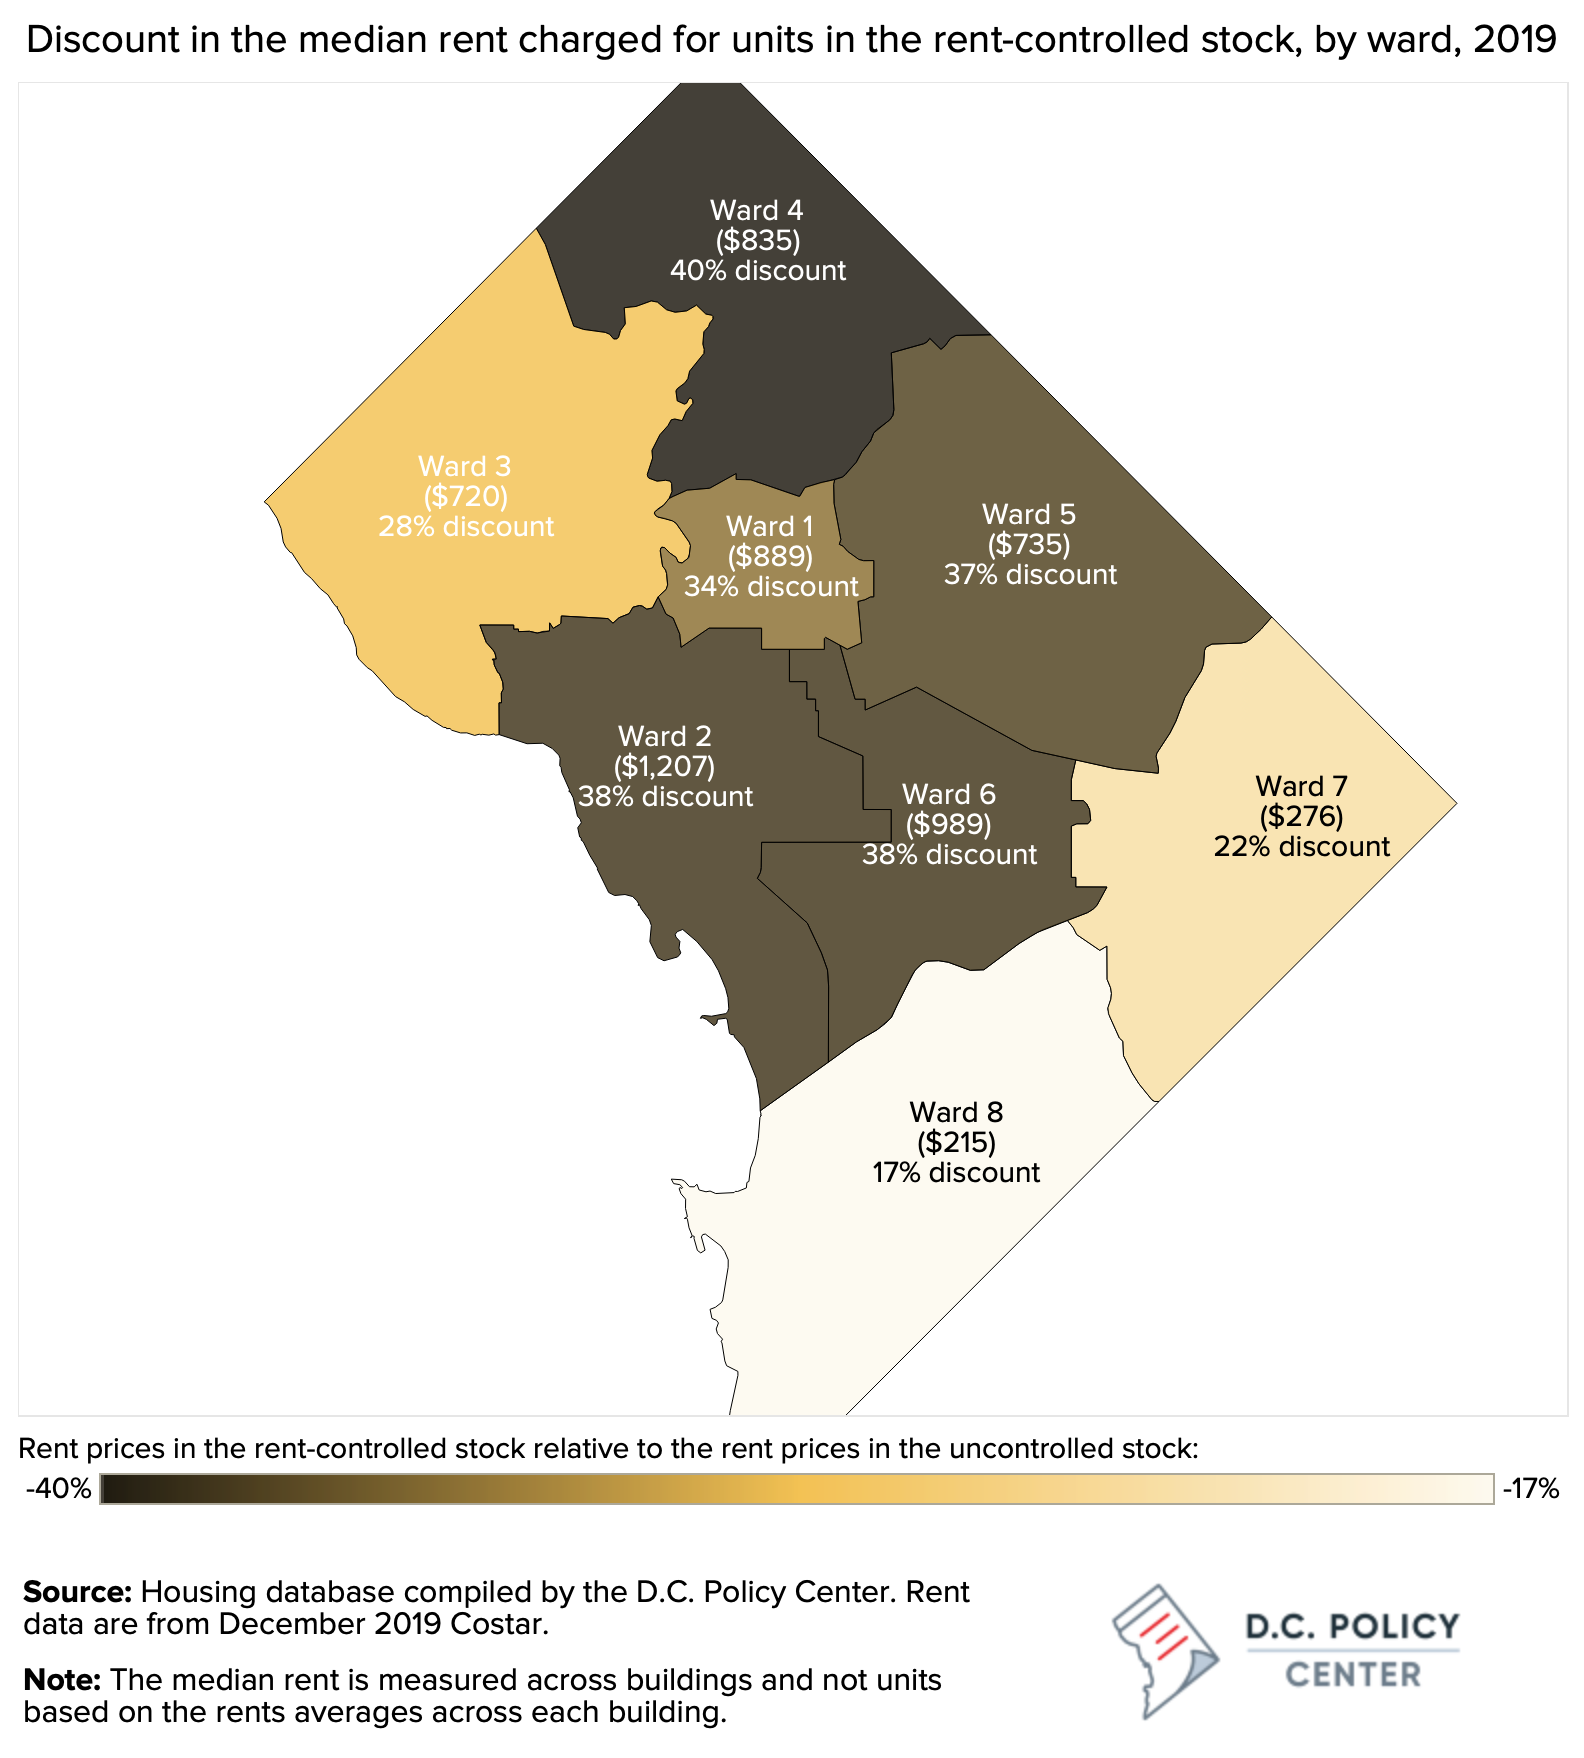
According to D.C. Policy Center research, rents in rent-controlled buildings can be notably lower than the rents in uncontrolled buildings. The median rent-controlled building in the District rents its units at rates that are 25-35 percent below the median rents for units in the uncontrolled stock. These differences are not entirely because of rent control: they also reflect the differences in building location, age, amenities, and the different mix of units across the rent controlled and uncontrolled stocks. For example, location alone can explain much of the variation in rents. Rent-controlled units can rent at a 40 percent discount in Ward 4, 38 percent discount in Wards 3 and 6, but only at a 17 percent discount in Ward 8 (Figure 4). But this gap between market rents and rent-controlled rents could be much bigger under B23-873 if the District experiences rent growth similar to its past.
How much did the rents grow since 2006?
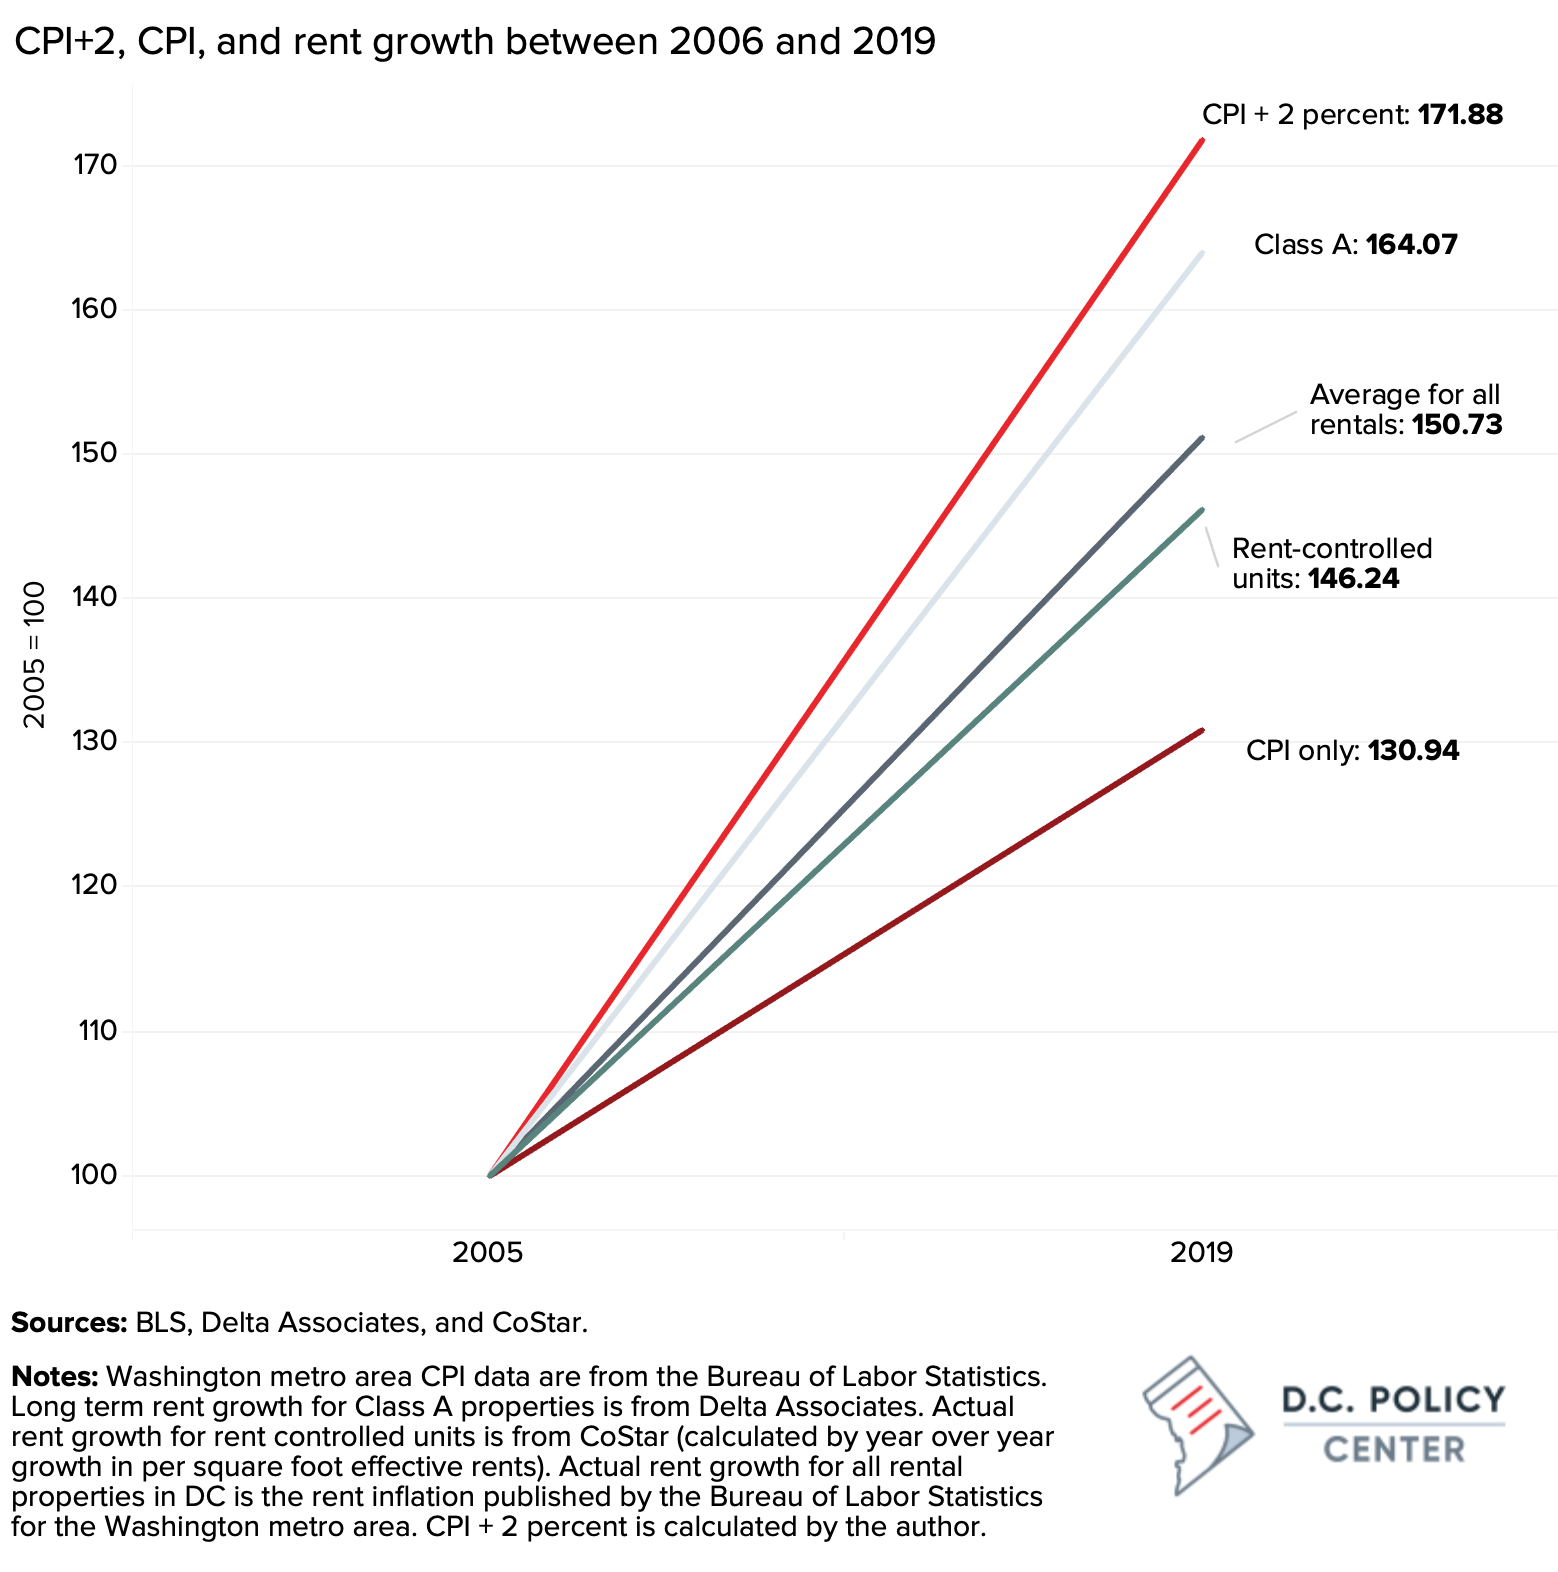
Data from 2006 to 2019 show that rents in rent-controlled units grew, on average, by 2.8 percent, or a combined 46 percent over this period (Figure 5).[1] Averaged across years, rents grew at rates slower than the allowable rate of CPI + 2 percent, which averaged about 4 percent through these years, and would have yielded a combined growth of 72 percent. During this period, even Class A properties,[2] on average, did not grow as much as CPI +2 percent. Rents in Class A properties grew by an average of 3.6 percent per year, or by a combined 64 percent [3]. The muted growth in rent is a likely result of significant number of new units delivered during this period, and strong production of new housing has served as a natural control on rents. [4]
The observed rent growth averaged across years is certainly different from the actual rent growth that tenants experienced from year to year.[5] Some units and buildings likely had higher rent growth if they had high turnover, or increased rents through a petition process. This is important to remember because the existing slack between CPI+2 percent and the actual rent growth allows housing providers to be nimbler, allowing them to raise rents at varying rates from year to year depending on the market conditions and conditions in their buildings, such as vacancy rates and turnover. This slack between what was permissible (the equivalent of roughly 4 percent per year between 2005 and 2019) and what the market was able to bear (the equivalent of 2.8 percent during the same period) has allowed housing providers better manage their margins and remain in service.
How would B23-873 change the rent trajectory?
Bill 23-873 would limit rent growth in rent-controlled buildings to growth in the Consumer Price Index (CPI) only. The CPI will likely be a hard cap given the other limitations in the bill: elimination of vacancy increases and voluntary agreements, and significant tightening in the other petition processes would mean that most providers would not be able to raise rents by more than the CPI. It is hard to know what CPI would be in 2033, our best estimate is what is projected by the Office of Chief Financial Officer for 2024, which is 1.8 percent.
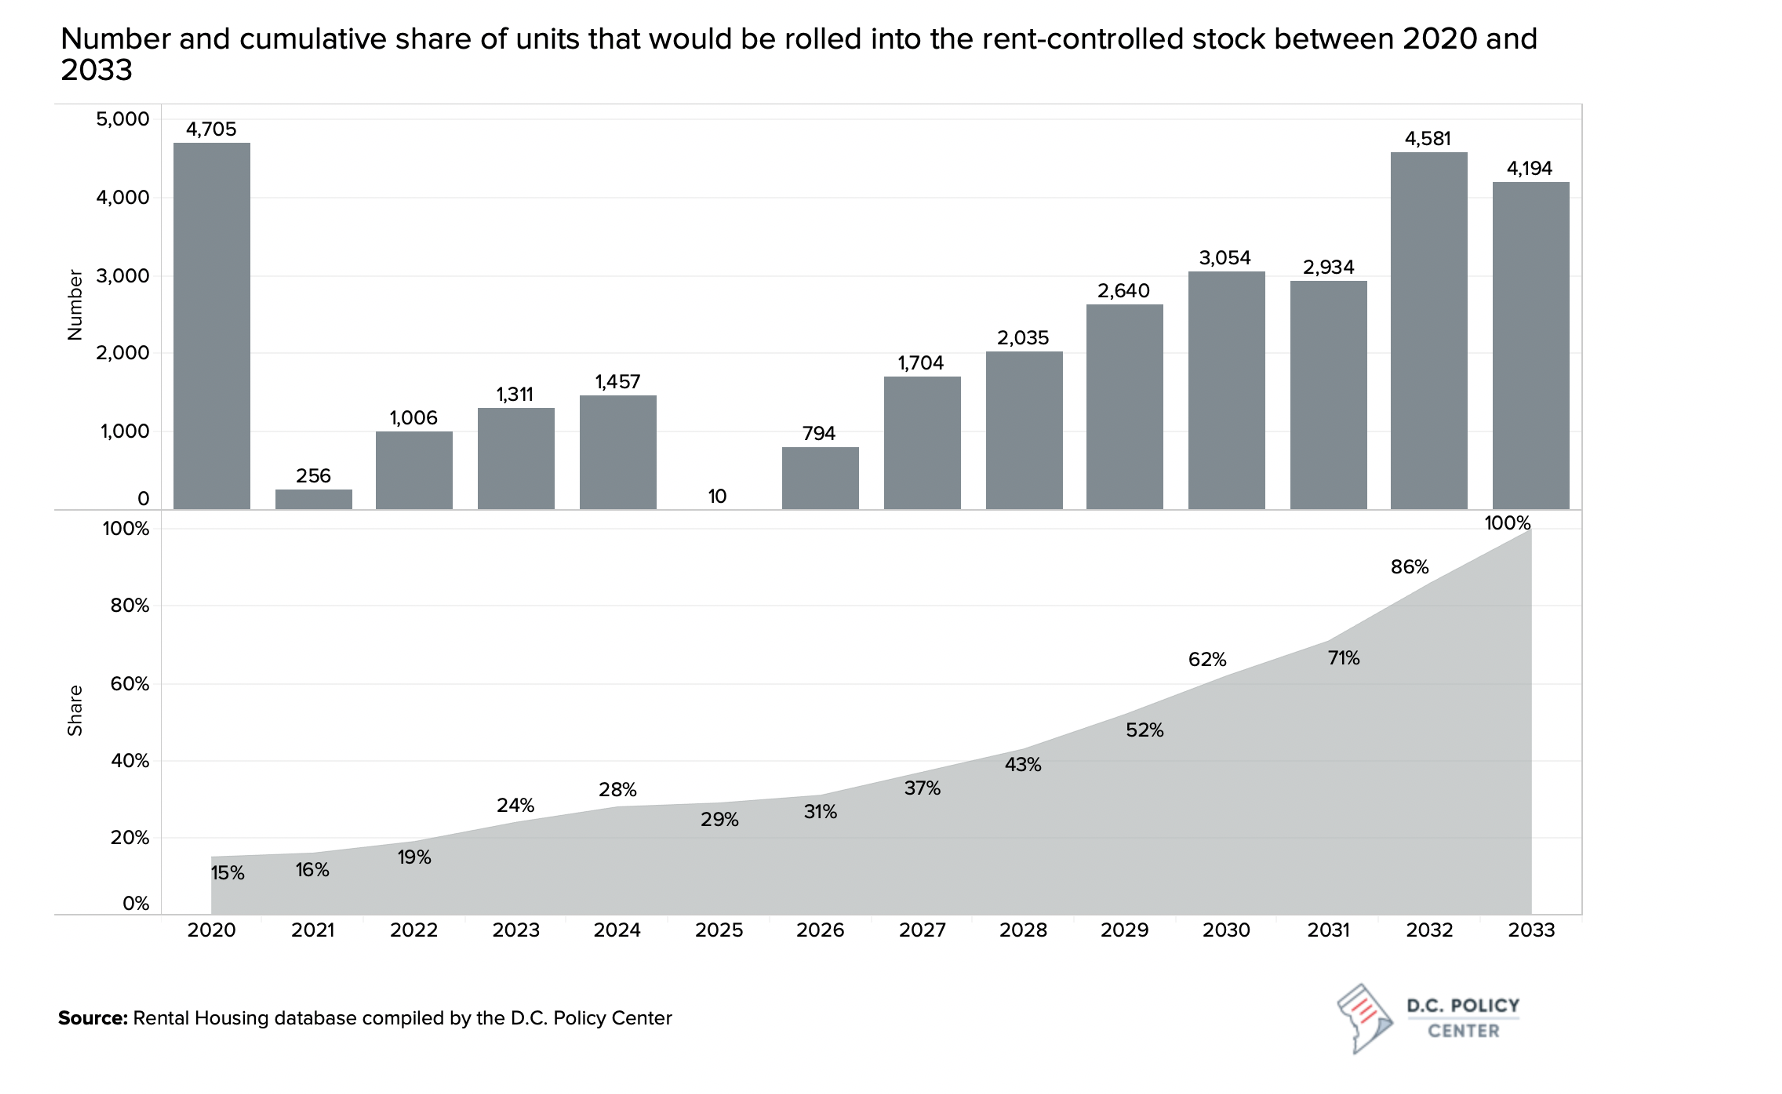
Buildings currently under rent control and those with four units would immediately be impact by this change. Additionally, 4,705 units in large multifamily buildings constructed between 1977 and 2005 would also be immediately impacted. Over the following thirteen years, as additional buildings would incrementally become subject to rent control, more units would be subject to the CPI-only ca. A consideration of potential rent trajectories under B23-873 suggests that annual rent growth could decline by 0.5 percent to 1 percent per year as a result of the CPI-only limitation.
Initially, the impact of B23-873 on rents would be muted by the current economic recession. While this may seem like a good thing—that the rent limitations of the bill would not be that different from the market outcomes—it is a real concern for housing providers who will be relying on post-recession growth to make up for their current losses, making it even harder for them to return to pre-pandemic operating levels. Over time, the gap between the rent trajectories under current law and under B23-873 would widen.
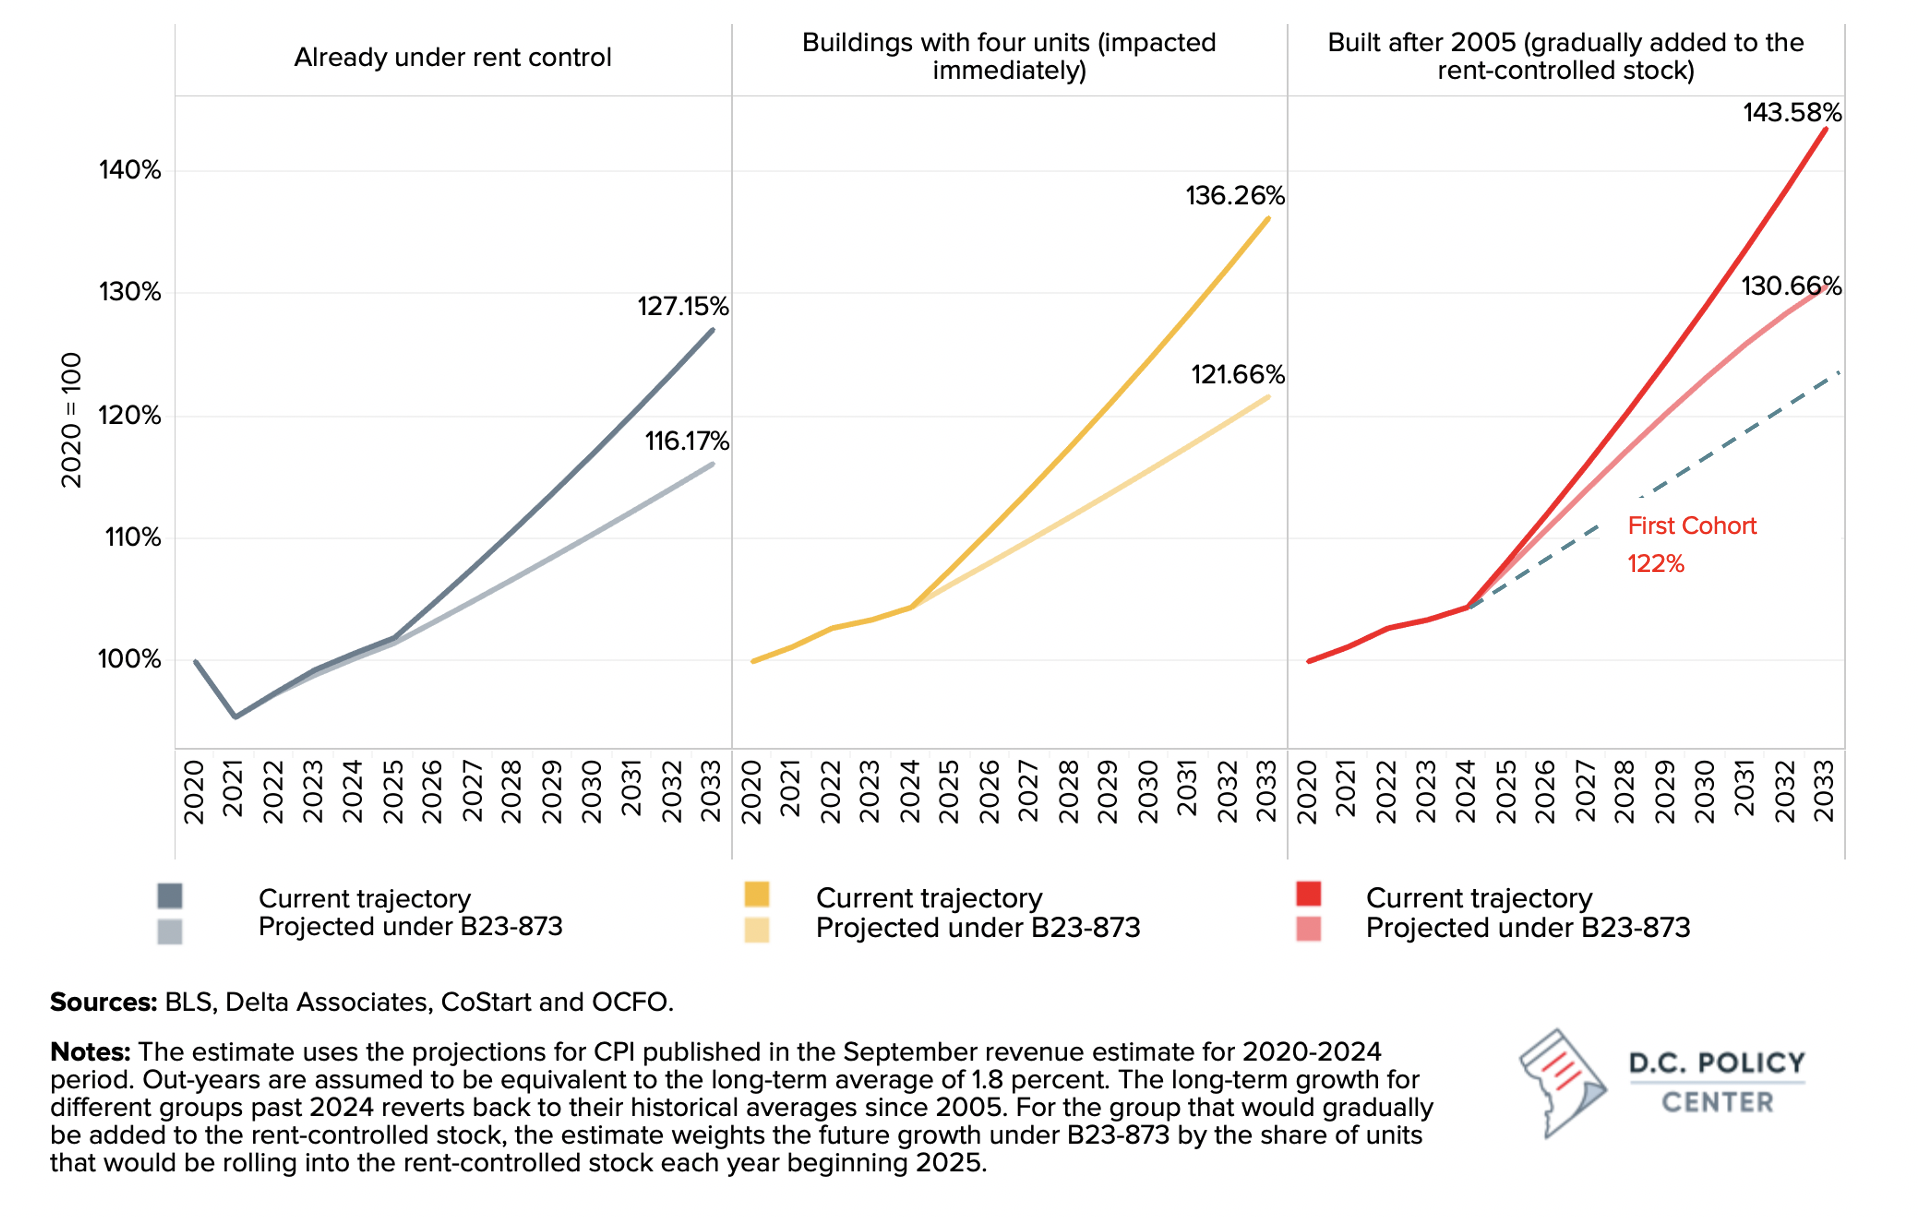
For the housing stock currently under rent control, rent growth under B23-873 would be depressed by 11 percent between 2022 and 2033 (the period assumed to be past the economic recession). In other words, rents would grow 0.73 percentage points slower each year, at a projected rate of 1.65 percent under B23-973 compared to 2.42 percent under current law. For small buildings with four units, the combined impact over the same period would be a 15 percent decline in rents by 2033 compared to the baseline (the equivalent of rents growing 1 percentage point slower each year.[6]
The impact of the bill on the multifamily buildings built after 1977 would be felt gradually, because each year only a certain share of these units would be rolled into the rent-controlled stock. The figure above depicts this impact by weighing the rent growth by the share of units that would be rolled into the rent- controlled stock each year.[7] When adjusted for this gradual rollout, we find that by 2030, rents would be 13 percent lower under B23-873 by 2033 compared to the baseline scenario. The actual impacts would be different for different cohorts. For example, for the first cohort that would be immediately included in the rent-controlled stock. (buildings constructed in 2006), the gap between rent growth under current law and under B23-873 would be 23 percent by 2033. That is, for these units, rents would grow 1.2 percentage points slower each year compared to the baseline scenario (Figure 6, right panel).
What does this mean for valuations and tax revenue?
Rent control, by design, limits operating incomes, which, in turn, depresses the values of apartment buildings subject to control. This lower valuation impacts both the city’s tax revenue (lower assessed values) and the future housing development patterns (the likelihood of decreased construction of rental housing due to lower return on investment).[8]
In the District, income generating properties, including multifamily apartment buildings, are assessed based on the net revenue after accounting for operating expenses—known as the net operating income—they earn in every year. Under this “income method,” the assessed value of a buildings is equivalent to the present value of all future net income that the building could generate. Tax assessors calculate this value by discounting the future string of net operating incomes (revenue from rents minus the costs of operating and maintaining the building) by a cap rate, which is a discount rate that captures the overall conditions in the rental housing market.[9] Tax assessors further adjust this calculation by considering vacancy rates, the physical condition, and other salient features of each building.
Under this valuation system, taxable assessments change for two reasons. First, taxable assessments grow if net operating incomes grow. This would happen as a result of rent growth, or as a result of increased efficiencies in building operations that could follow, for example, the installation of new windows or an energy-efficient furnace, or the replacement of a 24-hour concierge with keyed entry to the building. Second, assessments change if cap rates change, for example if a similar building is sold at a high price, or if the underlying expectations about the market’s performance changes. A lower cap rate means that future earnings are discounted at a lower rate, increasing the present value of future net operating income of a building, even if the net operating income stays the same.
Model structure
The main focus of this brief is the impact of stricter rent-control laws on net operating incomes and their growth trajectories.[10]Because B23-873 would remove almost all possible means of raising rents above CPI by (a) eliminating vacancy increases, (b) making it harder to file various petitions, (c) significantly reducing rent increases providers can seek under various petition processes, and (d) limiting landlords to a fixed 30-day period for implementing rent increases each year, its impact on net operating income growth would be significant.[11] Consequently, under B23-873, the CPI growth could become the absolute cap on rent growth for rent-controlled buildings, and therefore a de facto cap on net operating income growth. To the extent that current expectations about the future of CPI are lower than the current expectations of future rent and operating income growth, both assessed values and tax revenue would decline.
Two key variables drive the analysis presented in this section:
- The selection of the baseline growth assumptions. In other words, what kind of rent and income growth are providers projecting for the next ten to fifteen years? These expectations are shaped by current market conditions (such as the impact of COVID-19), future pipeline of housing, demand projections, and historic growth in rents and incomes. This brief considers three different baselines:
- Growth trajectory in assessed values and the implied growth in net operating incomes observed between 2006 and 2019. We chose the first period to begin in 2006 because that is the earliest year for which we have tax and assessment data at the individual building level.
- Growth trajectory in assessed values and the implied growth in net operating incomes observed between 2014 and 2019. We chose this second period to begin in 2014 to limit our analysis to more recent history, removing both the high growth periods before the Great Recession, and the relatively modest growth observed through 2014.
- Growth trajectory for real property taxes from the OCFO’s most recent revenue projections (published in September 2020.) We chose the third scenario to build an extremely conservative alternative.
- The selection of growth assumptions under B23-873. That is, what kind of rent and income growth should housing providers expect if the District were to adopt B23-873? This expectation is largely shaped by the projections for the CPI. This brief uses a CPI growth rate of 1.8 percent through our projection period. This is the OCFO’s published CPI projection for fiscal year 2024.[12] The actual inflation could be higher or lower, but our goal is to capture the expectations about rent growth under B23-873, so using the CPI projections is appropriate.
Three separate calculations of the potential losses in assessed values are presented for (1) buildings currently under rent control; (2) small buildings with four units that would be immediately subjected to rent control; and (3) large multifamily buildings that are built after 1977 and would over time roll into the rent-controlled stock by 2033. The section ends with a projection of property tax revenue losses that result from lower assessed values.
The projections presented in this section assume that all buildings subjected to the rent control regime under B23-873 would remain in the rent-controlled stock. While leakage from the rental market would reduce these impacts, they would come at the expense of affordability in the overall housing market. These implications are discussed in Part V of this brief.
Is this a fiscal impact analysis?
A fiscal impact analysis compares the revenue and expenditure impacts of a proposed legislation to the revenue and expenditure trajectories in an approved budget and financial plan. This analysis is then overlaid on the budget and financial plan period which is the current (or the most relevant) fiscal year and the three subsequent years. The purpose of a fiscal impact statement is to inform budget decisions.
The purpose of this brief is to inform policy decisions. For these reasons, the analysis focuses on a longer period of 13 years, and it presents multiple scenarios including scenarios based on historic growth as well as the projected growth. The reasons for this approach are the following:
- Because tax assessments for income generating properties lag actual economic activity by two years, a fiscal impact statement would not capture the impact of restricted rent growth for the first two years after the adoption of B23-873 and only a small loss in the last two years of the financial plan. This brief focuses on a longer period because these losses compound over time.
- In some scenarios, this brief uses historic growth rates as opposed to the baseline revenue in the city-approved budget because baseline revenue tends to be conservative. In this way, the projections take into consideration the positive (and occasionally negative) real property tax revenue surprises the city had experienced since 2006.
- As an alternative, a third scenario that pegs the baseline growth to the OCFO’s projected growth for property tax revenue in the year 2024. And all baseline scenarios also use the OCFO’s published estimates of real property tax growth for the fiscal year 2021 to 2024 period.[13]
There are other, secondary impacts of the bill that can reduce tax revenue for the city. Declining rents, even if they were in the future, would change the behavior of market actors sooner because market actors take into consideration future conditions when they make decisions. Depressed revenues in the future would impact current sales and investment activity and new constructions, with a cascading impact on the entire housing market in the city. Quantifying these impacts require additional assumptions for which we do not have enough data, but Part V of the brief discussed some of these implications.
Impact on properties currently under rent control
The first group of properties that would be impacted by B23-873 are those that are currently under rent control. As noted, an estimated 72,878 units in 2,157 buildings are subject to rent control in the District of Columbia. According to tax rolls, in 2019, these buildings were collectively valued at $11.6 billion. Combining tax data from 2006 through 2019, we were able to compile the tax assessment histories for 2,050 of these 2,157 buildings (95 percent). Over that period, the collective taxable assessments for these buildings grew by an average of 8.5 percent year over year (or 189 percent combined over the 13-year period—the equivalent of about a tripling of the assessed values).
This strong growth was the result of multiple factors. For the period between 2006 and 2019, both declining cap rates and growing operating incomes fueled assessment growth. The gradual decline in cap rates from 7.4 percent in 2006 to about 5.4 percent in 2019 explains about 35 percent of the increase in values during this period.[14] In other words, improvements in the underlying market conditions account for about a third of the value appreciation. The remainder is largely driven by the increases in net operating incomes. When adjusted for cap rate changes, the growth in taxable assessments during this period points to an implied average annual growth in net operating incomes of 6.4 percent (Table 5).[15] This value is implied because it is the residual growth after the influence of cap rate changes on valuations is removed.

For the period between 2014 and 2019 (Scenario 2 in Table 5), both the growth in assessments and the decline in cap rates were more muted. During this period, the combined taxable assessments of the 2,050 rent-controlled buildings for which we have data increased by 35 percent. The cap rates had already declined to 6.5 percent and stabilized by 2014, but they still account for about 40 percent of the change in valuations. The remainder was driven by net operating income growth, which is estimated at four percent for this five-year period.
The third scenario presented in Table 5 simply assumes that baseline assessments would grow by 2.9 percent, replicating the OCFO’s projected growth rate for real property tax revenue. As the analysis keeps cap rates constant for the projection period, both taxable assessments and net operating incomes would also grow at this rate.
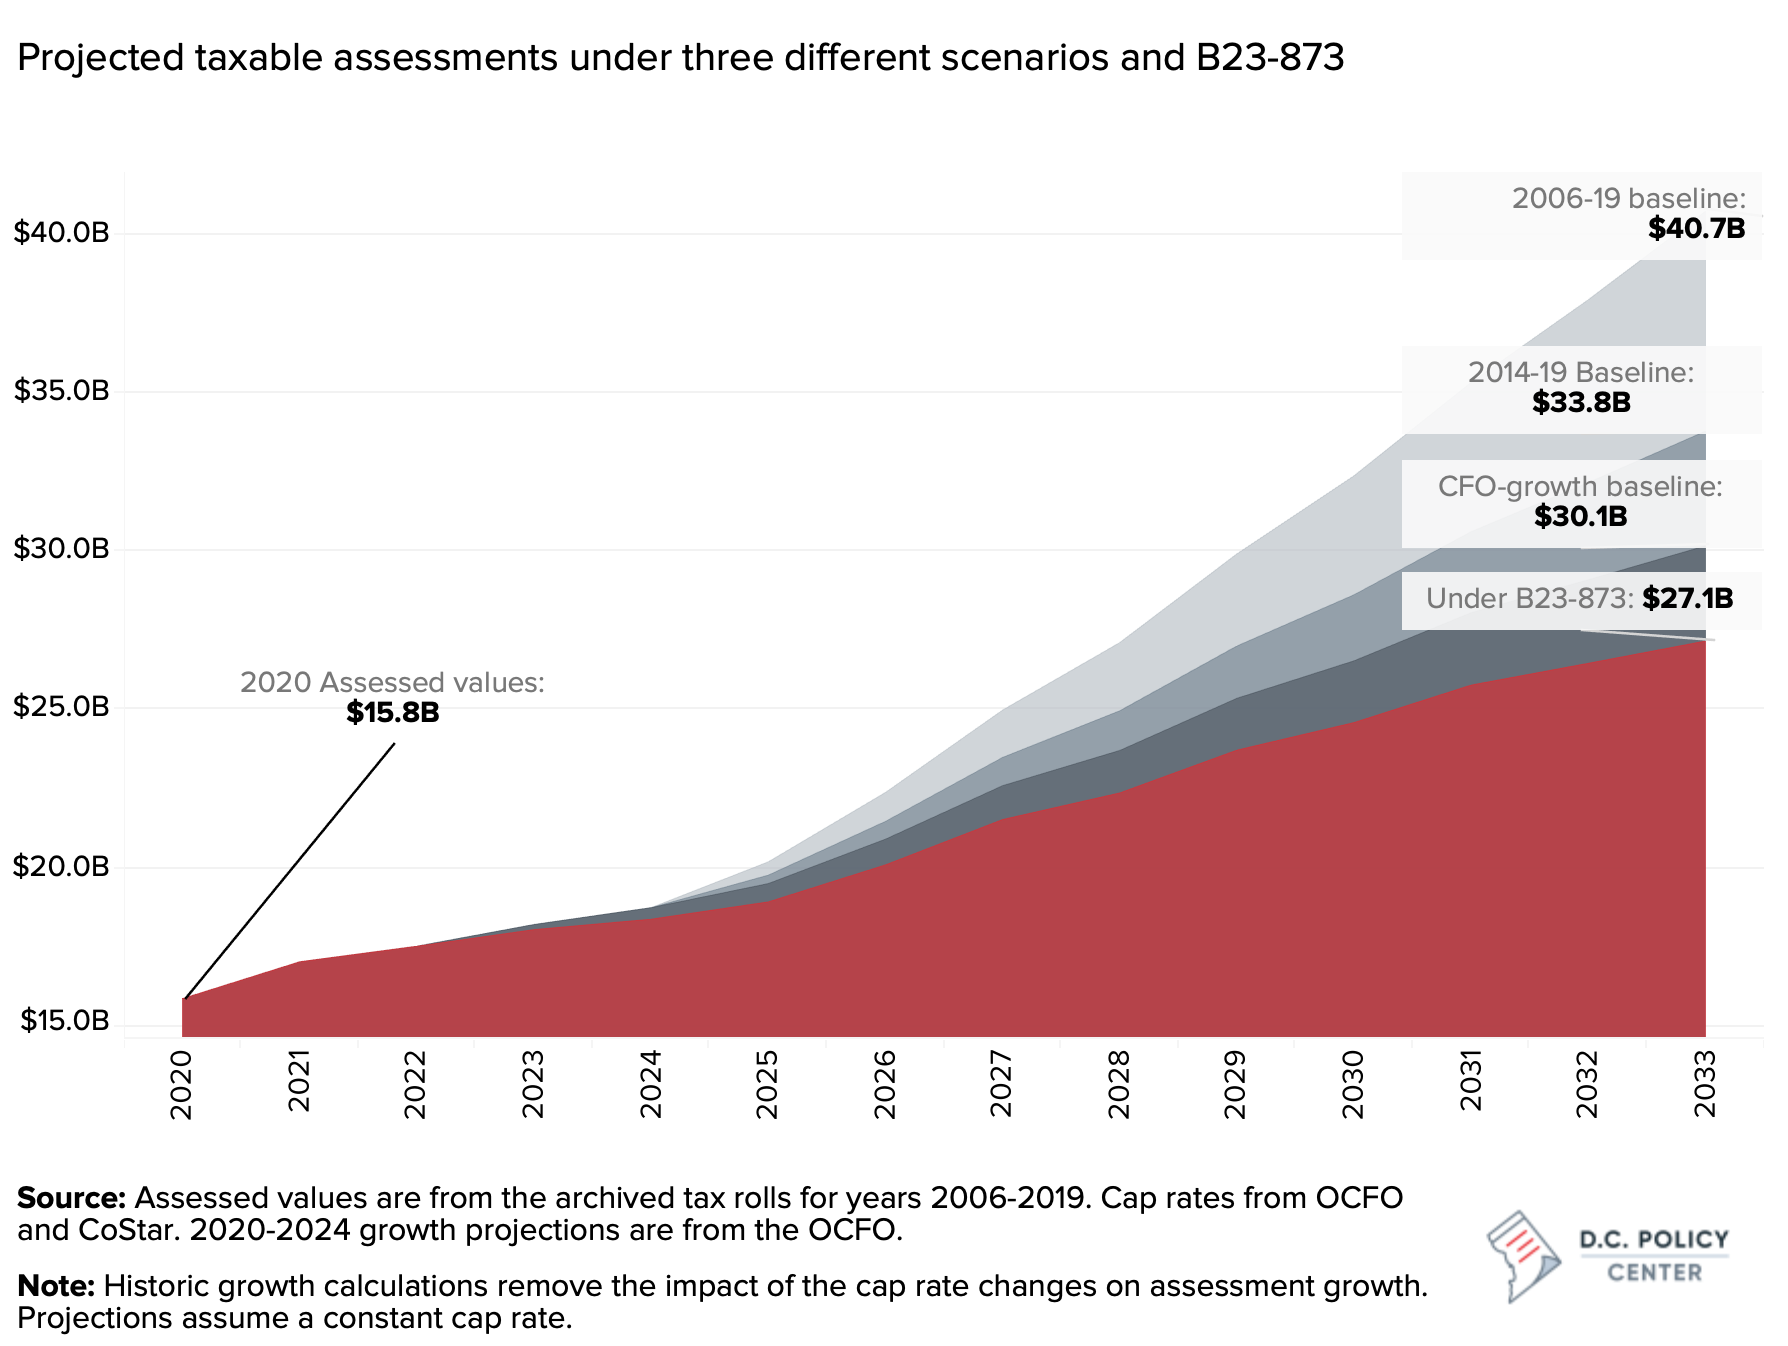
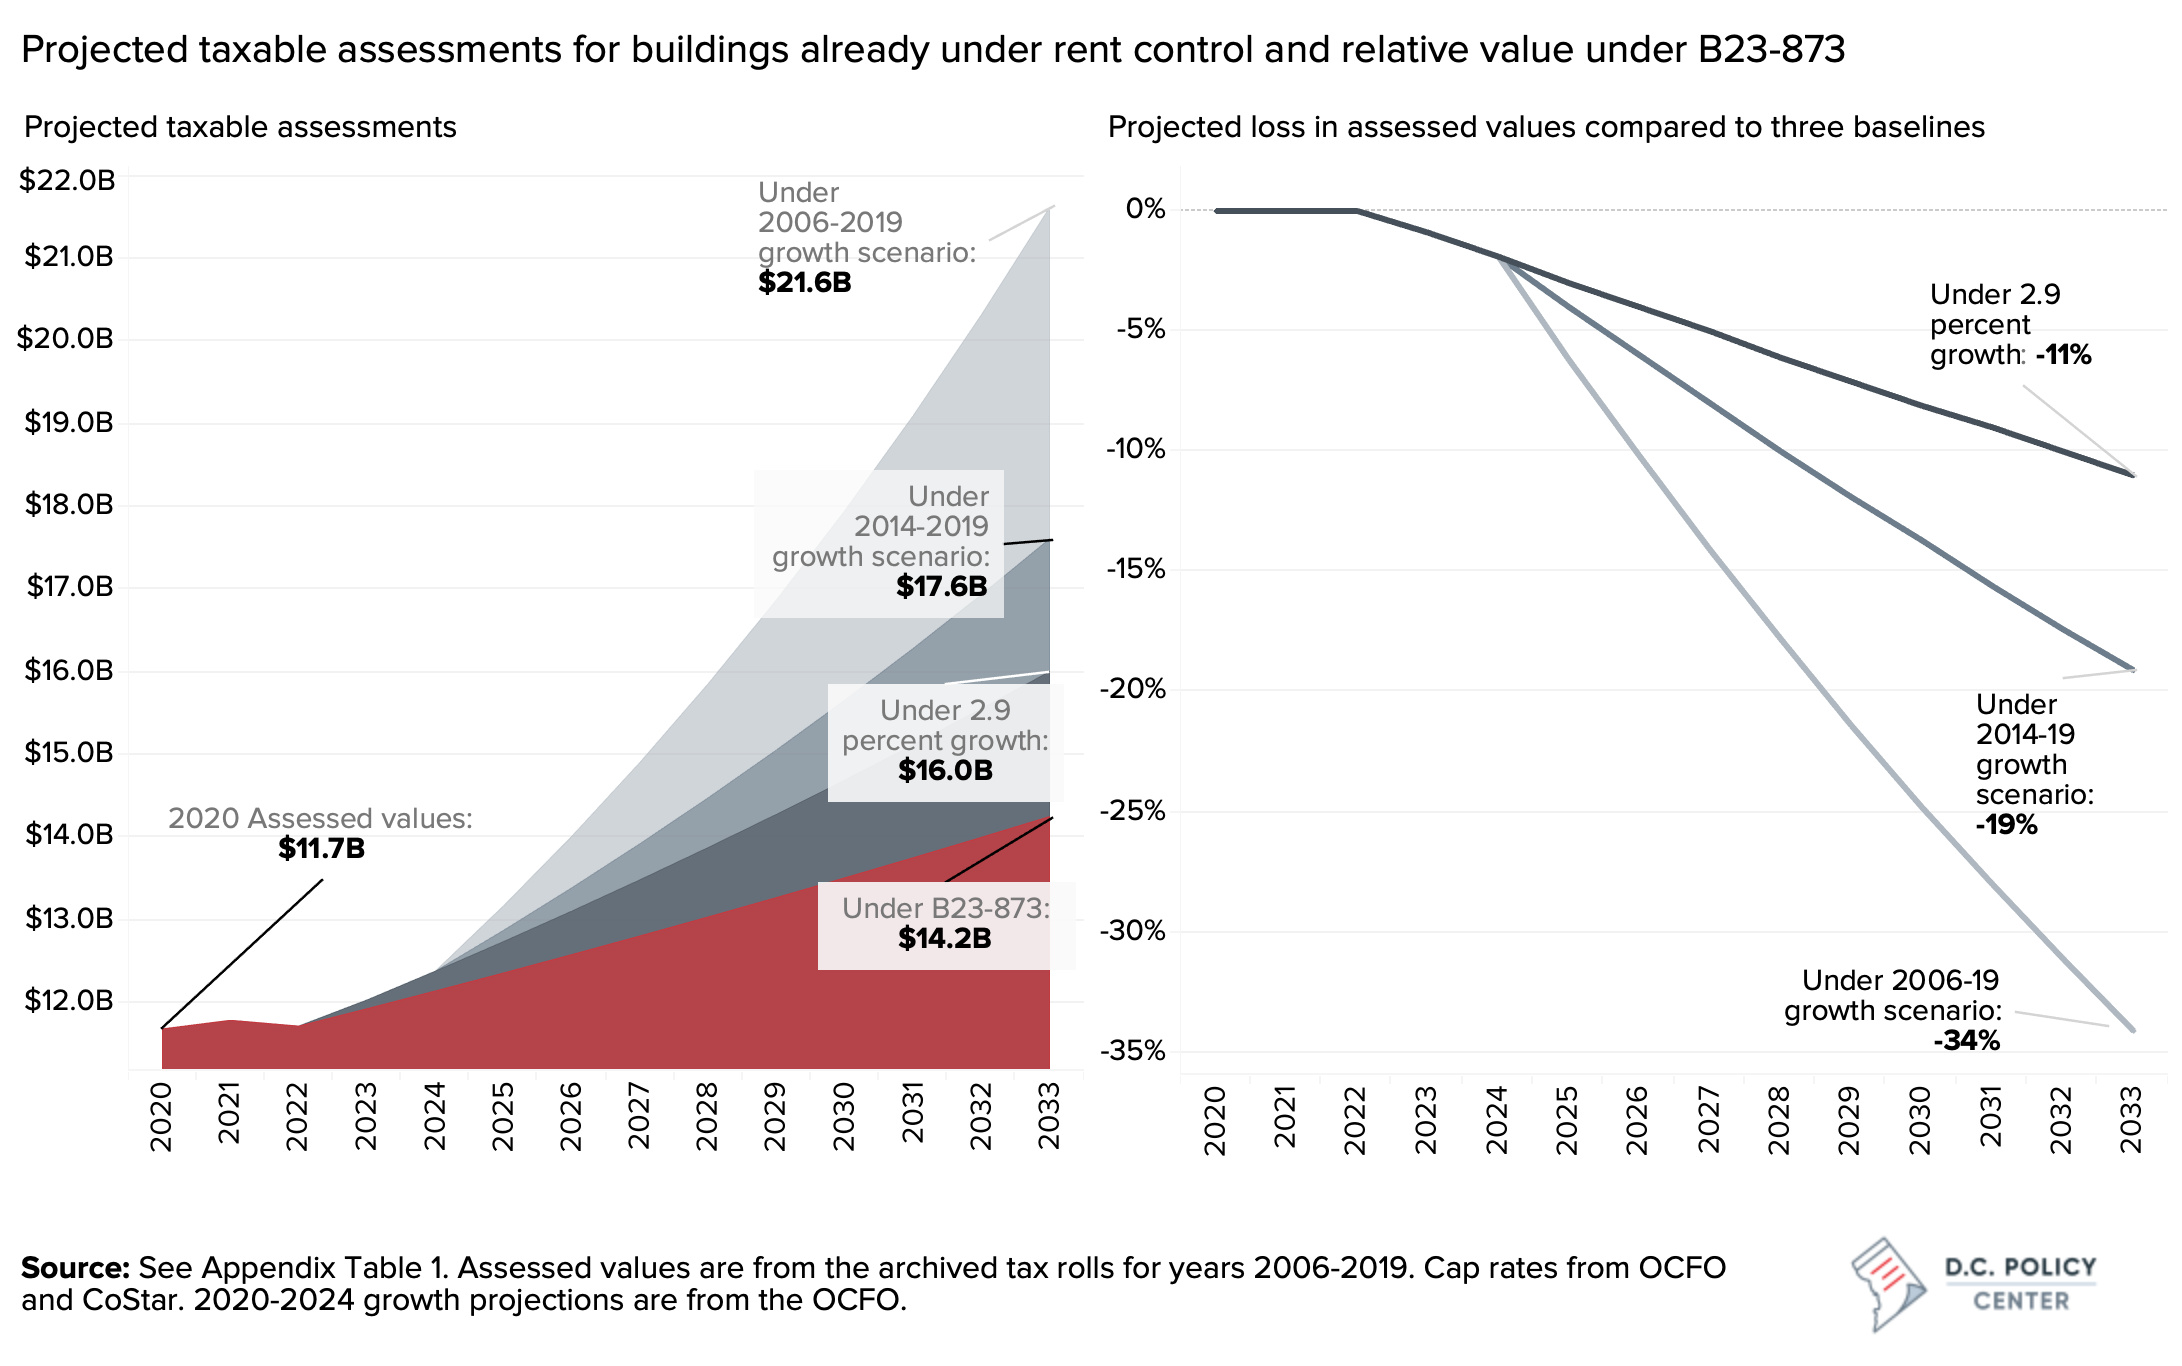
The results of these three scenarios are presented in the figure below. If assessments were to grow at the same rates as they did between 2006 and 2019, the assessed values of the properties currently under rent control would grow to $21.6 billion by 2033.[16] If the growth in assessments were similar to the rates we saw between 2014 and 2019, their values would grow to $17.6 billion. And if assessments were to grow at the rates projected by the OCFO for 2024, the value of these buildings would grow to $14.2 billion. In comparison, under B23-873, the assessed values would grow only to about $11.7 billion by 2033. These losses are the equivalent of a 12 percent loss in the most conservative scenario. But considering the assessment growth history in the city, B23-873 could wipe out anywhere from one fifth to a third of building valuations by 2033.
 l
l
Impact on buildings with four units
B23-873 proposes to limit exemption from rent control to providers with fewer than four units compared to the current threshold of fewer than five units. This provision would immediately expand rent control to an estimated 2,152 buildings across the city.
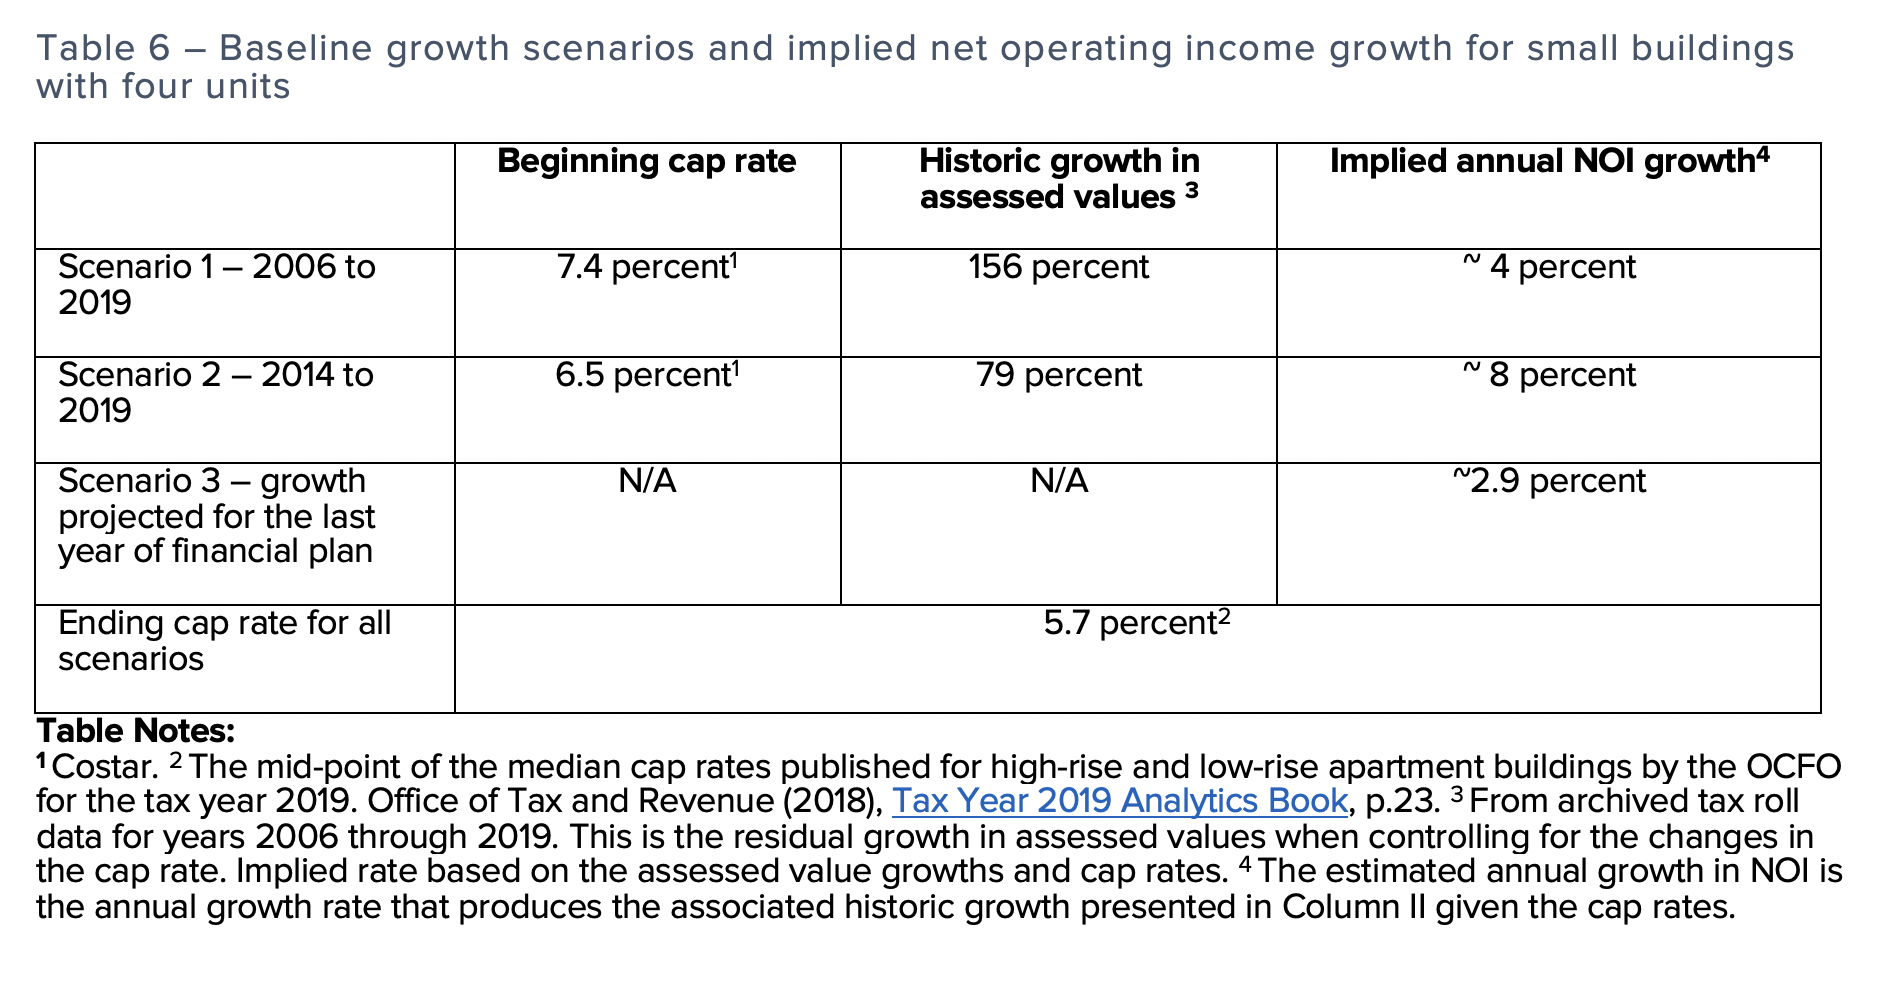
We have been able to track continuously assessment value changes between 2006 and 2019 for 2,145 of these buildings (more than 99 percent). Examination of their assessed values shows that among these small buildings, the combined tax assessments more than doubled over the 2006 to 2019 period, growing from $511 million to $1.3 billion (the equivalent of a 156 percent growth). And during the period from 2014 to 2019, their assessed value grew from $733 million to $1.3 billion (79 percent growth). That is, value appreciation was twice as fast for these small buildings during the 2014-19 period as compared to the 2006-19 period. This trend is profoundly different from the assessment growth trend for larger multifamily buildings currently under rent control.
For this group, the changes in the cap rates can explain 40 percent of the assessment value growth between 2006 and 2019 and therefore the implied net operating income growth in this period is 4 percent. In contrast, between 2014 and 2019, the changes in the cap rates can explain only 30 percent of the growth in assessed values; the remainder was driven by growth in net operating incomes, estimated at 8 percent for this period (Table 6).
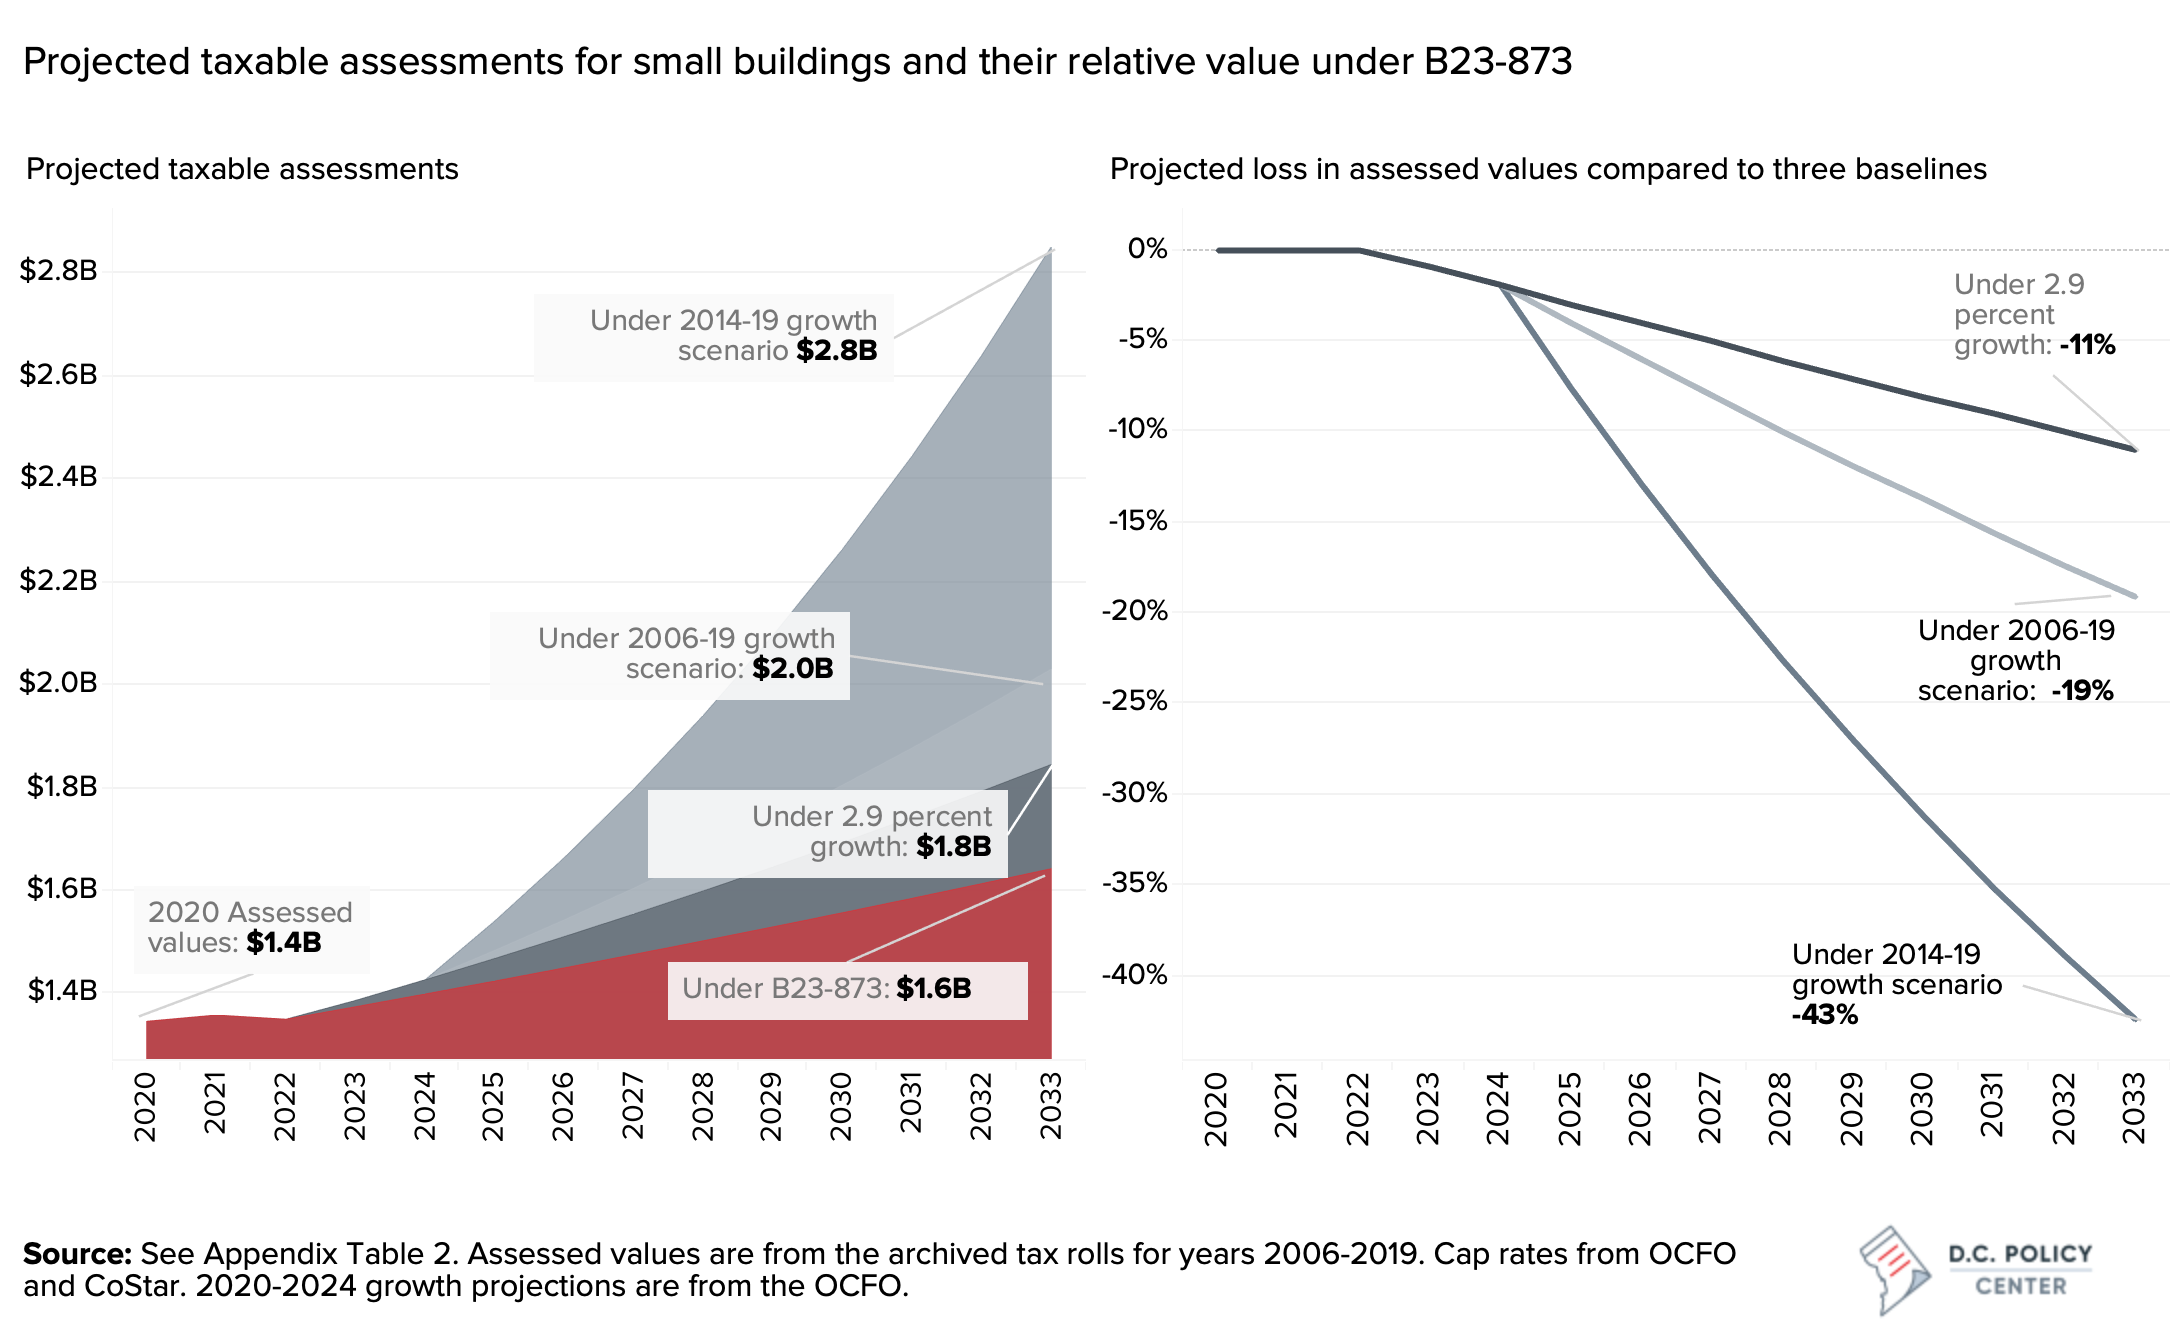
Under B23-873, the assessed values for small buildings is projected to grow from a base of $1.3 billion in 2020 to $1.63 billion by 2033. In contrast, growth in assessments at a rate similar to that observed between 2014 and 2019 would have yielded a combined assessed value of $2.9 billion. This is a value loss of 42 percent by 2033. Compared to the assessment that would have prevailed had operating incomes grown at rates observed between 2006 and 2019, B23-873 could depress values by nearly 20 percent. Even under the most conservative scenario, B23-873 could erase 10 percent of values by 2033.
Impact on large buildings built after 1977
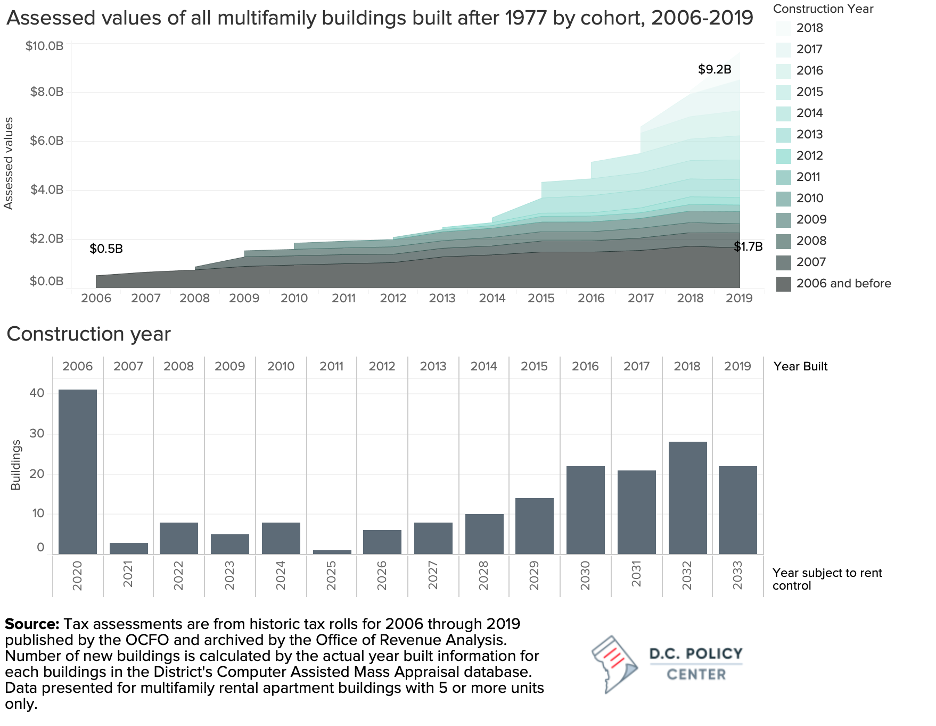
Analyzing the impact of B23-873 for multifamily buildings constructed after 1977 must take into consideration the tax base growth from new construction as well as when each cohort of buildings is subjected to rent control under the bill. Administrative data show 197 such buildings that gradually entered the tax records from 2006 to 2019. The assessment growth between 2006 and 2019 reflects not just the appreciation buildings experienced, but also the growth in the tax base due to these new buildings. Between 2006 and 2019 the total assessed values of multifamily apartment buildings constructed after 2006 grew from $0.6 billion to $9.2 billion, but 80 percent of this growth was due to the base growth (Figure 9, top panel).
Additionally, each cohort of buildings would be subject to B23-873 in different years, and therefore their valuation would be altered in different years. In the first year of implementation, only 44 buildings would fall outside the 15-year exemption window and therefore become rent-controlled. This number would grow steadily through 2033 (Figure 9, bottom panel).
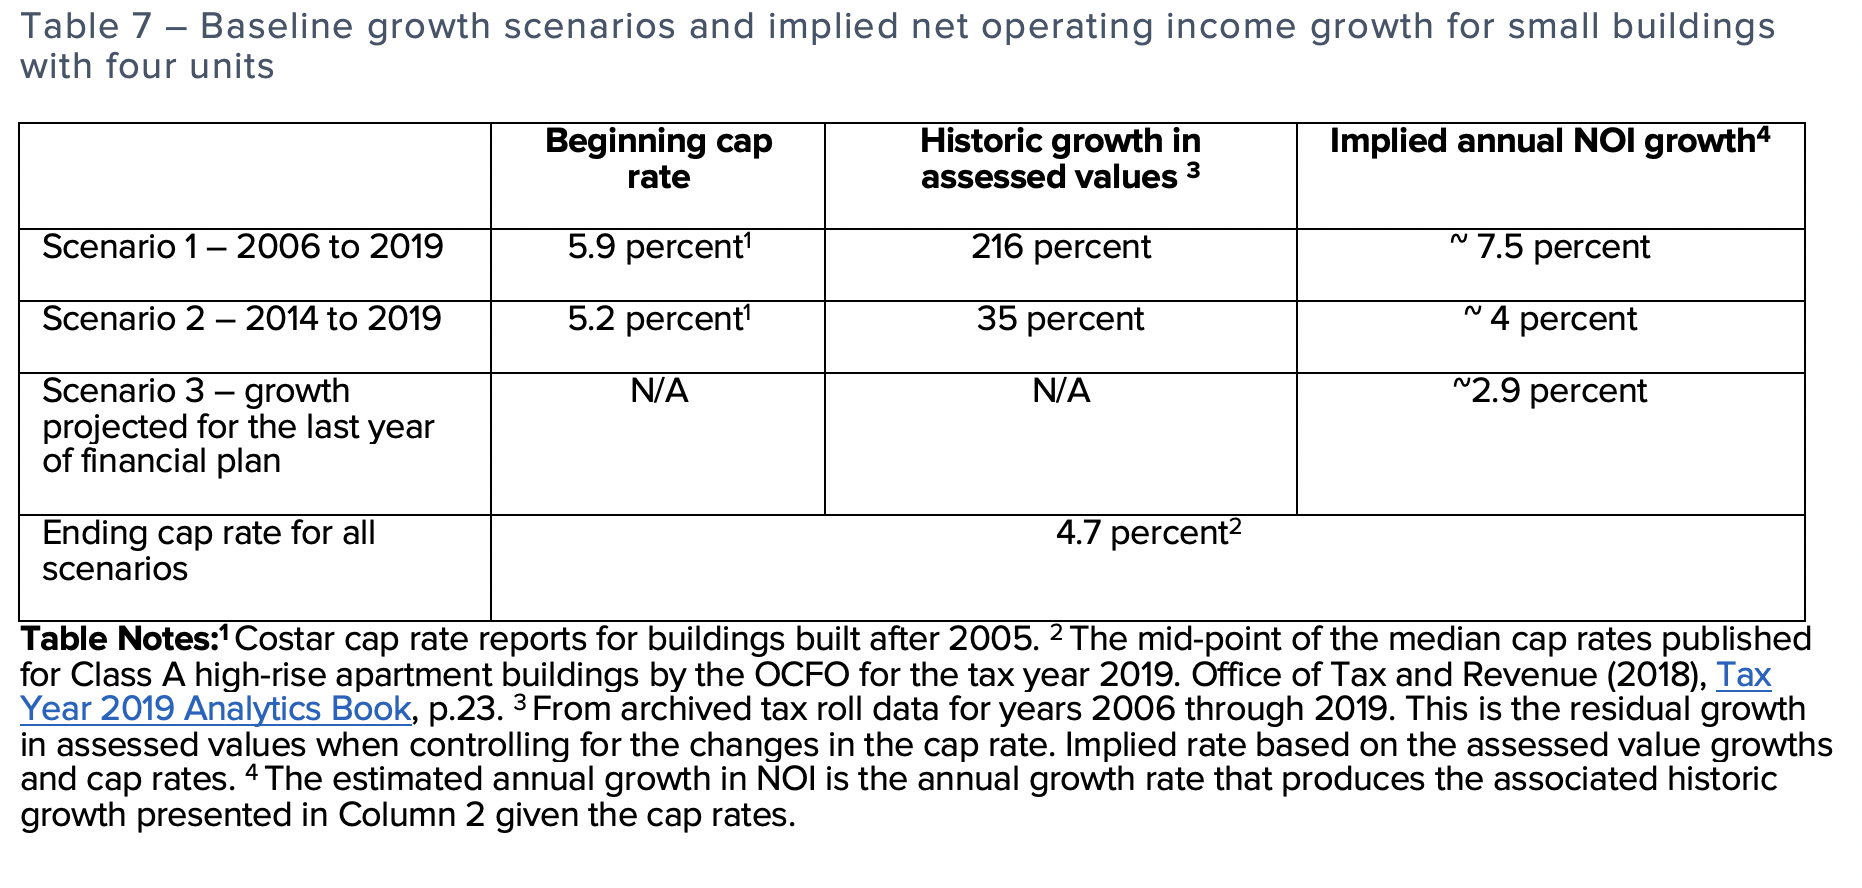
To ensure that the measured growth rates reflect only the value appreciation and not the base growth, the analysis keeps the assessment base constant for the reference period. Consequently, the assessment growth calculation for the 2006-2019 period reflects the value appreciation for the 44 buildings built before 2006 and therefore were continuously on the tax rolls between 2006 and 2019.[17] The assessed values of these 44 buildings increased by 149 percent between 2006 and 2019, and the gradual decline in the cap rates accounts for 30 percent of the assessment growth. This implies that net operating incomes for these 44 buildings grew by approximately 7.5 percent on average each year.
Similarly, the 2014-2019 growth rate calculations use data from 107 properties that were constructed before 2014 and were continuously on the tax rolls between 2014 and 2019.[18] The assessed values for these properties grew from $3.2 billion to $4.7 billion over these five years, and the gradual decline in the cap rates can explain 38 percent of this appreciation. Therefore, the implied average annual growth in net operating incomes of these properties was approximately 4 percent during this period (Table 7).
Because buildings built after 2005 would gradually roll into the rent-controlled stock under B23-873, only a small share of assessed values would be continuously depressed for the 13-year projection period. Under B23-873 the assessed values of impacted properties would grow from $2.9 billion in 2020 to $11.2 billion in 2033, but most of this growth would be associated with the expansion in the number of rent-controlled buildings.
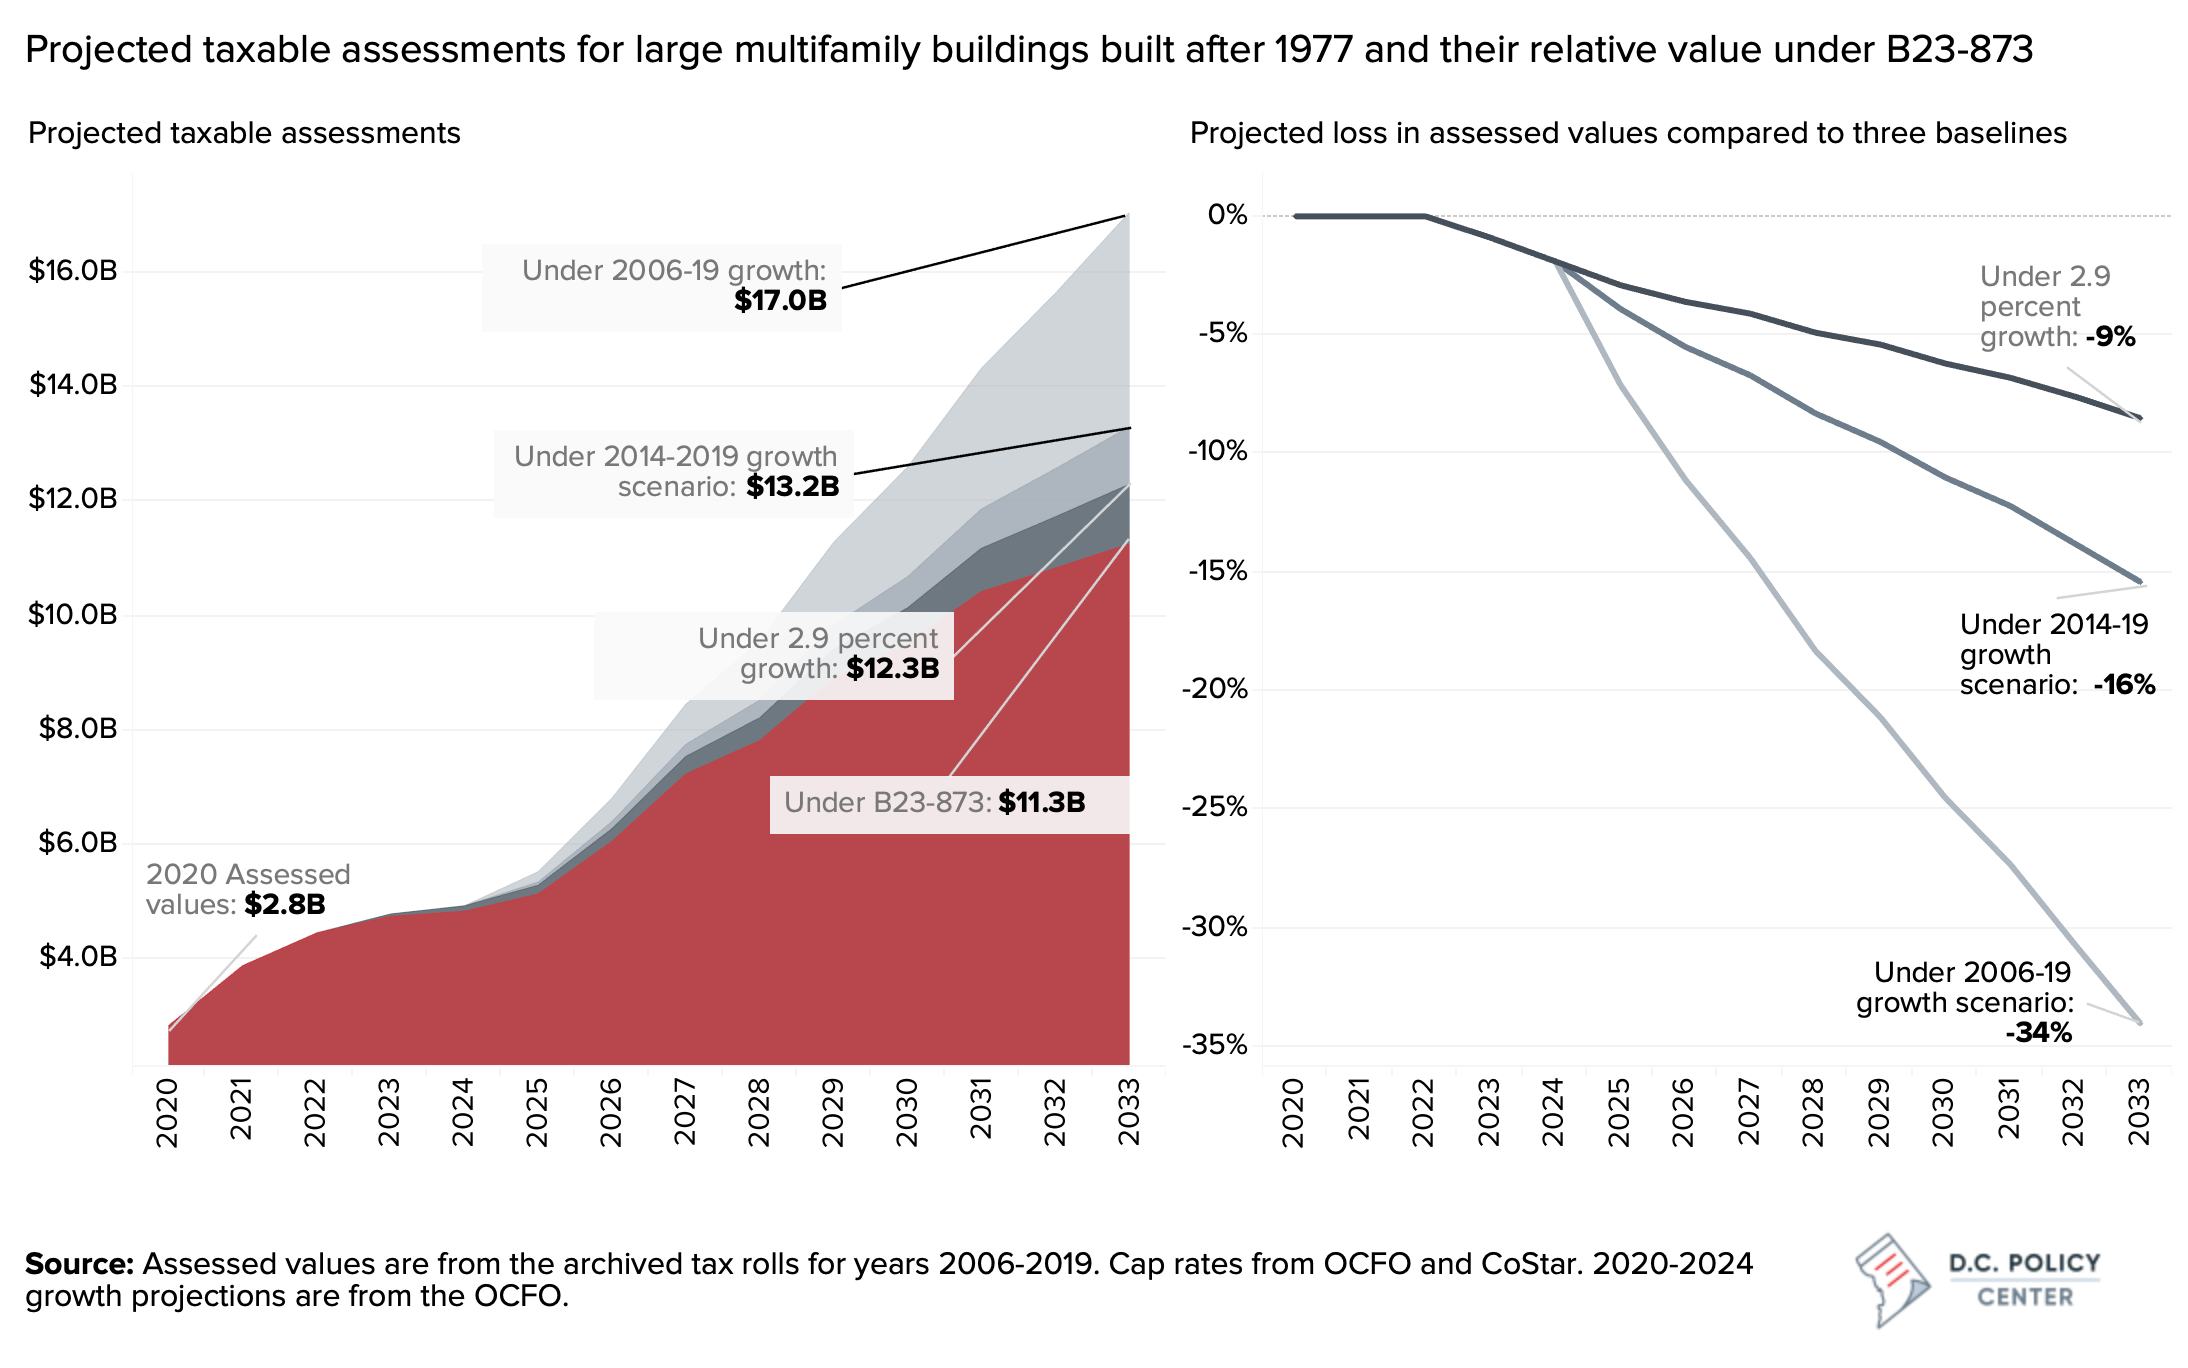
Using the same base expansion but 2006-2019 growth patterns yields a combined assessed value of $17.9 billion. This is the equivalent of a potential value loss of 34 percent under B23-873. Compared to the assessment that would have prevailed had operating incomes grown at rates observed between 2014 and 2019, B23-873 could depress values by nearly 15 percent. Under the most conservative scenario, B23-873 would erase 8.5 percent of values by 2033.
Tax revenues under B23-873
The direct impact of depressed assessed values under B23-873 is revenue loss for the city. In all the scenarios presented, the losses would begin at modest levels but would grow to substantial amounts over the years. The revenue losses in the first few years would be modest because the pandemic-induced recession, with or without rent-control, is projected to put a negative pressure on rents, resulting in modest to negative taxable assessment growth between 2020 and 2022. As more years pass and more buildings become subject to rent control, the losses would grow faster because of (a)the compounding impact of rent growth restrictions, and (b) the growing rent-controlled stock. We estimate that by 2033, B23-873 could reduce the annual tax revenue from the rental apartment stock by anywhere between $26 million (compared to the 2.9 percent growth scenario) and $115 million (compared to the 2006-2019 growth scenario).
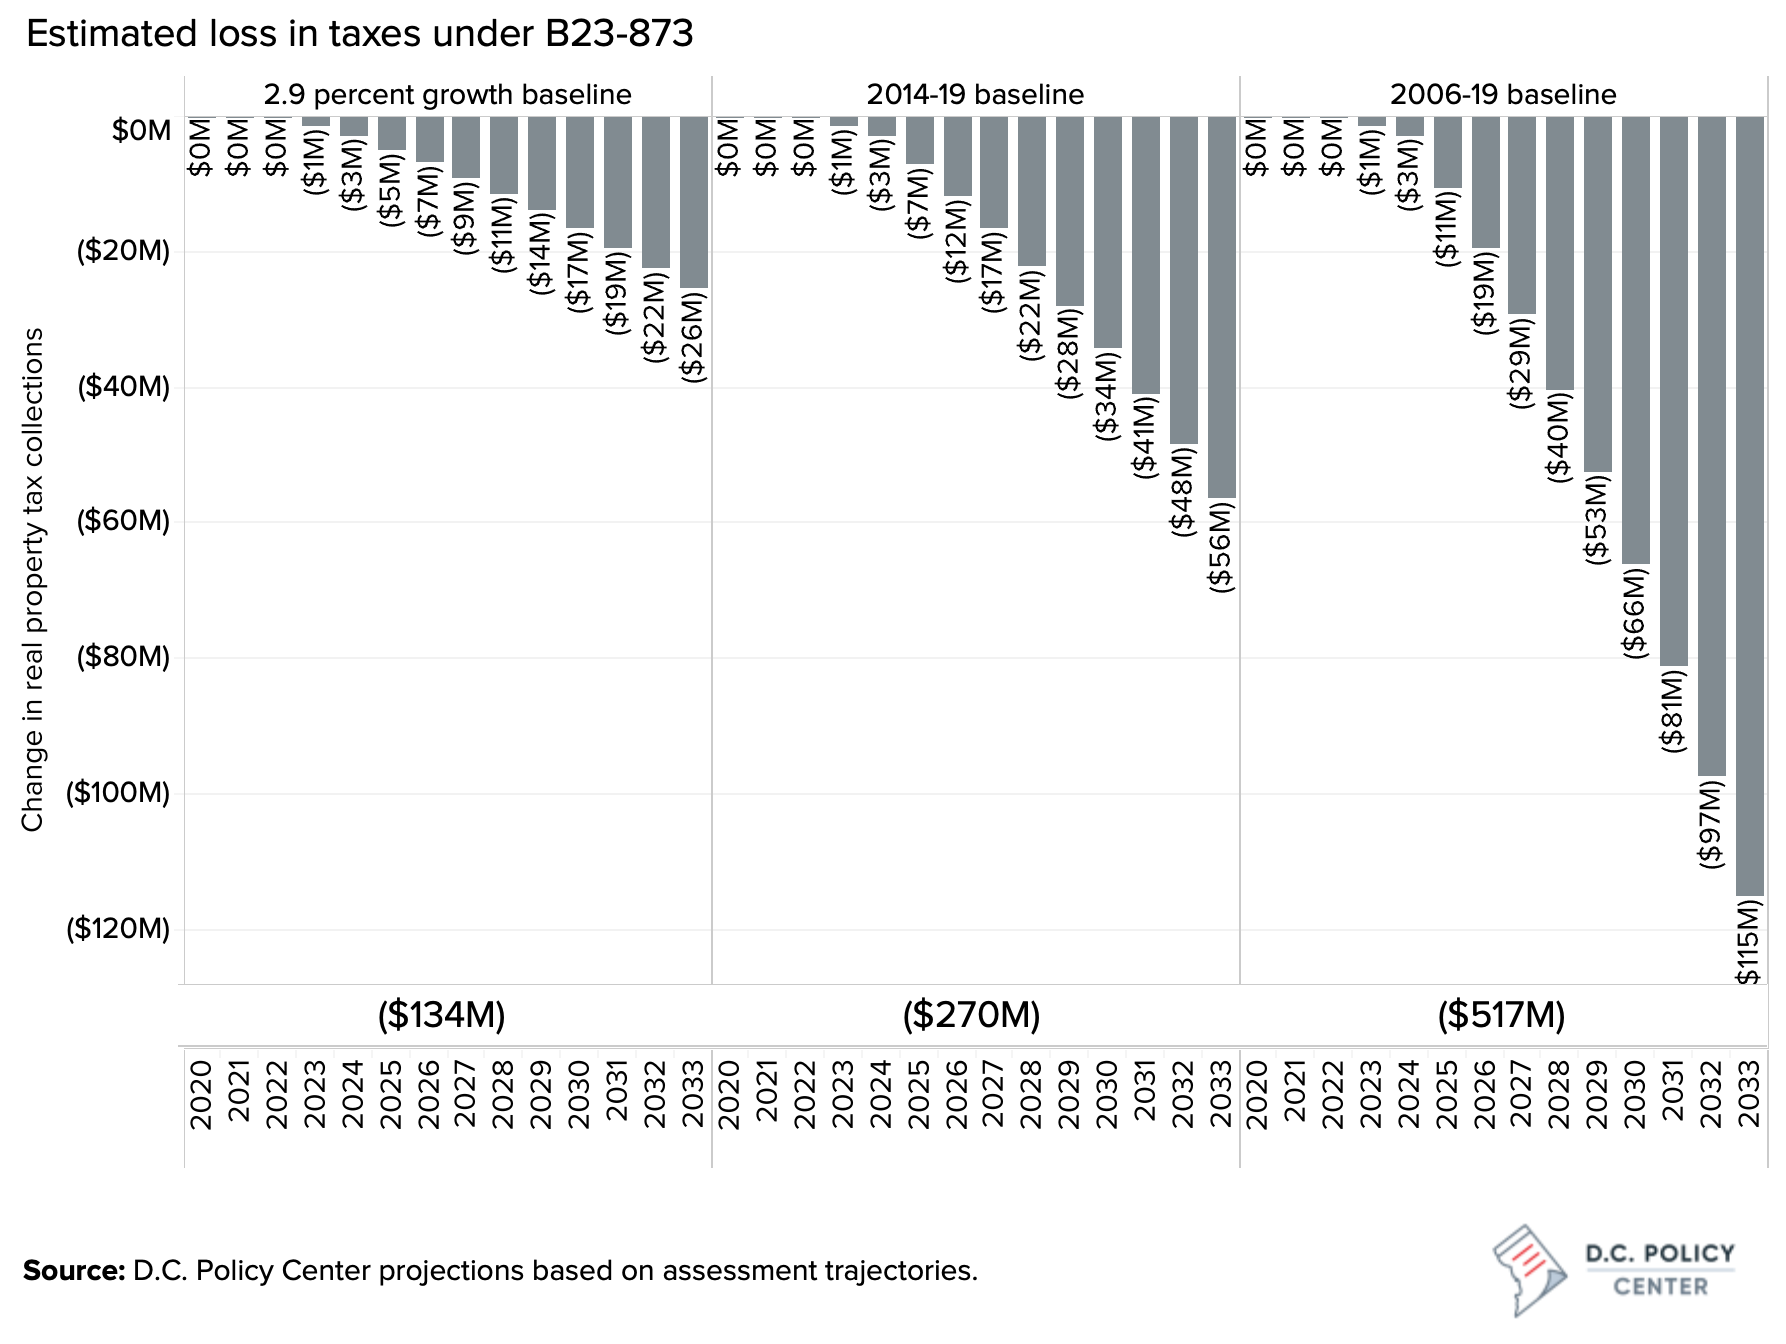
The combined losses over the projection period would also be significant. Even under the most conservative scenario, where property values would grow at 2.9 percent, one would expect a revenue loss of a combined $134 million over the next 11 years. To put this number in perspective, this is greater than the total real property taxes paid by this base in 2020 (an estimated $112 million). And if the District’s future assessment growth were to mimic its experience between the 2006-2019 period, Bill 23-873 could depress revenue by over half a billion dollars between now and 2033.
<< Back: Main publication page | Next: Impacts on the future of housing>>
Notes
[1] This estimate is based on CoStar data on rent history filtered for multifamily buildings with five or more units built before 1977.
[2] Class A properties are generally newer properties built within the last 15 years with top amenities, high-income earning tenants and low vacancy rates..
[3] Per Delta Associates.
[4] See, for example, this study from the Office of the Chief Financial Officer.
[5] This is the average growth across the city, and does not reflect the experiences of individual housing providers or tenants.
[6] These trajectories are based on certain assumptions about how the markets behave between now and through the end of the pandemic. The CPI estimates for 2020-2024 are taken from the OCFO’s estimates published in the September 2020 revenue estimates. The rent growth projections through 2025 are from CoStar. In the longer term, both the CPI and rent growth are projected to return to their historic averages.
[7] For example in 2030, only 60 percent of the units that are not currently under rent control would be brought into rent control under B23-873. So the estimate presented in figure 6 assumes that 62 percent of the units grow at the slower rate dictated by B23-873 this year and the remainder will grow at the baseline rate.
[8] For example, when New York City adopted its universal rent control laws, the sale prices for multi-family buildings impacted by the change have reportedly declined by over 17 percent.For details, see Kathleen Howley, “Rent Control Law Sends New York Building Values Tumbling,” The Wall Street Journal, June 25, 2019.
[9] Cap rates could be different for different buildings. The OCFO publishes six different cap rates, three for high rise buildings and three for low rise buildings based on building location. Buildings with LIHTC support have adjusted cap rates.
[10] Our analysis keeps the cap rates constant through our projections.
[11] The net operating incomes could futher be depressed if the various petition processes that allow housing providers to increase rent in order to make investments in their buildings become impaired under the bill.
[12] It is very difficult to estimate the CPI over long periods of time and few sources put longer term inflation rates in the US at anywhere between 1.7 percent to 2 percent See the OECD, IMF, and Federal Open Market Committee estimates for US. And the average rate of annual inflation was 1.77 percent between 2010 and 2020.
[13] Therefore, we expect our projections to look like the OCFO’s analysis for the financial plan period. To the extent that our projections would be different from the OCFO’s fiscal impact analysis of this bill, this difference will be driven by the estimated growth rate in net operating incomes under B23-873.
[14] The implied annual growth in net operating incomes is 3.8 percent.
[15] This is a much higher rate than the rent growth during this time (an average of 2.8 percent for rent-controlled buildings), because it shows the cumulative impact of rent growth and operating cost savings.
[16] When cap rates are constant, which is what is assumed in this exercise, the assessments are entirely driven by NOI growth. The detailed on the variables used for the projection model are available in Appendix Table 1.
[17] We found 66 taxable properties that were continuously on the tax rolls between 2006 and 2019, but some of these were not yet multifamily buildings in 2006. Some were vacant lots and others were under different use. We exclude those 19 properties from our calculations.
[18] There are 136 properties that were continuously on the tax rolls between 2014 and 2019. We exclude 29 properties that were vacant lots or were under some other use in 2014 from our analysis.