WMATA has an impending budget shortfall of $290 million. To reduce this shortfall, the agency has proposed service cuts to multiple bus routes in the region beginning July 1 of this year. These cuts could mean a decrease in bus frequency, route modification, or the full elimination of bus routes. Almost all routes on the chopping block are servicing Virginia and Maryland, though one route in D.C. (37 Wisconsin Ave Limited) could also be gone.
Route modifications and service reductions might inconvenience some riders, but the full elimination of routes could mean costlier or longer commutes, or even job losses for the workforce that relies directly on WMATA for their daily commutes. If WMATA follows through with the full elimination of service, who are the riders who will shoulder these costs?
To answer this question, I looked at the routes that will completely disappear should the eliminations come to fruition. First, it turns out these are routes with very low weekday ridership numbers. This would seem a good justification for dropping the routes as on average, the routes serve 541 passengers per weekday, compared to an average of 12,527 passengers per weekday on the S2/4 that serves 16th St NW in D.C.
In order to estimate the potential number of riders who would be left without any viable public transportation alternatives, I first identified all bus stops along the routes that were at risk. To do so, I separated out all bus routes discussed in the WMATA budget proposal by querying a dataset containing all service routes in the region. From this, I was able to select individual Metrobus stops along these routes that would be eliminated if the routes were shelved. I excluded bus stops that serve alternative routes, as these could offer travel alternatives to riders who currently board at those stops. Thus, the bus stops I identified do not have alternative routes serving them, and will functionally disappear should the proposed cuts take effect.
To estimate the potential riders, I examined all areas that are within a normal walking distance of each bus stop (referred to in the chart as the “walkshed”). While there is some debate to what is considered a “walkable” distance, 0.25 miles (or about a 5 minute walk) is often considered a common limit for bus routes.
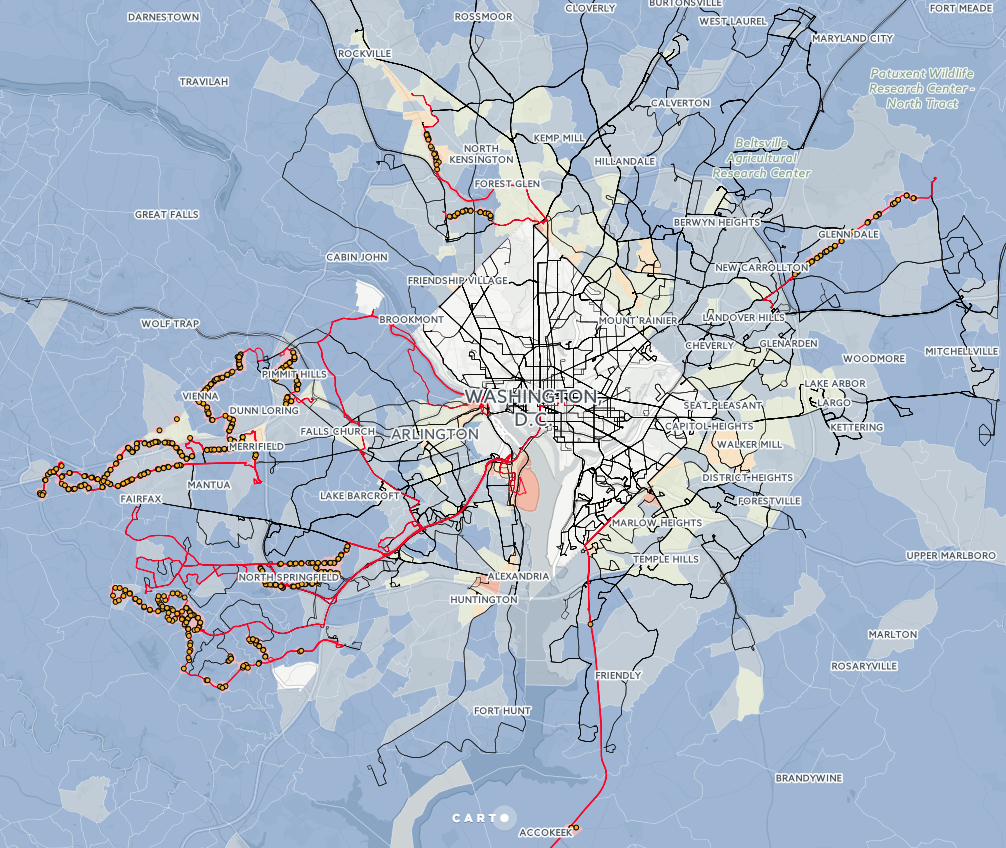
Last, I turned to the “Means of Transportation to Work” dataset from the Census Bureau’s 2015 American Community Survey (ACS) to estimate bus ridership, finding that approximately 2,154 riders will be left without any feasible bus options should these routes be eliminated (with a margin of error of ± 121 riders). The interactive map below lets you display different layers that show the proposed bus routes being eliminated, the quarter-mile walking distance areas for affected bus stops, and the percent of commuters using public transportation by Census tract.
Click here to view the map in a new window
Who will be affected by Metrobus route cuts
Who are the riders that would be affected by the proposed Metrobus route cuts? The ACS data tell us that most are between 34 and 51 years old (with a median age of 44), a bit older than the typical bus rider in the metro area (median age of 39.) The potentially affected riders have a relatively wide range of household incomes—from $51,391 to $123,225 (with a median of $87,308). This suggests that most people losing their bus service will be from middle-income families, and that those affected appear to come from higher-income households than the typical Metrobus rider.
Among all bus riders in the metro region, household incomes have a much smaller range—from $49,279 to $82,871 (with a median of $66,075). This indicates bus riders among the routes at risk for elimination are to some extent better off compared to the typical bus rider in the region (median household income of $45,224).
The data also suggests that that 56 percent of the potentially affected riders are white, 16 percent are black, 16 percent are Asian, and 11 percent are of Hispanic origin. This means that potentially affected riders seem more likely to be white or Asian compared with all bus riders in the metro region, as shown in the following chart.
In terms of industry, an estimated 54 percent of riders affected by the proposed cuts work in an office environment, which includes public administration (government) and professional (engineering, management, legal, etc.) industries. This compares to 29 percent of all bus riders. The second largest industry is education and health, at 11 percent, compared with 13 percent of all bus riders. A combined 11 percent of potentially affected riders work in with the food/accommodation services (7 percent) or retail industries (4 percent), compared with a combined 30 percent of all bus riders.
We know that in general, middle- and low-income workers, including service and retail workers, are more likely to rely on Metrobus than Metrorail, and there have been concerns that minority and low- or middle-income workers would be disproportionately affected by these service cuts. However, a closer look at the data shows that in the case of these particular cuts, white riders and those in higher-income households are more likely to be directly affected. Additionally, food and retail workers are underrepresented among the riders that will potentially be directly affected. However, it is still possible that many of those who are affected will have relatively few other transportation options for their daily commutes.
Conclusion
The elimination of bus routes affects real people. By putting on a number on those affected, we can quantify the direct impact WMATA is making in its proposed 2018 budget, which takes effect July 1 of 2017. The data suggests that WMATA risks cutting the only viable public transportation available to roughly 2,200 riders, who will have very few alternative travel options.
Nevertheless, data shows that as far as cuts go, these do not target economically vulnerable areas; people who live on these routes have a median income almost $20,000 higher than bus riders as a whole in the metro region. These proposed cuts are potentially minimal especially when compared to proposals such as shutting down Metrorail stations east of the Anacostia River, where an estimated 140,000 people would be cut off from the heart of D.C.
About the data and methodology
Ridership data provided by WMATA, 2016. Demographic data obtained from the U.S. Census Bureau’s American Community Survey estimates for 2015. Current Metrobus routes and bus stops provided by D.C. Open Data, 2016. Walksheds were calculated using road network data provided by U.S. Census Bureau’s TIGER/Line Products, 2016. Visit my GitHub page for code used in each visual.
Ridership data suggested low ridership numbers for all routes on slate for elimination. However, one exception appeared in the J1 bus route in Maryland. Further investigation shows that WMATA’s Metrobus data lumps ridership numbers for the J1 together with the much more popular J2, which runs almost exactly along the same route, except for a small section containing about 10 stops. It is impossible to separate them. For this reason, I exclude J1 from my historic ridership graphics and averages. I also exclude the D.C. bus route (37 Wisconsin Ave Limited) as this line has multiple alternatives that run along major portions of its route.
My estimate adds the population of likely bus riders across different census tracts that fall within the quarter-mile walkshed. There are two key assumptions that drive this estimate: First, I assume that public transit users are bus riders because the bus routes identified do not have overlap with Metrorail services, indicating bus is the only available option. Second, I assume that the population is evenly distributed throughout a census tract.