My School DC has released the results of the 2023 common lottery, which matches students who newly enroll in pre-kindergarten, at a public charter school, or at a District of Columbia Public Schools (DCPS) school aside from their in-boundary option. Overall, the number of applications increased to 22,912 in 2023, up from a pandemic dip to 19,926 in 2021 but still 9 percent down from pre-pandemic levels (25,198 applications).
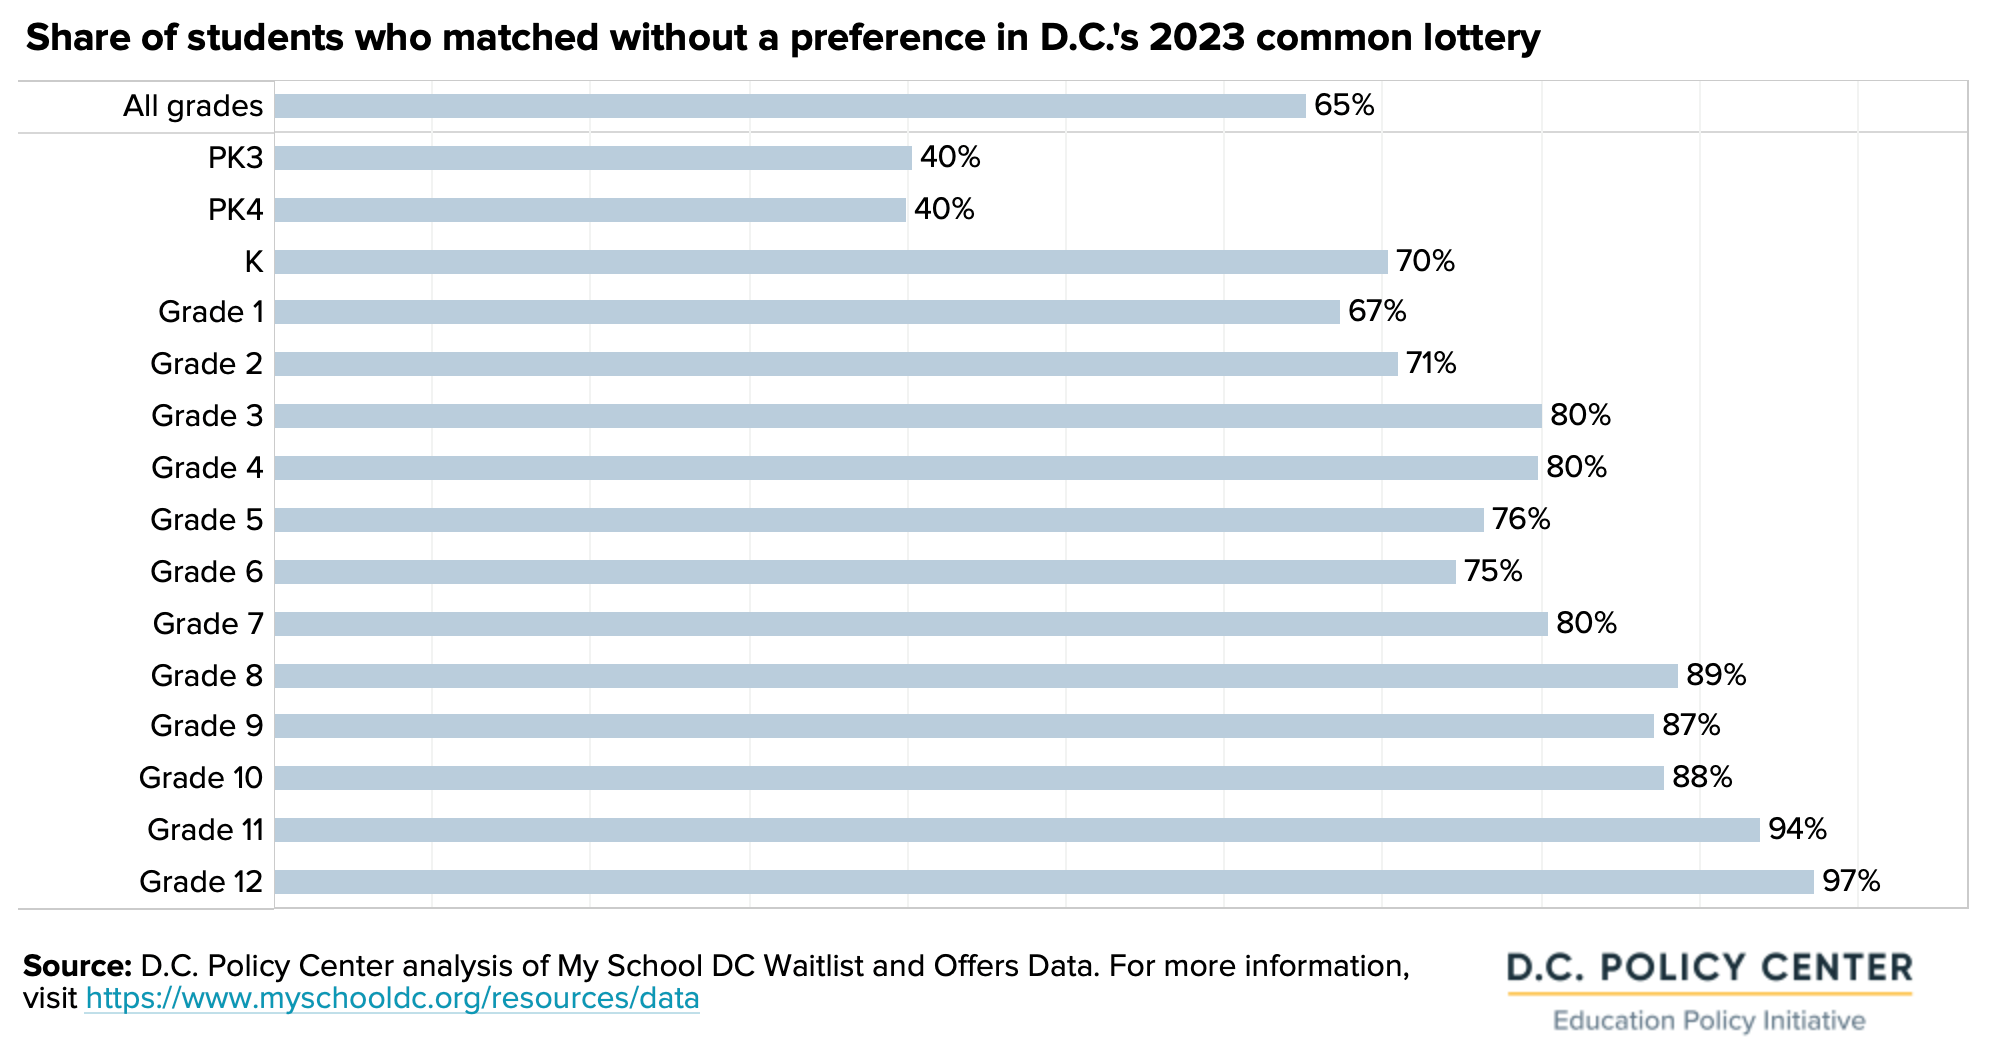
In the 2023 lottery, 74 percent of applicants received a match, with the remaining applicants on waitlists for their top-ranked schools. For the nearly 17,000 applicants who received a match, the majority (65 percent) did so without any preference in the common lottery. However, about a third (35 percent) of applicants who matched did so with a preference, including broad categories of early action pre-kindergarten at certain DCPS schools, equitable access for students designated as at-risk, guarantee spots, in-boundary, proximity, sibling, staff and founder, and transfers. For more information on how these preferences are defined, visit My School DC’s Key Terms and see the table below for how D.C. Policy Center categorized them.
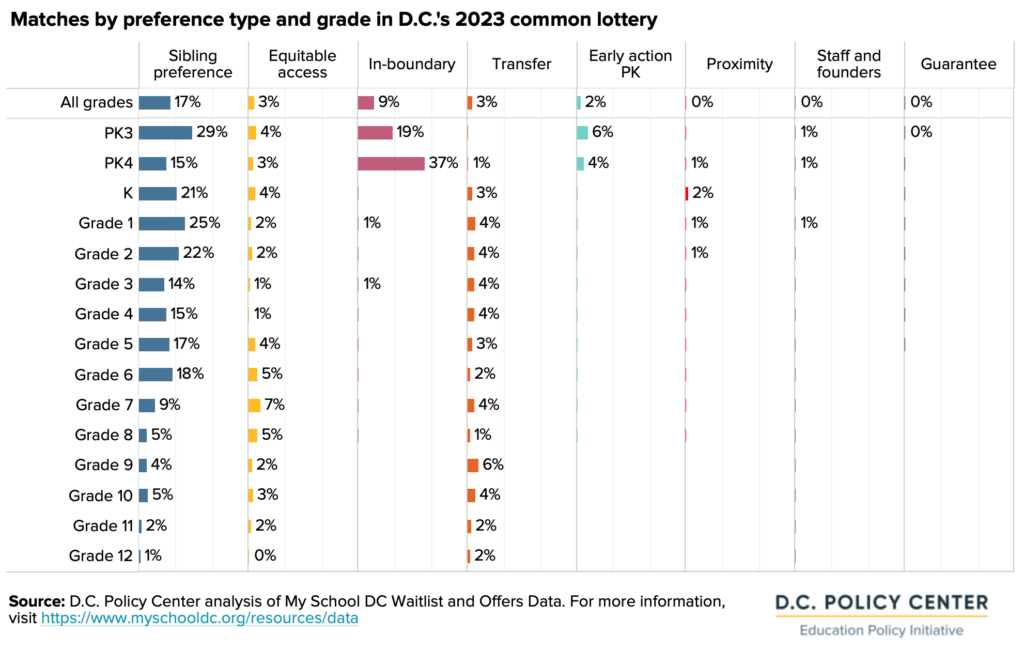
Across all grades, sibling preference was the most common type of preference that led to a match at 17 percent of all matches. Living in-boundary for a DCPS school accounted for the next largest group at 9 percent of all matches, followed by equitable access for students designated as at-risk (3 percent of all matches) implemented by 29 schools (this calculation of equitable access includes the 242 seats matched through a preference as well as the 341 seats matched through designated seats to give a comprehensive look).The remaining 6 percent of matches were due to other preferences (guarantee, proximity, staff and founders, or transfers).
Preferences become less important for matches in upper grades. Among matches for pre-kindergarten for age 3 (PK3), 60 percent of matches went to applicants with a preference, mostly commonly sibling (29 percent of matches) and in-boundary (19 percent of matches). By comparison, just 13 percent of matches in 9th grade went to applicants with a preference, most commonly transfers (6 percent) or sibling (4 percent) or equitable access (3 percent).
Data for this analysis come from My School DC’s Historic Lottery Data.
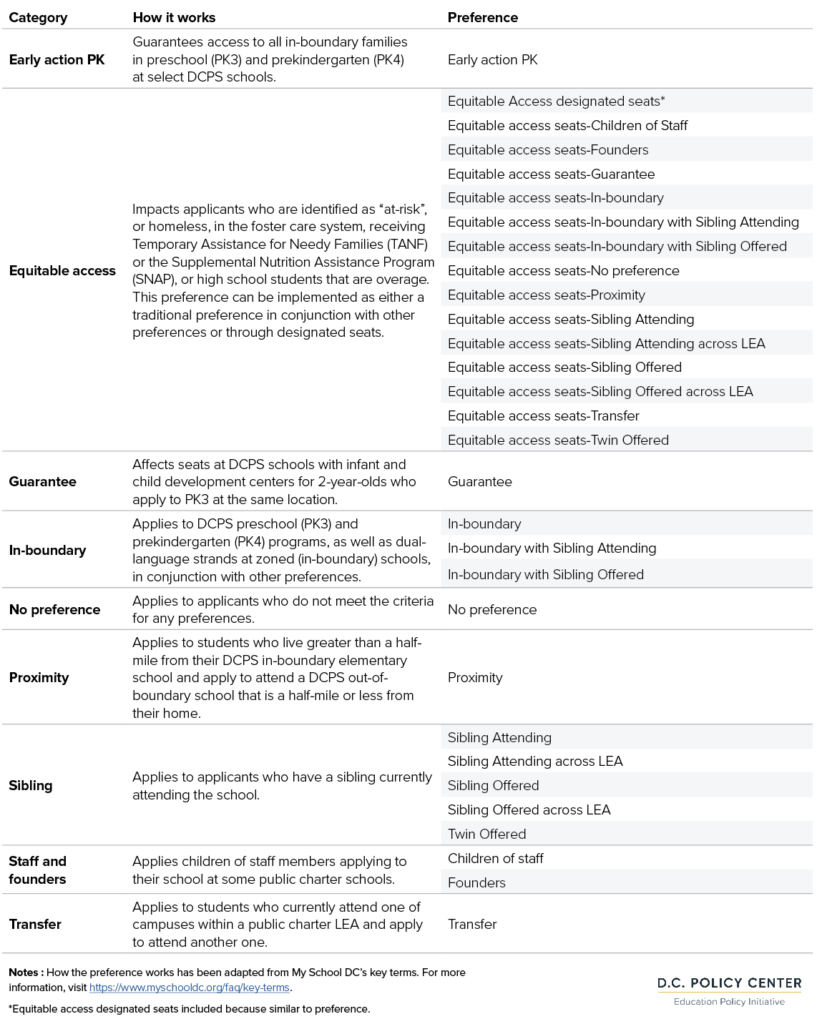
Categories of lottery preferences for D.C. Policy Center analysis