
On Wednesday, December 7, 2022, Education Policy Initiative Director Chelsea Coffin testified before the D.C. Council Committee of the Whole, at its public oversight meeting. Her testimony focuses on changes in learning outcomes by cohort to emphasize the need to focus on both math and English language arts in recovery from the pandemic as well as look at student progress longitudinally. You can read her testimony below, or download a PDF copy.
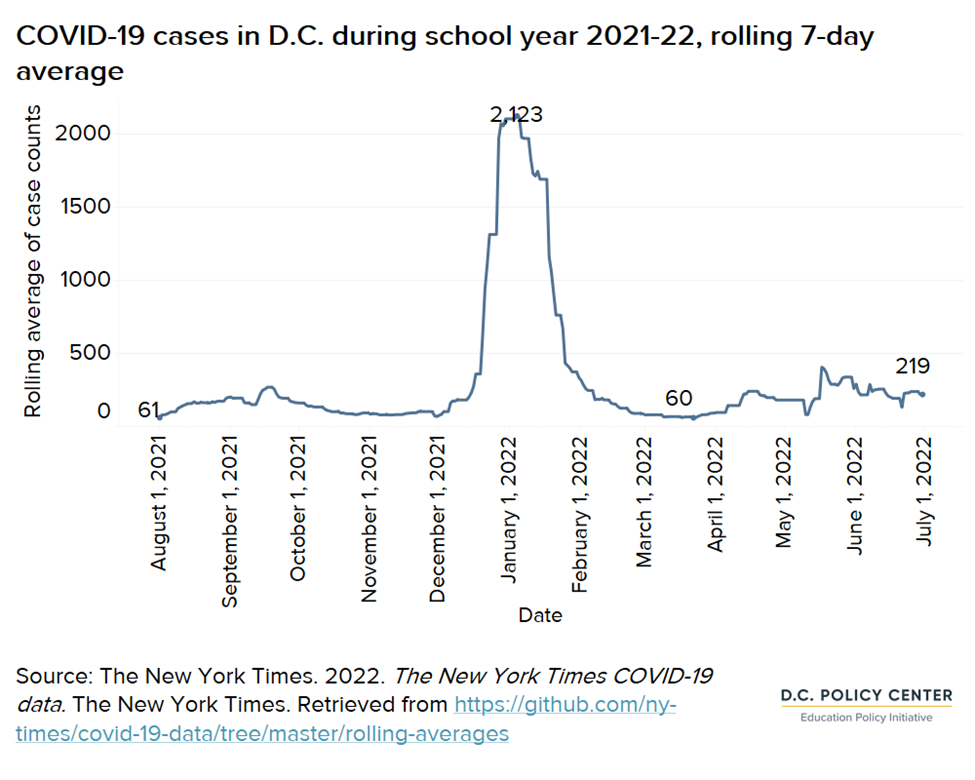
School year 2021-22 marked an incredibly challenging transition back to in-person learning in D.C., after a difficult virtual school year 2020-21 and shortened school year 2019-20. Chronic absenteeism rose to a high of 48 percent,[i] up from 29 percent in the last full school year of 2018-19. COVID-19 cases spiked to an average of over 2,000 new cases per day in January of 2022, which among other factors had an impact on attendance.
COVID-19, absenteeism, and other factors made school year 2021-22 a tough time to catch up on learning for the system as a whole. Results from D.C.’s 2021-22 statewide PARCC assessment show declines in both English language arts (ELA) and math since the last time the test was administered in 2018-19. ELA proficiency declined from 37 percent to 31 percent (6 percentage points), and math proficiency declined from 31 percent to 19 percent (12 percentage points).
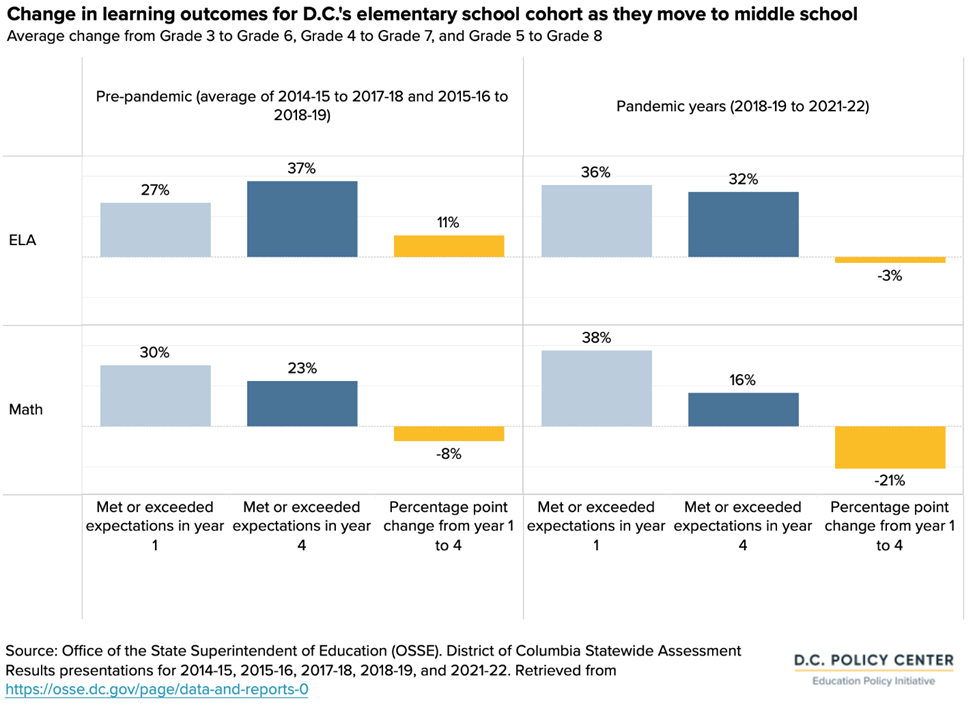
In addition to the system-level learning outcomes change, we see that learning outcomes for a cohort of students as they moved from lower to upper grades decreased by larger amounts. Generally, we would like to see an upward trend in learning outcomes, with more students meeting or exceeding expectations as they move to upper grades. However, comparing PARCC results for elementary school students (grades 3, 4, and 5) to middle school students (grades 6, 7, and 8) three years later, we see the decline by cohort is larger than the system’s decline.[ii] Before the pandemic, when students moved from elementary to middle school over a three-year period, their learning outcomes improved, on average, 11 percentage points in ELA, but declined on average 8 percentage points in math. After the pandemic, progress in both subjects weakened for the same cohort. The percentage of students meeting or exceeding expectations decreased by 3 percentage points in ELA (the opposite of the gains experienced by previous cohorts) and decreased by 21 percentage points in math (a steeper decrease than pre-pandemic).
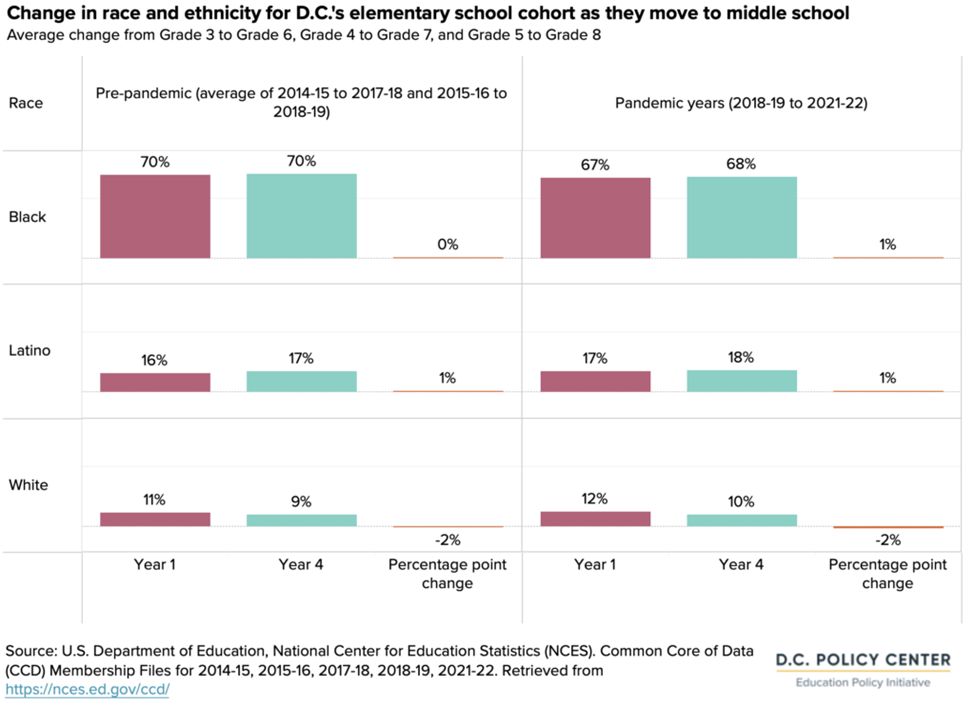
It doesn’t appear that these learning outcomes changes by cohort are shaped by demographic shifts. Although the student population has become smaller than usual, it has not shifted that much by race and ethnicity. From school year 2018-19 to school year 2021-22, this student cohort shrank by 12 percent as the elementary school students (in tested grades 3, 4, and 5 only) became middle school students (in grades 6, 7, and 8). During this same transition before the pandemic, 8 percent of these elementary school students would leave before middle school, meaning it is a 4 percentage point increase in those who leave.[iii] By race and ethnicity, the composition of elementary school students shifted by middle school during the pandemic to be 68 percent Black (1 percentage point increase), 18 percent Latino (1 percentage point increase) and 10 percent white (2 percentage point decrease. This is similar to shifts before the pandemic, meaning that there wasn’t a huge exodus of one race or ethnicity during the pandemic.[iv]
Looking at changes in learning outcomes for elementary and middle school cohorts reveals a different side of the magnitude of learning loss, showing that it is not just math where students experienced a serious decline. While learning outcomes in math declined for all students by 12 percentage points, double the amount of the decline in ELA, following cohorts of students with the publicly available data shows that there were larger than usual declines in ELA as well. Instead of an additional 11 out of 100 elementary school students meeting expectations in ELA by middle school, now 3 fewer out of 100 elementary school students meet these expectations when they are in middle school, making it important to focus on both ELA, including early literacy, and math during recovery in terms of learning after the pandemic. To examine progress, we need to look at longitudinal results for students along the way.