D.C.’s Planned Unit Development (PUD) process allows developers to gain additional height and density for a project (beyond what they could build matter of right) in exchange for delivering additional public benefits back to the community. The specific level and types of benefits are driven by a conversation with the community, generally through the relevant Advisory Neighborhood Commission (ANC) and local civic organizations. The idea is that the community can outline their priorities on how to best recapture some of the additional value the developer earns from the zoning flexibility.
There is no predetermined set of community benefits: each benefit package under each PUD is developed organically, following negotiations between the community (usually led by the ANC) and the developers. These negotiations have produced benefits in many forms, including green building design, extra space for public use, or improvements to streets and sidewalks. But the benefits that generally attract the most public attention are additional subsidized affordable housing and direct cash contributions to local community organizations.
There have been over 200 PUDs in the last 20 years, but the data isn’t particularly well organized. It lives in a series of individual zoning orders and supporting documents — hundreds of PDFs buried within the zoning website. In order to bring the details of these agreements to light, our team systematically combed through those documents to build a scannable, sortable database (.XLSX), explained in more detail below.
What’s in the database?
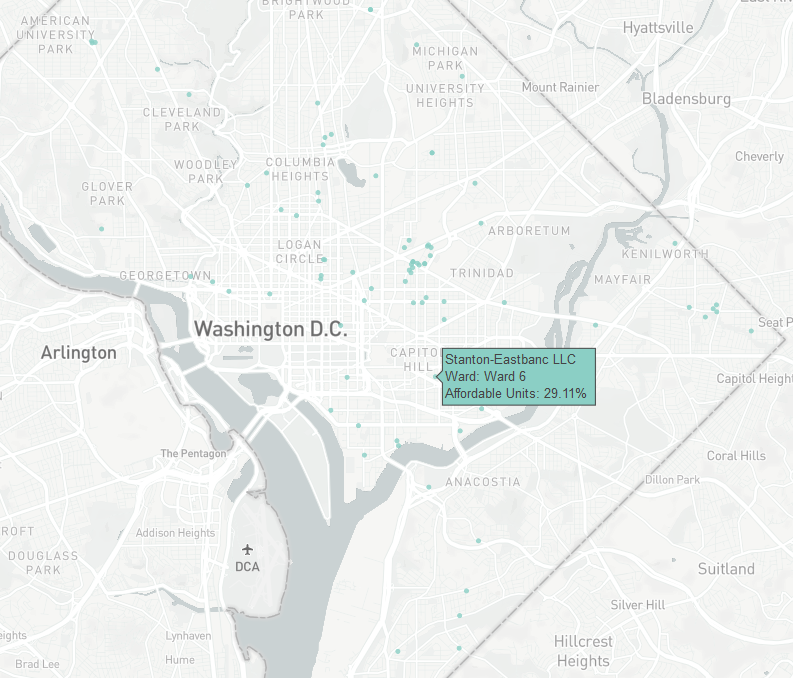
The data covers the 82 PUDs negotiated from 2010 through 2018. For each PUD, the database includes basic information such as the name, case number, and a link to the original PUD, along with information about housing units, share of units that are affordable (and at what levels), parking information, and the recorded costs of the community benefit agreement line items. The sheet also record basic categorical data like zones, maximum heights and floor-area-ratios (FAR), which make it easy to look up details of past projects or find examples to compare present-day proposals to. A map of the PUDs in the database is below.
The projects in this database represent over 20,000 units of housing, over 4,000 of which are subsidized affordable units. (That is an average of 20 percent of units per project designated affordable, though it’s important to note that the city’s Inclusionary Zoning policy require by-right projects of these sizes to reserve 8-10 percent of their units affordable, so the Zoning Commission only considers the additional 10-12 percent here as part of the benefits of the PUDs). Of those affordable units, about 50 percent (1,894) are reserved for tenants making 60 percent of the Area Median Income (AMI), with another 20 percent of the units at each of the 50 percent and 80 percent AMI levels (842 and 821 units, respectively) and about 6 percent (248 units) at the “deeply affordable” 30 percent AMI level. (The remaining 176 units are at the 100 percent and 120 percent AMI levels).With respect to monetarily-valued community benefits, the projects collectively returned benefits worth over $42 million dollars. That includes funds for public art and parks, programs for schools and rec centers, contributions to the housing protection trust fund, and streetscape improvements among others. That number actually represents the floor of the value returned by these projects, as many buildings have millions of dollars of benefits that are not line-itemed out in the zoning orders. Valuing these contributions represents a final step necessary to create a true apples-to-apples comparison between any project’s value gained from the bonus density of the PUD and value returned in benefits.
Download the PUD database (.XLSX)
What’s not in the database?
In some cases, a handful of variables were not immediately available for some projects based on the information in the PUD documentation. Beyond this, information on the valuation of various public benefits is often not available because it was not calculated at the time of the zoning order. While benefits like direct contributions to community organizations are almost always recorded, the cost of larger deliverables like streetscape improvements or creation of parks was not always estimated. Those benefits often have costs in the six- to seven-figure range, which are often not reflected in the single “monetary value benefit” number listed for each PUD in the database. Notably, more recent PUDs tend to catalogue the monetary equivalents of their provided public benefits more often than those of earlier years.
Similarly, we also have not quantified the valuation of the affordable housing benefits in this database. To do so would be moderately more straightforward, as the costs to subsidize units at different AMI levels are somewhat more standardized and known. However, for any researchers planning to do that type of analysis, it’s important to note that the Zoning Commission only considers affordable housing a public benefit for PUD purposes if it is in excess of what would have been required anyway by the Inclusionary Zoning (IZ) program for a matter-of-right development on the same property.
Finally, while the database includes the pre-PUD and final FARs of each project, providing some important data points to determine how much extra value was gained by developers, we have not attempted yet to translate those into specific monetary estimates. That ultimately would require more specific data about the value per square foot of relative properties and times.
What’s next?
We hope to continue this work in the future and fill in some of the data gaps with additional research. We also want to hear from users what they find most valuable so far, and what additions would make it even more useful. For example, as touched on above, one next step would be to find a way to build out some more detailed estimates for the value of gained square footage and the market value of returned benefits, to better allow a more quantitative analysis of what kind of averages emerge and which projects returned the most value. Another option would be to expand the database further back than 2010 to capture longer trendlines.
Help us think through next steps! Leave a comment below or email contact@dcpolicycenter.org with your suggestion.
Pooja Patel, David Whitehead, and Sam Myszkowski contributed to the data collection and processing for this project.