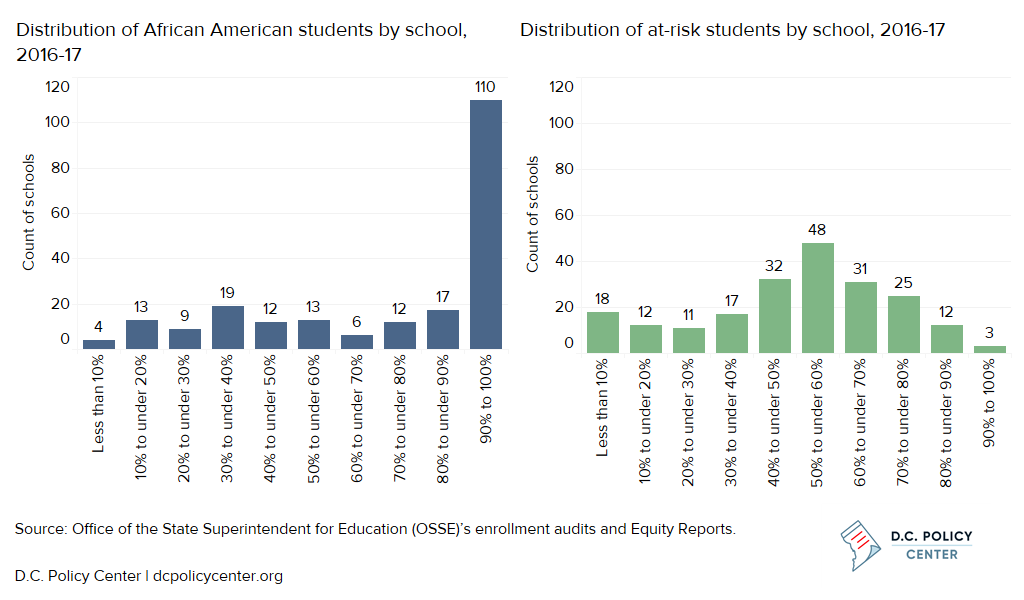
One key finding of the recent D.C. Policy Center report “Landscape of Diversity in D.C. Public Schools: What Does School Diversity Look Like in D.C.?” was that racial and ethnic diversity is low in the city’s public schools,[1] even considering the composition of D.C.’s students – individual schools were less diverse than the public school population as a whole. In practice, this meant that half of D.C.’s public schools with students in pre-kindergarten through grade 12 had a student body that was at least 90 percent African American. That is, many students did not attend school with peers from other racial or ethnic groups.
Contributing to these enrollment patterns, the District’s public school students are less diverse than the school-age population. In addition, many students enroll in their in-boundary schools or schools close to home, and attend school together with other students from their neighborhoods in an economically and racially segregated city. But given the high share of enrollment at public charter schools and traditional public schools from out-of-boundary, there is potential for certain schools to reflect the same amount of diversity as exists across all public school students.
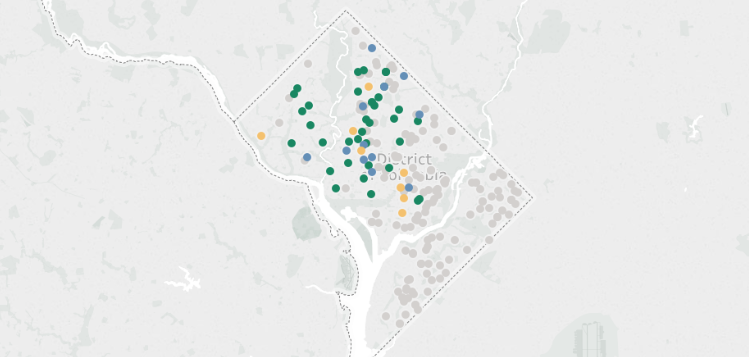
Not only are schools less racially and ethnically diverse than the overall student body, but racial and ethnic diversity did not change much at the majority of schools from 2014-15 to 2016-17. The score at the median school increased by only one percentage point while the proportion of African American students (the plurality group with the most students) decreased by four percentage points. When increases did occur, schools located west of Rock Creek Park mostly became more racially and ethnically diverse. However, the window of analysis for changes in racial and ethnic diversity was limited by data availability.[2] As follow up, this analysis examines changes in racial and ethnic diversity over a longer period (2012-13 to 2017-18) to see if there is more movement at the system or school level, or in certain parts of the city.
Methodology
The racial and ethnic diversity score shows how exposed students are to those from other racial and ethnic groups. Students are identified as belonging to one of the four following groups: African American, Latino, white, or other. At each school, one of these four groups is established as the plurality group. The diversity score is the sum of the percentages of students in the remaining groups, or the share of its non-plurality groups. The larger the sum, the more diverse the school. This gives a sense of the extent to which different groups are represented, which increases the potential for interaction between groups.
The potential for racial and ethnic diversity is increasing, but change is slow
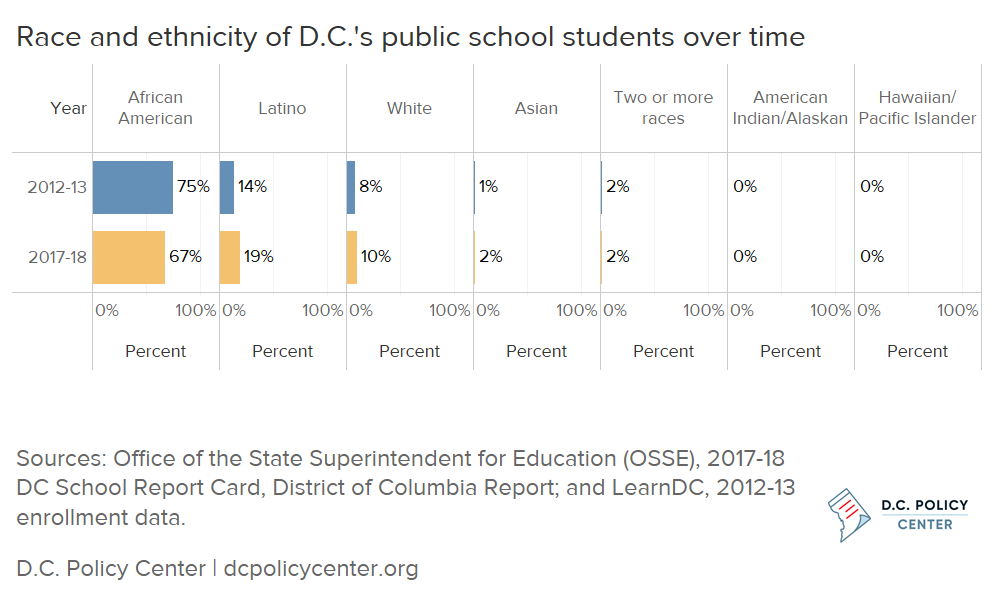
Over the past five years, enrollment in D.C.’s public schools increased and the racial and ethnic background of public school students shifted. From 2012-13 to 2017-18, enrollment in pre-kindergarten through grade 12 grew by 12 percent, or 9,384 students.[3] The largest percent increase was in elementary school grades, or kindergarten through grade 5, which grew by 22 percent. As enrollment increased, the proportion of African American students decreased by eight percentage points and the proportions of Latino and white students increased by five and two percentage points, respectively. If students were distributed at each school exactly as they are in the overall student body, this means that the median diversity score had the potential to increase by eight percentage points from 25 percent to 33 percent given the decrease in the plurality group.
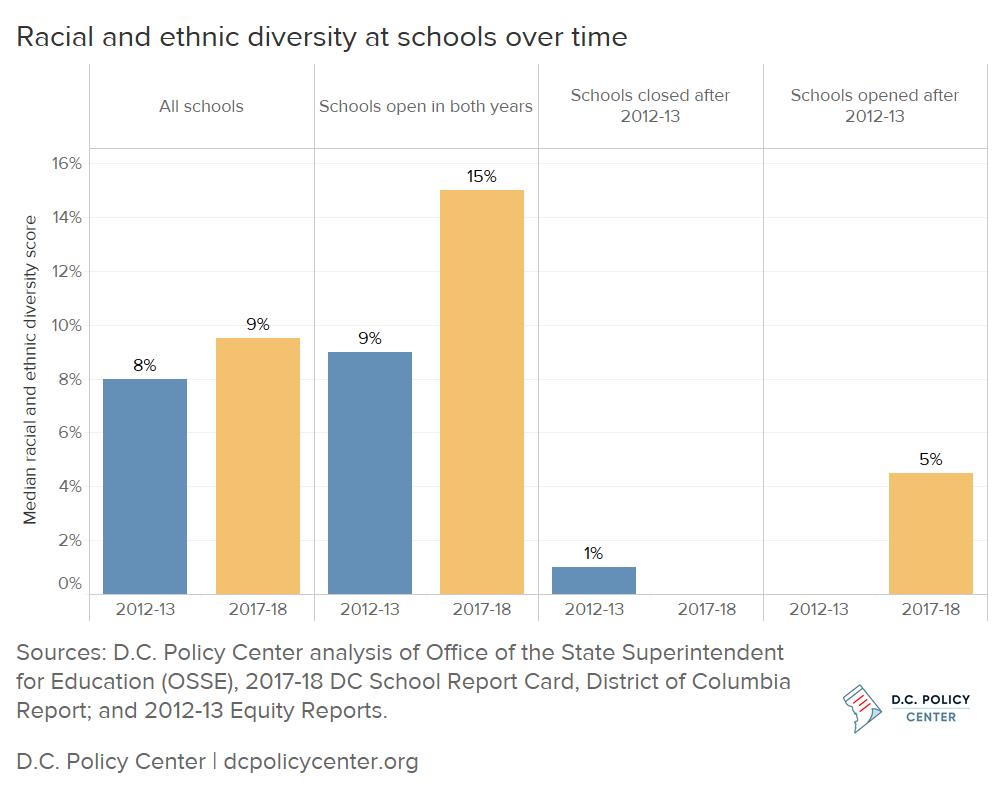
However, schools experienced a smaller change in diversity. From 2012-13 to 2017-18, the median racial and ethnic diversity score for D.C.’s public schools serving pre-kindergarten to grade 12 increased from 8 percent to 9.5 percent. This means that the plurality group at the median school decreased in size by 1.5 percent over five years at all schools even though the plurality group across the entire public school population decreased by 8 percentage points.
Over this same period, the composition of public schools serving students in pre-kindergarten to grade 12 changed. Fifteen schools closed, and 36 schools opened. Almost all opening or closing schools served a majority of African American students, and most were less diverse than schools than those that were open throughout the five-year period. For schools that were open in both years, the median racial and ethnic diversity score increased from 9 percent to 15 percent. By comparison, schools that closed after 2012-13 had a low median racial and ethnic diversity score of 1 percent and schools that opened after 2012-13 had a score of 5 percent.
Schools in Wards 2, 4, and 5 increased racial and ethnic diversity by the most
Schools in some Wards in the center of the city experienced more change in racial and ethnic diversity than the rest. Specifically, schools in Wards 2, 4, and 5 had higher median changes than the system overall. By comparison, the greatest shifts in the proportion of the African American population under 18 occurred in Wards 4, 5, and 6. In Wards 4 and 5, changes in the population under 18 and diversity in schools was aligned. However, in Ward 2, diversity in schools has shifted more than the child population, and in Ward 6, the child population changed more quickly than the schools.
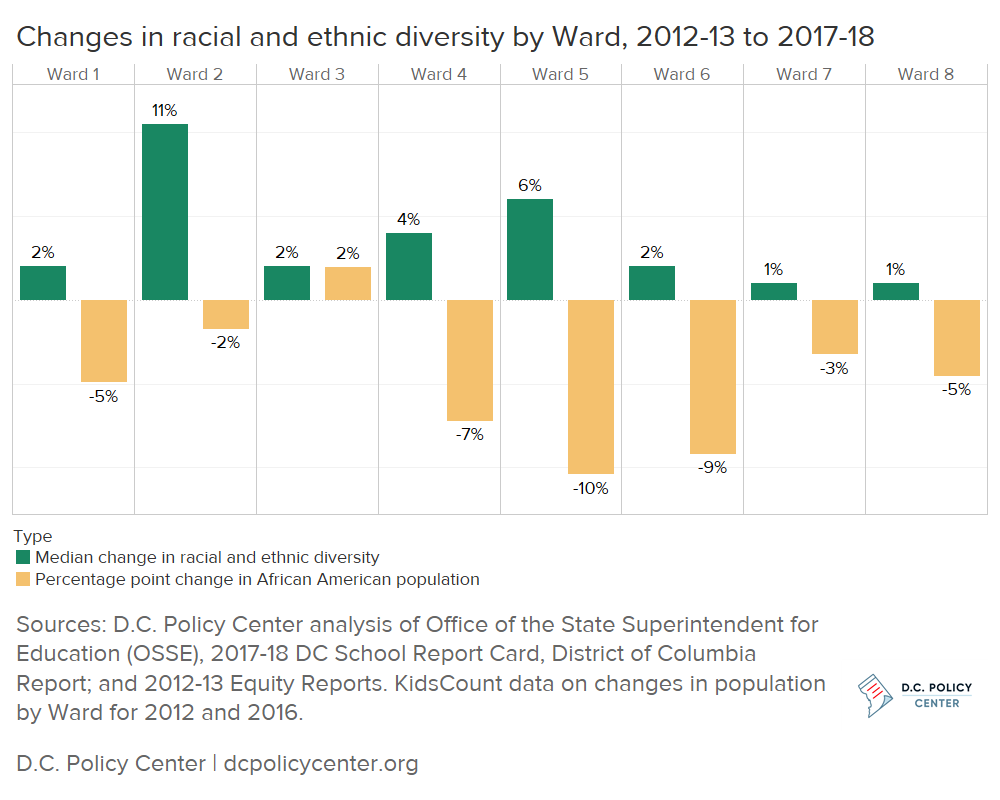
Changes in Ward 2 could be more sensitive to changes at individual schools (such as more or less students enrolling from in-boundary at these mostly DCPS schools), as there were eight schools in the Ward in both years compared to 28 in Ward 4, for example. Ward 6 schools are more evenly split between public charter schools and in-boundary DCPS schools, so the student body could be coming from elsewhere and remaining constant while the neighborhood changes.
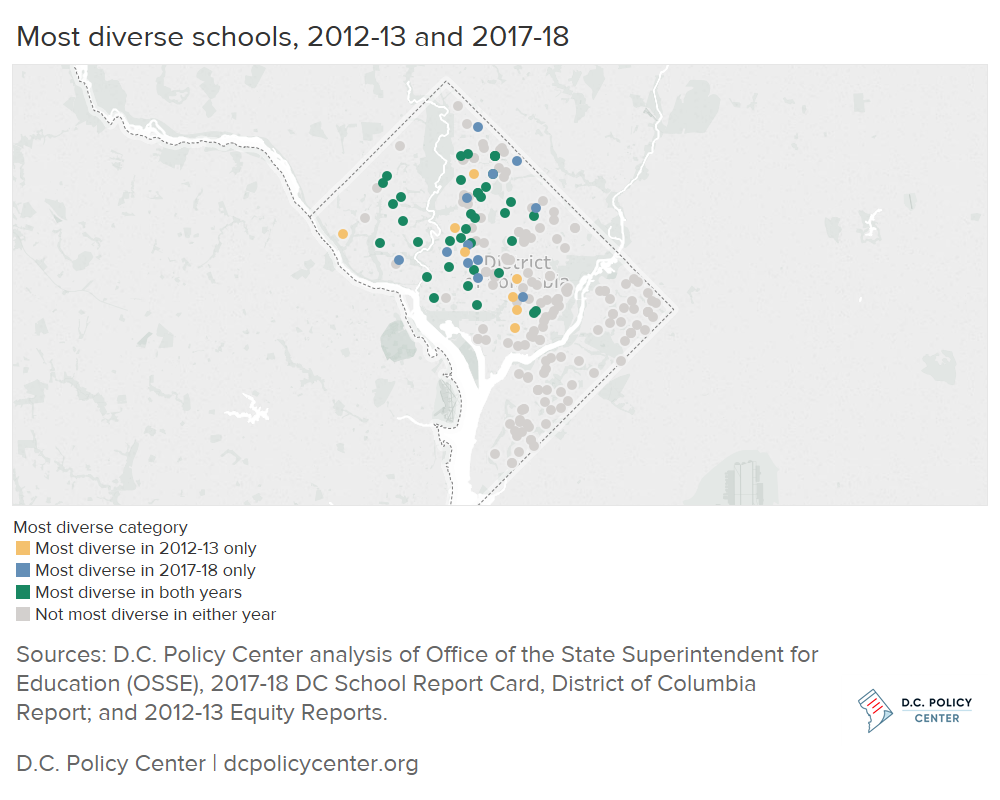
The most diverse schools are consistent over time
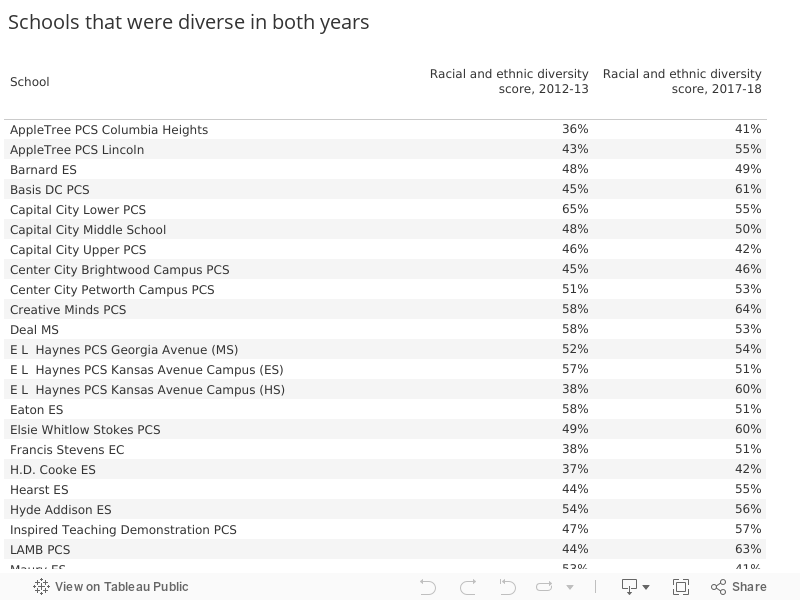
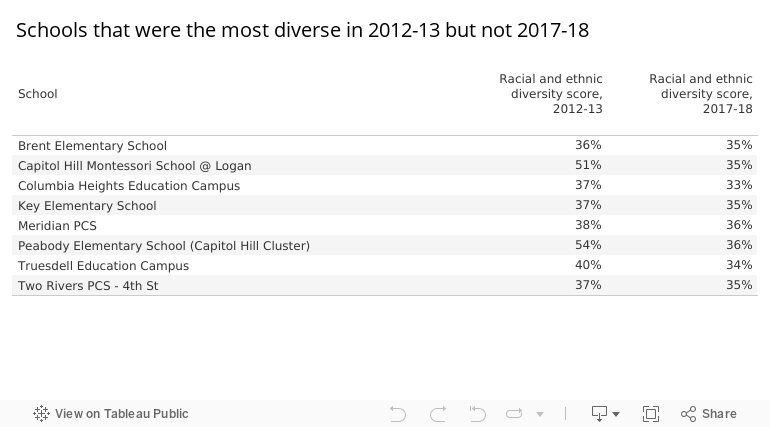
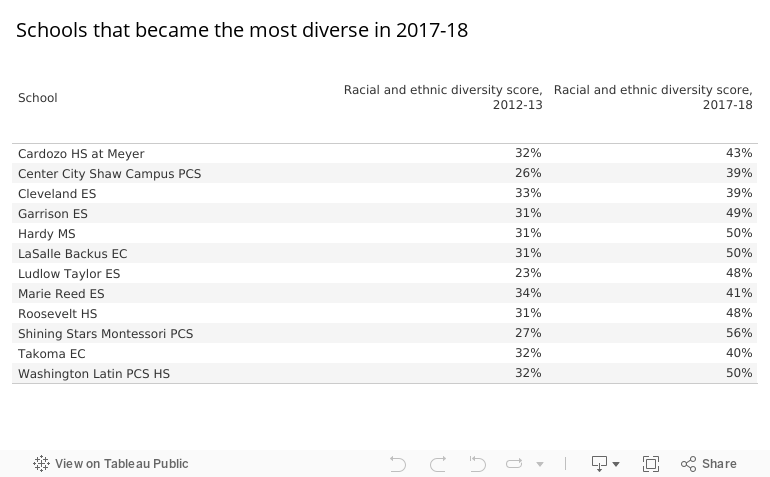
The schools that were the most racially and ethnically diverse, identified by scores in the highest quartile (above the 75th percentile), didn’t change much from 2012-13 to 2017-18. Out of the 45 most diverse schools in 2012-13 that were still open in 2017-18, 37 were still considered to be the most diverse five years later. Eight schools dropped off the list, and 12 schools joined. This shows that racial and ethnic diversity can be “sticky”, and that the current composition of students may continue to influence the race and ethnicity of future cohorts. See the appendix at the end of this post for lists of schools in each category.
In addition to consistency in the schools that are considered the most diverse, not many schools changed their plurality group, or the group with the highest proportion of students. From 2012-13 to 2017-18, 15 schools out of the 174 that were open in both years changed their plurality group. Most changed from a plurality of African American students to a plurality of Latino or white students, which is aligned with overall demographic shifts in the student body.
Plurality group by school, 2012-13 and 2017-2018
| School | Plurality group, 2012-13 | Plurality group, 2017-18 |
| Capital City PCS – Lower School | African American | Latino |
| Barnard Elementary School | African American | Latino |
| Cardozo Education Campus | African American | Latino |
| Roosevelt High School | African American | Latino |
| E.L. Haynes PCS – High School | African American | Latino |
| Washington Latin PCS – Middle School | African American | White |
| Hearst Elementary School | African American | White |
| Woodrow Wilson High School | African American | White |
| School Without Walls High School | African American | White |
| Inspired Teaching Demonstration PCS | African American | White |
| BASIS DC PCS | African American | White |
| Center City PCS – Brightwood | Latino | African American |
| Center City PCS – Petworth | Latino | African American |
| Hyde-Addison Elementary School @ Meyer | White | African American |
| Creative Minds International PCS | White | African American |
Over the next five years, student demographics could continue to shift to make more diversity possible. In 2016-17 (the most recent year with available data), the plurality group of African American students represented 75 percent of students in high school grades and 67 percent of students in pre-kindergarten grades.[4] If this cohort of pre-kindergarten stays in D.C.’s public schools, high schools have the potential to be more diverse. Student demographics have also changed over time. In 2012-13, the plurality group of African American students represented 72 percent of pre-kindergarten students and 70 percent of high school students. Especially if these changes continue, D.C. should monitor whether diversity is increasing at the school level in addition to the city level.
Notes
[1] Here and throughout, public schools refer to both traditional public and public charter schools.
[2] 2017-18 data on race and ethnicity by schools were not available at the time of analysis, and data on race and ethnicity for 2012-13 and 2013-14 were not used to be consistent with analyses of economic diversity, as the percent of students who were at-risk was not available for earlier years.
[3] Office of the State Superintendent for Education (OSSE). Enrollment Audits for 2012-13 and 2017-18. https://osse.dc.gov/enrollment
[4] U.S. Department of Education, National Center for Education Statistics. Common Core of Data. https://nces.ed.gov/ccd/
Addendum: Lists of schools that were the most diverse
Chelsea Coffin is the Director of the Education Policy Initiative at the D.C. Policy Center.