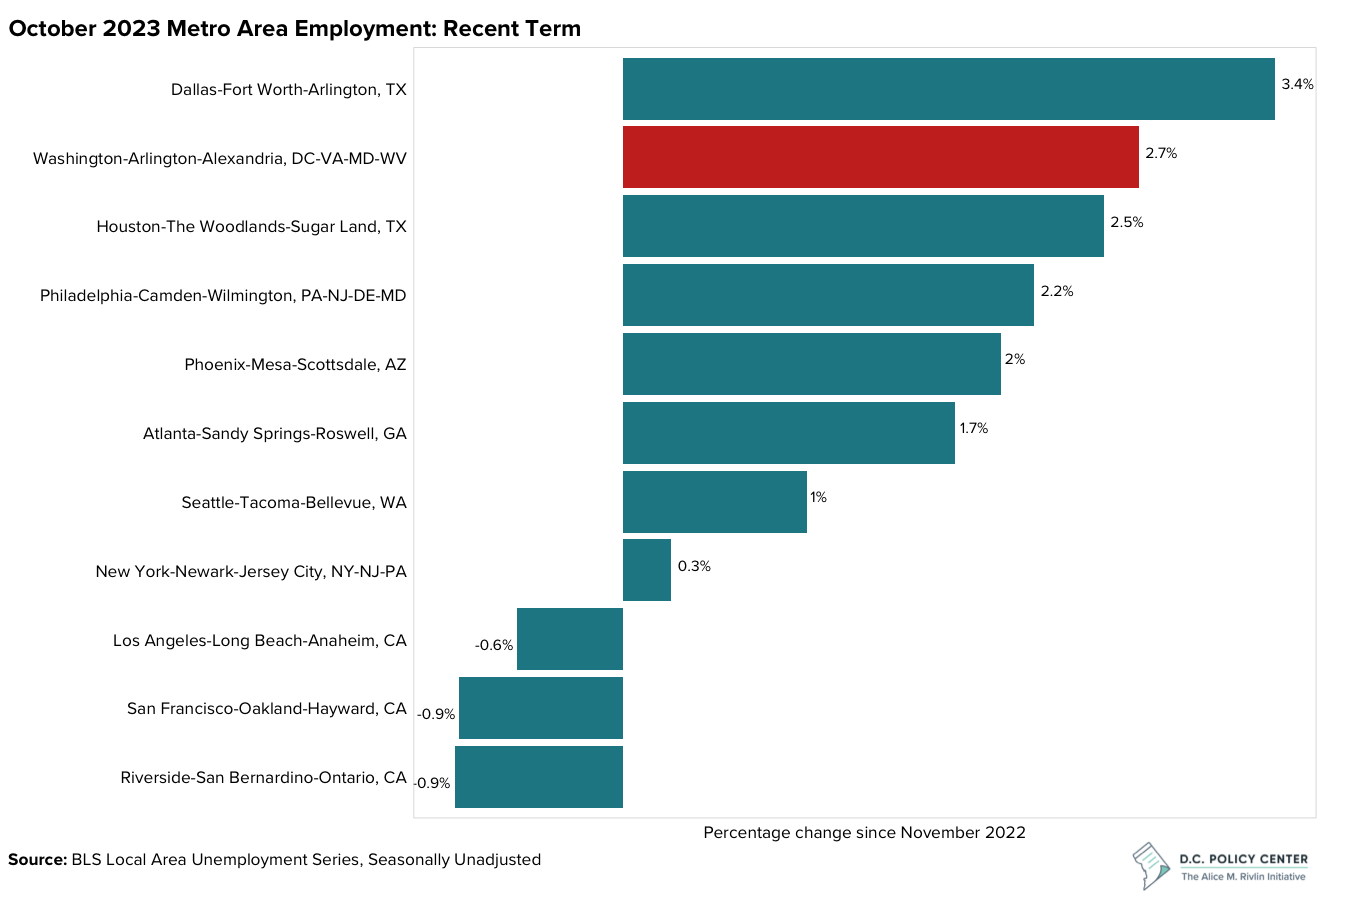
On Thursday, November 30th, the BLS released the preliminary metro employment and unemployment estimates for October 2023. Over the past year, the regional economy has added jobs at roughly the same rate that people have joined the regional labor force and looked for work. Since November 2022, employment in the D.C. metro area has grown by 2.7 percent.
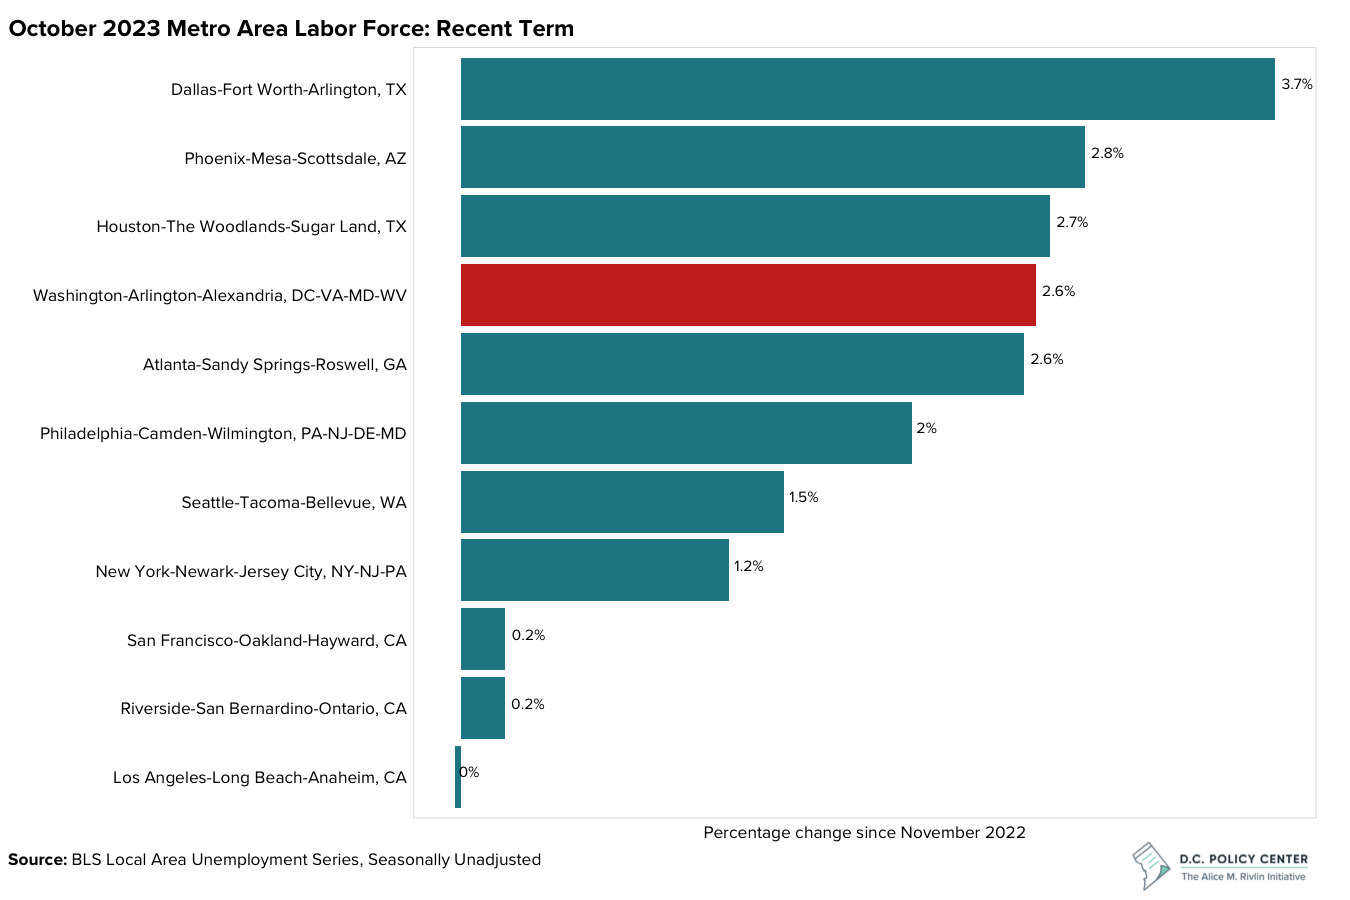
Meanwhile, the D.C. metro area’s labor force has grown by 2.6 percent. Given these employment and labor force numbers, the unemployment rate, which checked in at 2.7 percent, is not appreciably different from what it was in November 2022.
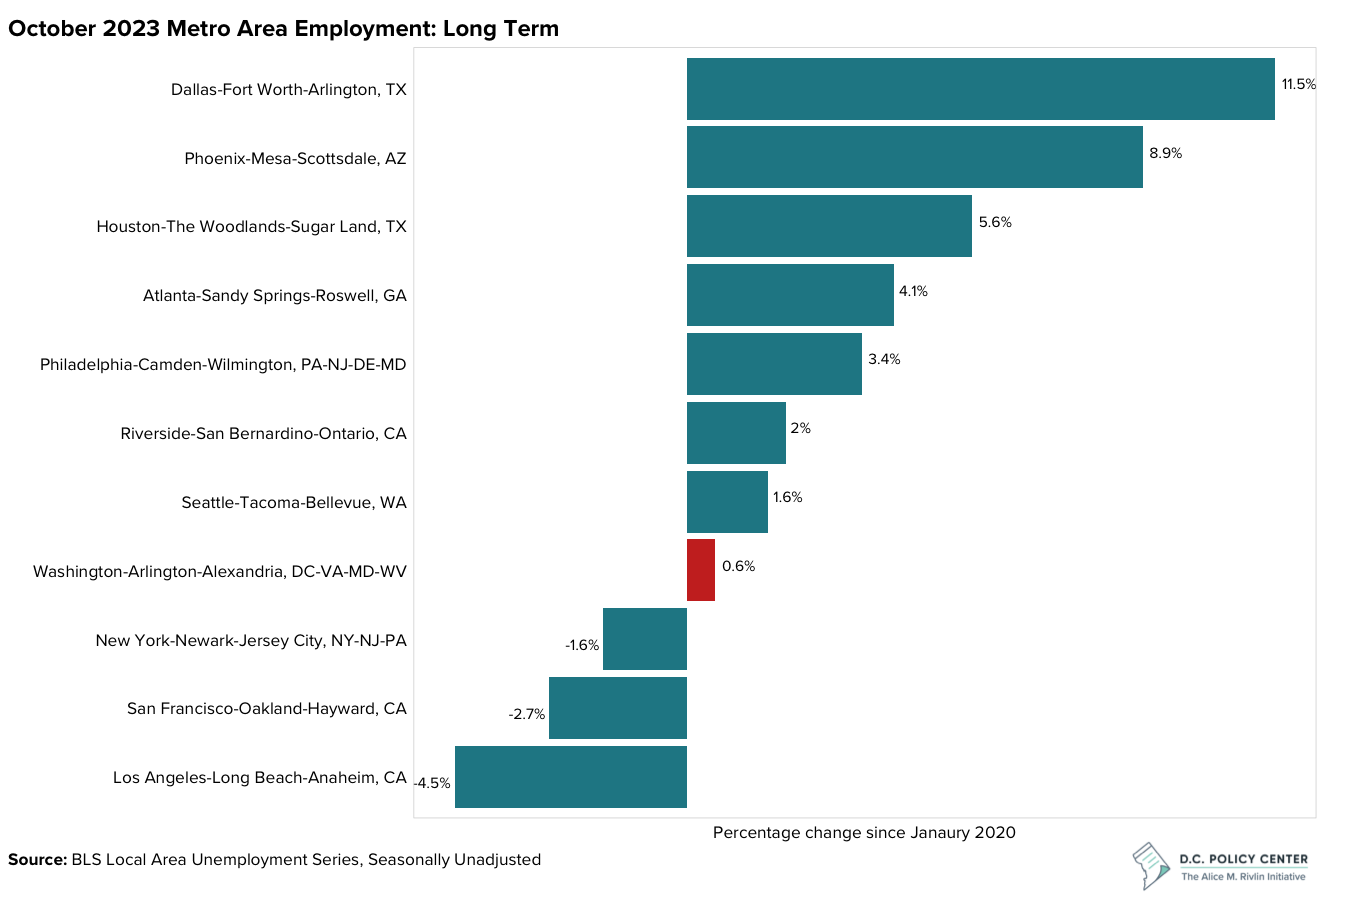
When one looks at employment growth and labor force growth since January of 2020, the numbers over the past year look more promising. Since January of 2020, employment in the D.C. metro area has only grown by 0.6 percent, and the labor force has grown by even less—0.2 percent.
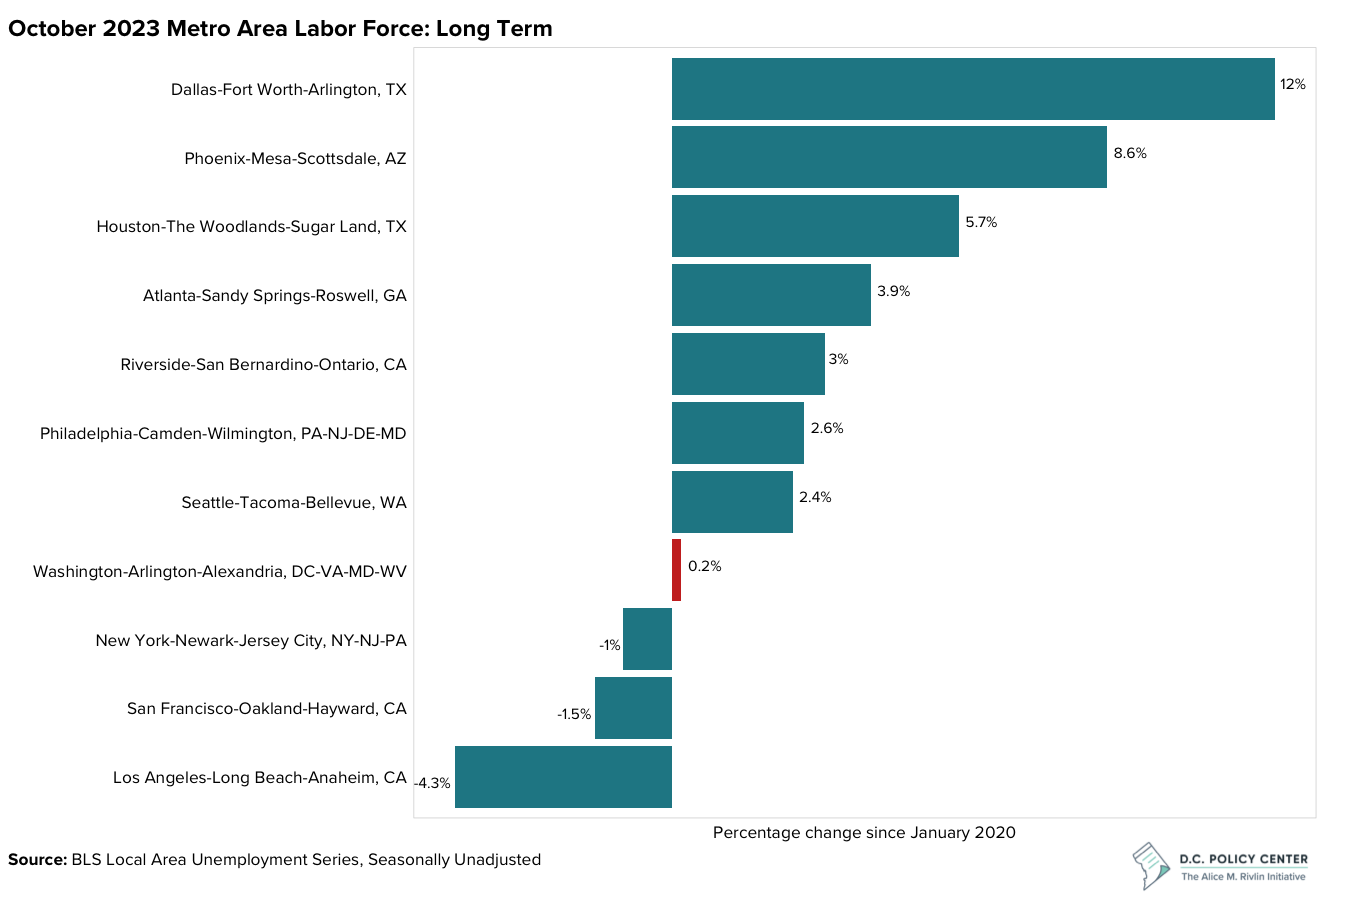
Given that the October estimates are preliminary, subject to revision and sampling error, the 0.2 percent growth in the labor force might represent noise. It is thus possible that the civilian labor force for the D.C. metro area is still below its January 2020 level. In fact, between January of 2020 and November of 2022, the region’s unemployment rate was artificially low because people were leaving the labor force.
Comparing the D.C. metro area’s employment growth and labor force growth to those of other metro areas in the U.S, there is a striking difference between the longer-term and more recent term. Over the longer term, or since January 2020, lower cost metro areas—such as Dallas, Phoenix, and Houston—have outperformed higher-cost metro areas—such as Los Angeles, San Francisco, and D.C. But in the more recent term, or since November 2022, the gap in economic performance between low- and high-cost metro areas becomes less clear. For example, Riverside—a low-cost metro area—has fared just as poorly as two high-cost areas, Los Angeles and San Francisco. Meanwhile, the D.C. metro area—a high-cost metro area—has done better than the lower cost metro areas of Atlanta and Riverside.
Data Notes
- The recent BLS release for October 2023 — “Metropolitan Area Employment and Unemployment Summary”—can be found here.
- The D.C. area metro data can be found here.
- Given that the data are seasonally unadjusted, the estimates reported in this analysis should be seen as tentative and interpreted with caution.