Where is the school-age population likely to live? This post examines population forecasts and housing prices to highlight areas of the city that could see a growth in the population aged 3-17 as a follow up to the D.C. Policy Center report, Will Children of Millennials Become Future Public School Students?.
If children continue to enroll in public schools by kindergarten and transition between grade bands at the same rates as they do today, D.C. could have about 104,600 students in pre-kindergarten through grade 12 by 2026-27 (an estimated 21,100 additional students based on current conditions in addition to the 83,491 enrolled in 2016-17). Where is this growth likely to occur?
This analysis looks at population forecasts, housing prices, and Millennial incomes to highlight areas of the city where the school-age population is likely to live. Where students live gives some indication of future demand because students attend schools that are on average a 10- to 16-minute drive from home, depending on their grade.[1] However, residence does not determine precisely which schools will grow, as just 27 percent of D.C.’s public school students attend their in-boundary school.[2]
Population forecasts and the school-age population
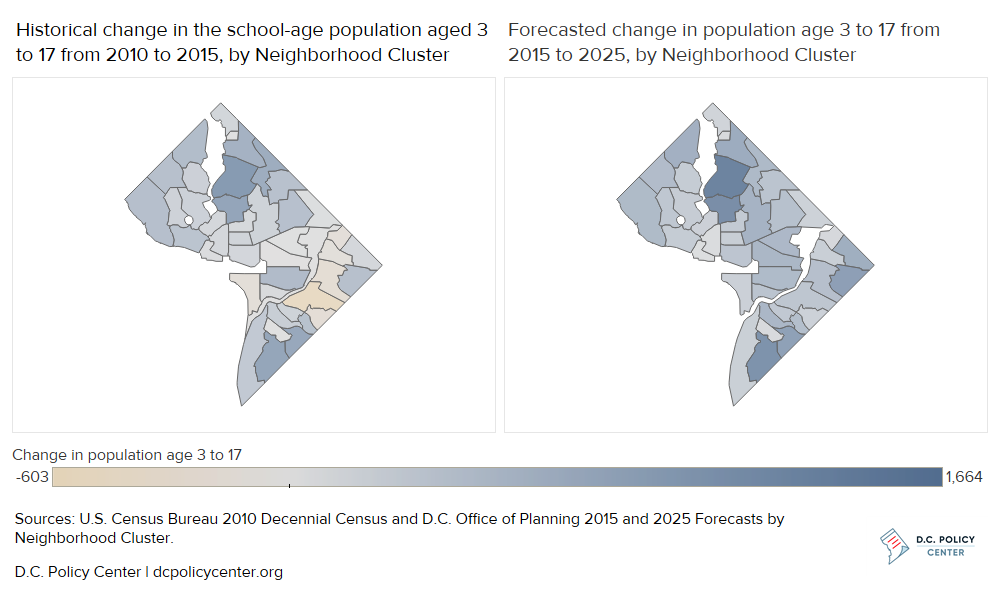
According to the D.C. Office of Planning’s population forecasts, the largest increases in school-age population will occur in Neighborhood Clusters to the north of the center of the city and to the far south between 2015 and 2025. The neighborhoods with the largest forecasted increases of 1,300 or more from 2015 to 2025 include Cluster 2 (Columbia Heights, Mount Pleasant, Pleasant Plans, Park View), Cluster 18 (Brightwood Park, Crestwood, and Petworth), and Cluster 39 (Congress Heights, Bellevue, and Washington Highlands). These population forecasts take into account planned developments, growth from net natural increase, and other factors. Forecasted population shows continued growth for the school-age population in many neighborhoods that saw growth in this population over the previous five years: in fact, these three areas with the largest future increases also increased by the most from 2010 to 2015.
Housing prices and the school-age population
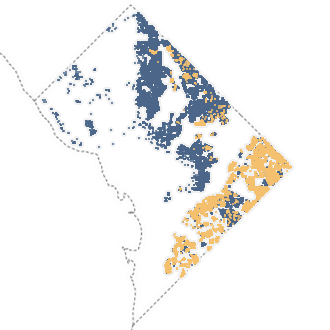
Single-family homes in the price range that corresponds with Millennial income at the median and 75th percentile show that the school-age population could also increase along the northeast and southeast borders of the city. This analysis focuses on single-family homes (instead of apartments, condos, or co-ops) due to data constraints, and income for Millennial couples because no houses would be affordable at the median income for a Millennial individual with no children.
Millennial incomes and implications for housing choices
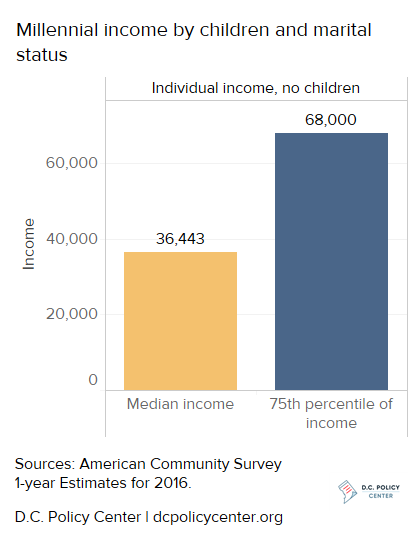
The median Millennial individual in D.C. with no children has an annual income of around $36,443 as of 2016. Doubling this individual income to $72,886 estimates income for a Millennial couple with no children who may be looking for a single-family home to accommodate a family.[3] By comparison, Millennials in the 75th percentile of income earn about $68,000 per year individually, or $136,000 per couple.[4]
This income can be compared to the amount necessary to afford existing single-family homes[5] in D.C. as calculated for the D.C. Policy Center report, Taking Stock of the District’s Housing Stock.[6] This gives a sense of where homes might be in the affordable price range for D.C.’s Millennials. However, Millennials may not have the necessary savings to afford a down payment, or they may have other expenses to consider, such as student loans or childcare. D.C.’s young adults in 2016 had higher levels of education than their counterparts in 2000, and a Millennial with student loans may pay as much as 10 percent of Adjusted Gross Income (AGI)[7] in loan payments if he or she is enrolled in an Income-Based Repayment Plan.[8] In addition, the average annual cost of child care at a center in D.C. for an infant was $23,089 as of 2016.[9] These constraints make it more difficult to afford housing in D.C.[10]
Location of single-family homes potentially in the price range for Millennials
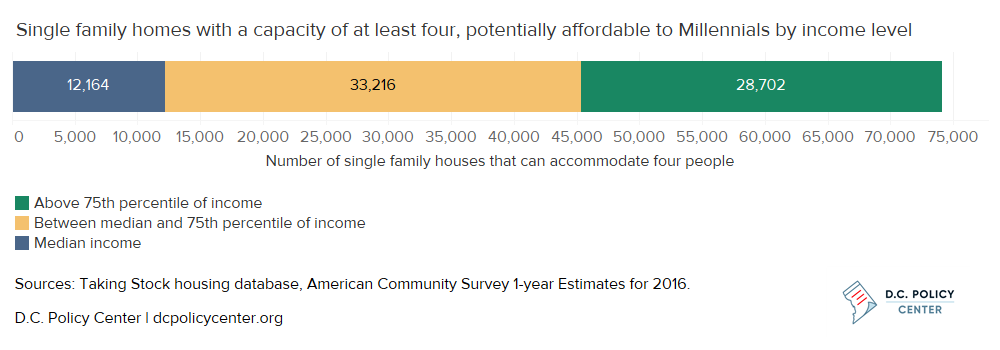
Looking at the existing stock of single-family homes with a capacity of four, very few are potentially in the affordable price range for Millennials – and not all will be available on the market in the coming years. Out of approximately 74,000 single-family homes that can accommodate four or more people in D.C. (at least a three-bedroom home),[11] 16 percent are potentially affordable to Millennial couples without children making the median income, and an additional 45 percent are potentially available to Millennial couples with incomes in the 75th percentile. None are available to Millennial couples without children and in the 25th percentile. The remaining 39 percent of homes are only in reach for those in the highest income quartile. At the median income point, a Millennial couple could potentially afford a house with an estimated market value of between $150,000 and $358,000, which rises to an estimated market value of up to $755,000 at the 75th percentile of income.
Most homes in the price range for the median Millennial couple to house a family of four are in Wards 7 and 8. Looking at the 75th percentile of Millennial couples shows several areas in northeast and the central corridor that have single-family homes in an affordable price range. If families move to these areas in greater numbers and replace households without children, the school-age population in these neighborhoods would grow.[12] And turnover in these single-family homes may yield more school-age children as 24 percent of these homes are currently owned by senior citizens (compared to 18 percent of all homes) claiming a property tax exemption.[13]
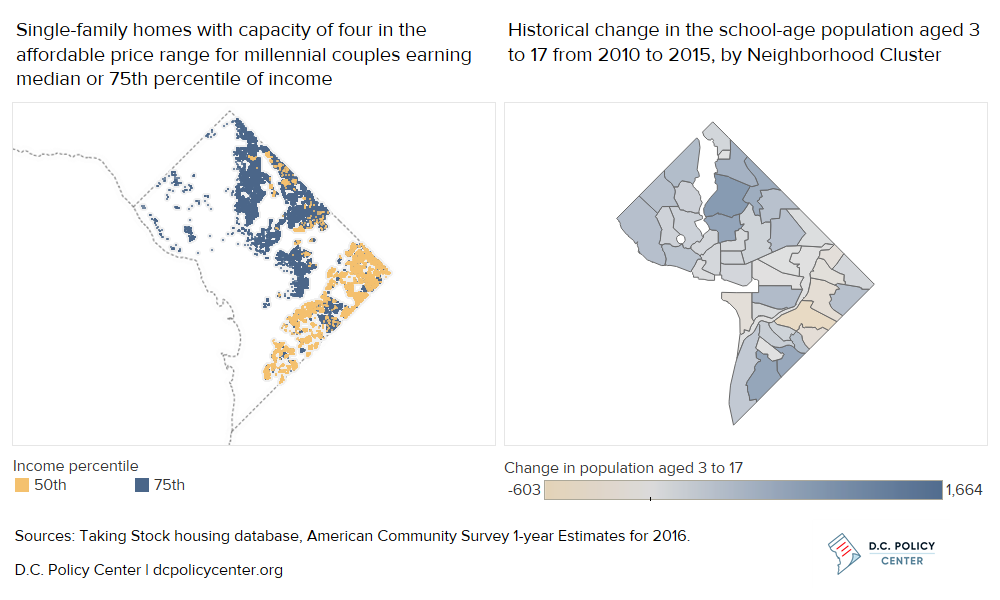
In contrast, the D.C. Office of Planning’s population forecasts do not show much growth in school-age population along the northeast border of the city. This discrepancy could reflect the difference between existing housing stock examined in this report, and new development coming online that partly drives Office of Planning’s forecasts.[14]
The areas with the most homes in the affordable price range show growth in some Neighborhood Clusters where the school-age population did not grow from 2010 to 2015. If single-family homes in the price range of a median Millennial couple with no children begin to house more families with young children, the school-age population may increase in some neighborhoods where it has been recently decreasing, such as Cluster 29 (Eastland Gardens, Kenilworth) and Cluster 34 (Twining, Fairlawn, Randle Highlands, Penn Branch, Fort Davis Park, Fort Dupont).
Apartments in the District
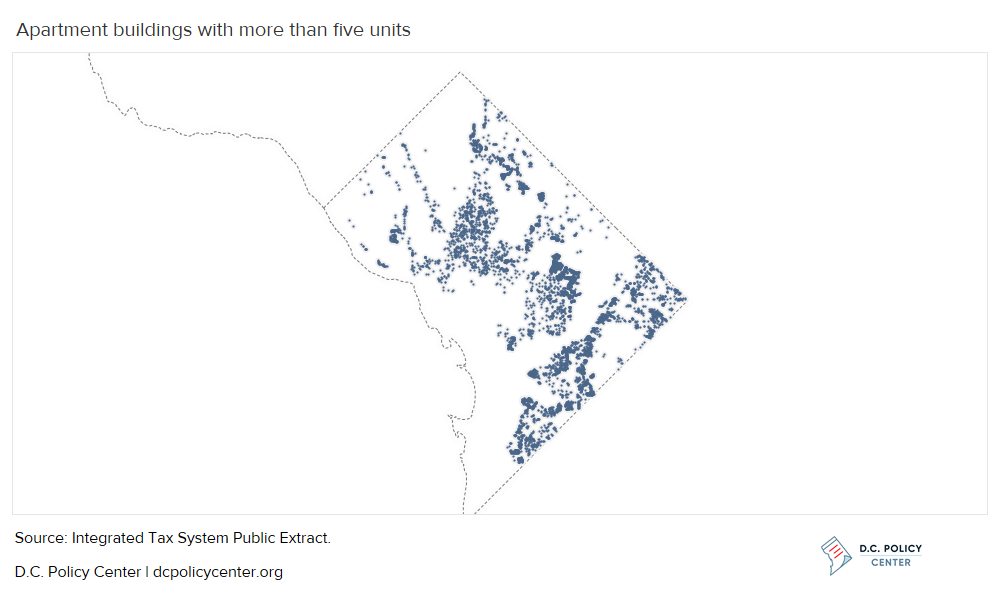
Data are not available on the proportion of school-age children who live in apartments nor the capacity of apartments, but larger apartment buildings with more than five units may indicate affordable options for Millennials in additional neighborhoods. Many D.C. residents rent, as 39 percent of D.C.’s housing units are owner-occupied (American Community Survey 1-Year Estimates for 2016). Larger apartment buildings are available in neighborhoods in Northwest that have few, if any affordable single-family homes for D.C. Millennial couples earning median income. These apartments could allow for growth in the school-age population in these areas.
In conclusion, the school-age population from 2015 to 2025 is forecasted to increase by the highest numbers of children north of the center of the city and to the far south. However, looking at the District’s existing housing stock shows that there are many homes located along the northeast and southeast borders in the affordable price range for a Millennial couple without children earning the median or 75th percentile of income (many of these are homes that may become available if senior citizens downsize). Combining information from these two sources, most growth is likely to occur outside of the boundaries of Wilson High School and its feeder schools. The Wilson HS boundary is the only area of the city where the overwhelming majority of students attend their in-boundary school, so school choice will continue to have a role in the city’s education system.
Given Millennial incomes, finding affordable housing near schools, transit, and jobs may become difficult as this generation starts families. For example, a couple jointly earning the Area Median Income (AMI) of $89,000 can afford a one-bedroom at the average monthly rent of $1,966 (Josephson, 2018),[15][16] but will find it difficult to find options with additional bedrooms for children. Housing is already a concern for people who leave the city: between 2000 and 2014, housing was the most common reason for moving out of the District, cited as the main factor in 36 percent of moves, whereas jobs were the most common reason why people moved to the District, cited as the main factor in 32 percent of moves.[17]
Method
This analysis compares income to the amount necessary to afford existing single-family homes[18] in D.C. as calculated for the D.C. Policy Center report, Taking Stock of the District’s Housing Stock.[19] This methodology first generates an estimated market value by dividing the assessment value by the average assessment to market value ratio for available properties by neighborhood. It then divides the estimated market value by a capitalization rate published by the Office of the Chief Financial Officer for income-generating properties by geographic area to estimate the annual housing cost. Finally, the annual housing cost is divided by 30 percent (a standard threshold for housing affordability) to determine the income necessary to own a home.
Many Millennials will rent instead of buy, but this analysis focuses on single-family homes because of available data on capacity and assessments. However, comparing data from Zillow on median two-bedroom rents with housing costs from the D.C. Policy Center’s Taking Stock database suggests that rental prices are likely to be similar to housing costs in neighborhoods where a two-bedroom single-family home costs less than $3,400 per month.[20] In more expensive neighborhoods, comparison of housing and rental costs shows is likely to be cheaper to rent than buy. However, it is not possible to ascertain apartment capacity per unit with the data currently available, limiting a full analysis of the rental market.
Although 56 percent of D.C.’s children live in single-parent households (United States Census Bureau, 2016), the analysis below of single-family homes focuses on income for a household with a couple (and theoretically two incomes) instead of a household headed by an individual. Unfortunately, only two homes would be available to an individual earning the median income for Millennials with no children. A closer look with better data on apartments is needed to identify housing that is potentially affordable to individuals.
Click here to read the full report, download the report as a PDF, or access the data and methodology.
Notes
[1] Blagg, K., Chingos, M., Corcoran, S. P., Cordes, S. A., Cowen, J., Denice, P., . . . Valant, J. (2018). The Road to School: How Far Students Travel to School in the Choice-Rich Cities of Denver, Detroit, New Orleans, New York City, and Washington, DC. Washington: Urban Institute. doi:https://www.urban.org/research/publication/road-school-how-far-students-travel-school-choice-rich-cities-denver-detroit-new-orleans-new-york-city-and-washington-dc
[2] Office of the Deputy Mayor for Education. (2017). Citywide Factsheets. Retrieved from https://dme.dc.gov/node/1200485
[3] This is similar to the income of $82,049 for a millennial household without children (United States Census Bureau, 2016), but this may include other non-millennial earners.
[4] For Millennials who do have children, there is a large divide in household income by marital status. Median income of an unmarried Millennial head of household with two children is $25,042, compared to $102,077 for married counterparts (see Appendix Figure 4). This wide gap puts many housing options out of reach for some families.
[5] For the purpose of this analysis, single-family homes include detached, row, and semi-detached.
[6] For more information, see the Taking Stock of the District’s Housing Stock: A methodology write-up.
[7] On any income above 150 percent of the poverty level, which is $25,100 for a family of four in 2018 (United States Department of Health and Human Services, 2018).
[8] Federal Student Aid, U.S. Department of Education. (2018, July 30). Repayment Plans. Retrieved from https://studentaid.ed.gov/sa/repay-loans/understand/plans
[9] Child Care Aware of America. (2017). Parents and the High Cost of Child Care. Arlington: Child Care Aware of America. Retrieved from https://usa.childcareaware.org/wp-content/uploads/2017/12/2017_CCA_High_Cost_Report_FINAL.pdf
[10] As an example, a married millennial couple with one child and a household income of $72,886 pays an estimated $9,999 in federal income tax (Internal Revenue Service, 2017) and an additional $4,593 in D.C. income tax (D.C. Office of Tax and Revenue, 2017), leaving $58,294 for other expenses. If they claim three exemptions at $4,050 each, their AGI would be around $60,736 ($23,086 over the exempted amount of 150 percent of the federal poverty level in the calculation of an income-driven student loan payment), resulting in potential student loan payments of $2,308 per year. After factoring in the cost of childcare for one child, this leaves about $33,000 for housing and other expenses.
[11] Out of all single family homes in the Taking Stock database, 37 were dropped because they were missing bedroom data to estimate capacity consistently and two were dropped as outliers.
[12] Location of potentially affordable housing would mean migration within D.C. for Millennials, as the population is currently concentrated in the center of the city, with over half the total population in the school boundaries for Ross ES, Cleveland ES, and Walker-Jones ES (see Appendix Figure 5).
[13] Data on where some Senior Citizens live comes from the Senior Citizen Property Owner Tax Relief data in the Office of the Chief Financial Officer’s (OCFO) Integrated Tax System Public Extract Property Sales dataset. If a property owner is over the age of 65, owns more than half the unit, lives in home, and has an income lower than the required amount ($130,550 as of 2018), he or she can file for this exemption.
[14] Office of Planning. (2015). Single Age Population Forecast Methodology. Washington, D.C. Retrieved from https://planning.dc.gov/node/1212966
[15] Josephson, A. (2018, May 14). The True Cost of Living in Washington, D.C. Smart Asset. Retrieved from https://smartasset.com/mortgage/the-true-cost-of-living-in-washington-dc
[16] This assumes that housing costs should be no more than 30 percent of income and uses average rent data from myapartmentmap.com.
[17] Sayin Taylor, Y. (2015). Residents move into the city for jobs, move out for housing. Washington, D.C.: District, Measured. Retrieved from https://districtmeasured.com/2015/06/08/residents-move-into-the-city-for-jobs-move-out-for-housing-2/
[18] For the purpose of this analysis, single-family homes include detached, row, and semi-detached.
[19] For more information, see Taking Stock of the District’s Housing Stock: A methodology write-up.
[20] For more information, see Will children of current Millennials become future public school students: Methodology and data.