
In 2023, the District of Columbia will review address-based student assignments – known as boundary assignments – to determine which District of Columbia Public Schools (DCPS) students are entitled by-right to attend based on their residential address.
This report examines where students are more likely to attend their by-right school, which by-right schools are most representative of all public school students, and how enrollment compares to capacity at by-right school facilities. It also highlights the areas of the city where changes to student assignment policies could impact the largest number of students.
Quick links
- Access a printer-friendly PDF version of the full report here.
- Access the 1-page report summary here.
- View the launch event, including a recording, here.
1. Introduction
In 2023, the District of Columbia will review address-based student assignments – known as boundary assignments – to determine which District of Columbia Public Schools (DCPS) schools are students entitled to attend by-right, based on their residential address. This is only the second time since 1968 that the city will undertake such a review. (The other was in 2014.)
The 2023 student assignment and boundary review will:
- Examine student assignments to schools by-right based on DCPS boundaries and feeder patterns,
- Evaluate if there is adequate capacity in by-right DCPS facilities, including at each grade band, and
- Look for opportunities to create equitable access to high-quality DCPS schools.
D.C. has much racial and economic residential segregation, and much public school choice. Citywide, just 28 percent of students attend their by-right school — but the share of students attending their by-right school varies greatly across different parts of the city. Students in more affluent areas are more likely to opt into their by-right school. These factors make D.C.’s review of student assignments a unique process and require a robust fact base.
The purpose of this report is to present D.C. residents with clear, easy to digest information on the District’s school boundaries and to increase knowledge on the current state of by-right school enrollment.
This analysis examines the 98 by-right schools (or 104 by-right schools if counting schools’ multiple education campuses serving different grade bands). We focus on:
- Where students are most likely to attend their by-right school or choose other options,
- How well the student population is represented at DCPS by-right schools, and
- The extent to which DCPS by-right school facilities are utilized.
The report begins with context on D.C.’s previous and current review processes, then moves to an analysis of the role of school boundaries.
Findings
Several findings emerge from this analysis as important context for the 2023 boundary and student assignment study:
- Fewer than half of D.C.’s public schools — 98 out of 249 — are by-right schools, with seats guaranteed for students who live in a boundary area.
- Most students in D.C. do not attend their by-right school: Instead, 72 percent of students in D.C. apply through the common lottery to attend a citywide DCPS school, another DCPS school as an out-of-boundary student, or a public charter school.
- Boundary participation varies greatly across the city: Of the city’s 9 feeder patterns, 1 (Jackson-Reed) has a boundary participation rate that is almost three times greater than the city average. In contrast, 4 other feeder patterns have boundary participation rates of less than 20 percent.
- Younger students are more likely to attend their by-right school: Elementary grades have the highest boundary participation rates, at 31 percent. High schools have the lowest at 20 percent.
- In general, by-right schools are not racially and ethnically representative of students across the city. This is, in part, because of neighborhood demographics: At 53 of D.C.’s 104 by-right schools, the share of Black students is at least 5 percentage points higher than the city average for the grade band.
- In the feeder pattern with the highest boundary participation, Black students are underrepresented and white students are over-represented: Jackson-Reed is unique in this discrepancy.
- By-right schools in D.C. are more socioeconomically representative than racially or ethnically representative: One of every three schools within 15 percentage points of the city average for at-risk students compared to one out of every five schools within 15 percentage points of the city average for Black students.
- Facility utilization rates vary across the city and by grade band. There are some pockets of high utilization even where boundary participation is low: Just 9 facilities are flagged as over-utilized and 16 facilities are flagged as under-utilized.
Glossary of key terms
Boundary participation rate
The boundary participation rate is the percent of public school students living in each school’s boundary who attend the associated by-right school. The numerator is the number of in-boundary students enrolled at the school and the denominator is all grade-specific public school students living in the boundary.
By-right school
A by-right school is the school for which a student has the guaranteed right to enroll. (Students are not guaranteed a seat in pre-kindergarten.) Every residential address has an assigned by-right elementary, middle, and high school.
Facility utilization rate
Facility utilization rates show the extent to which a building is used. It is calculated as enrollment divided by programmatic capacity.
Feeder pattern
A feeder pattern is the set of elementary, middle, and high schools that a student can attend by-right in DCPS. There are nine feeder patterns in the District of Columbia, and this report names them by the by-right high school since all by-right elementary and middle schools feed into one of these nine by-right high schools.
Grade band
For this analysis, grade bands group students into elementary (pre-kindergarten through grade 5), middle (grades 6 to 8), and high (grades 9 to 12) schools depending on their grade of enrollment.
School boundary
School boundaries map students to their elementary, middle, or high by-right school based on residential address (students are not guaranteed a seat in pre-kindergarten).
Student assignment policy
Student assignment policy determines who gets to go to which school, what rights students have for remaining in a school they have chosen, and what rights students have for transferring between schools. This can include geographic school boundaries, feeder patterns, matches in the lottery, and other preferences.
2. Boundary studies past and present
Since 1968, the District of Columbia has taken on a review of school boundaries only once, in 2014. There are key differences between the circumstances of the 2014 review, and the forthcoming 2023 review.
The 2014 Student Assignment & School Boundaries Review Process
In 2014, D.C. embarked on a review of student assignment to by-right schools – the first review of its kind in many decades. The purpose of that 2014 boundary review was to update a complicated and outdated boundary assignment system precipitated by school closures that took place in 2008 and 2011, and an increase in the share of students attending public charter schools.1Specifically, DCPS school closures across the city (38 schools in total) had caused confusing school feeder patterns, wherein some students had rights to multiple schools, and others were assigned to schools that were not easily walkable.
The 2014 review largely sought to clarify student assignment, make future enrollment more certain, reduce student movement, relieve travel burdens, create coordinated planning for school capacity across the city to increase funding efficiency, and increase school utilization rates.2
The review was led by the Office of the Deputy Mayor for Education (DME), with recommendations for student assignment put forward by an Advisory Committee. The review benefited from feedback from focus groups of parents and residents, surveys, and working groups. There was also an interactive website for residents to see the impact of various options, as well as government-sponsored community meetings and public hearings.
The final report provided a new map of boundary assignments and associated feeder patterns, with each residential address assigned to a single school for each grade band.
The report also offered recommendations on steps the city should take to increase capacity and equitable access, and plan for education infrastructure to ensure public funds are spent efficiently.3 Among the recommendations was that the city should undergo periodic comprehensive reviews of student assignment policies, including boundaries and feeder patterns. This recommendation was codified in the Fiscal Year 2023 Budget Support Emergency Act of 2022,4 which requires a new boundary and student assignment study in 2023 and subsequently every 10 years.
The 2023 Student Assignment & Boundary Study
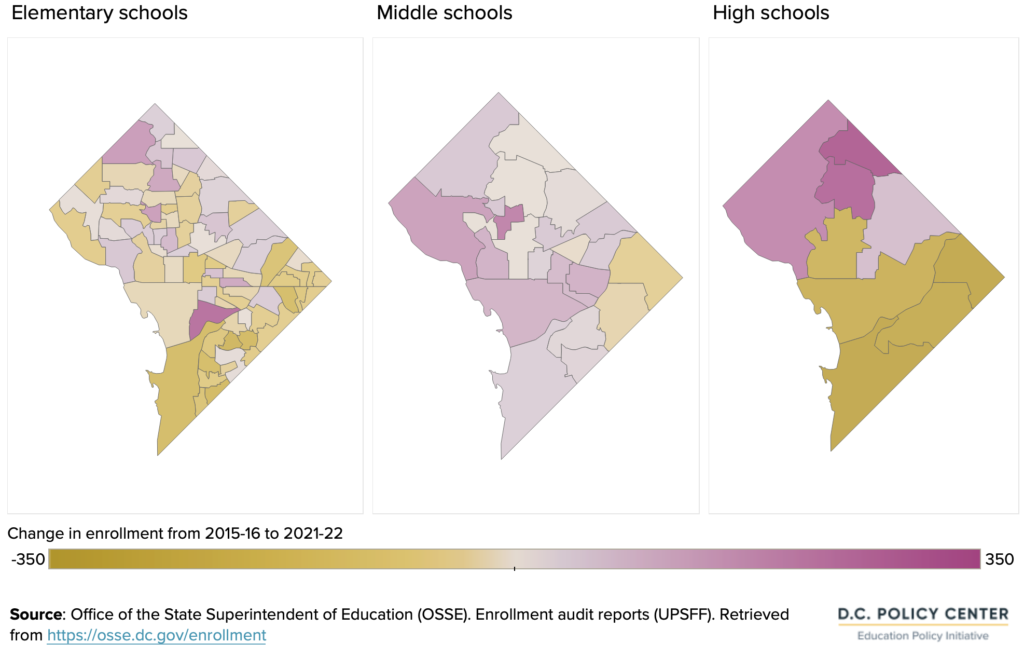
D.C.’s 2023 Student Assignment & Boundary Study will take place under very different circumstances than the 2014 study. First, today there is no confusion on feeder patterns, unlike in 2014. Second, also unlike the 2014 study, which followed DCPS school closures, DCPS has since opened five citywide schools and has plans to open new by-right schools. Third, although the level of total DCPS enrollment has remained almost the same since the previous changes went into effect, enrollment has shifted away from some by-right schools, leaving some elementary and high schools in Wards 7 and 8 especially, with lower enrollment.5
Figure 1. Enrollment change in DCPS by-right schools, 2015-16 to 2021-22
The 2023 review will revisit three areas of recommendations from the 2014 report:
- Student assignments to by-right schools,
- Capacity in by-right DCPS facilities, and
- Equitable access to high-quality DCPS schools as defined in the review process.
3. Schools and school boundaries in D.C.
School boundaries assign students to DCPS by-right schools based on their home addresses. In D.C., students may also apply through a common lottery6 to attend a DCPS school as an out-of-boundary student, a citywide DCPS school, or a public charter school.
Landscape of by-right DCPS schools
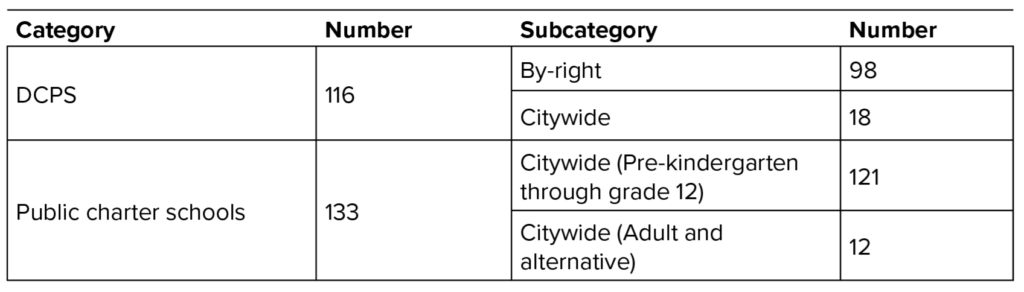
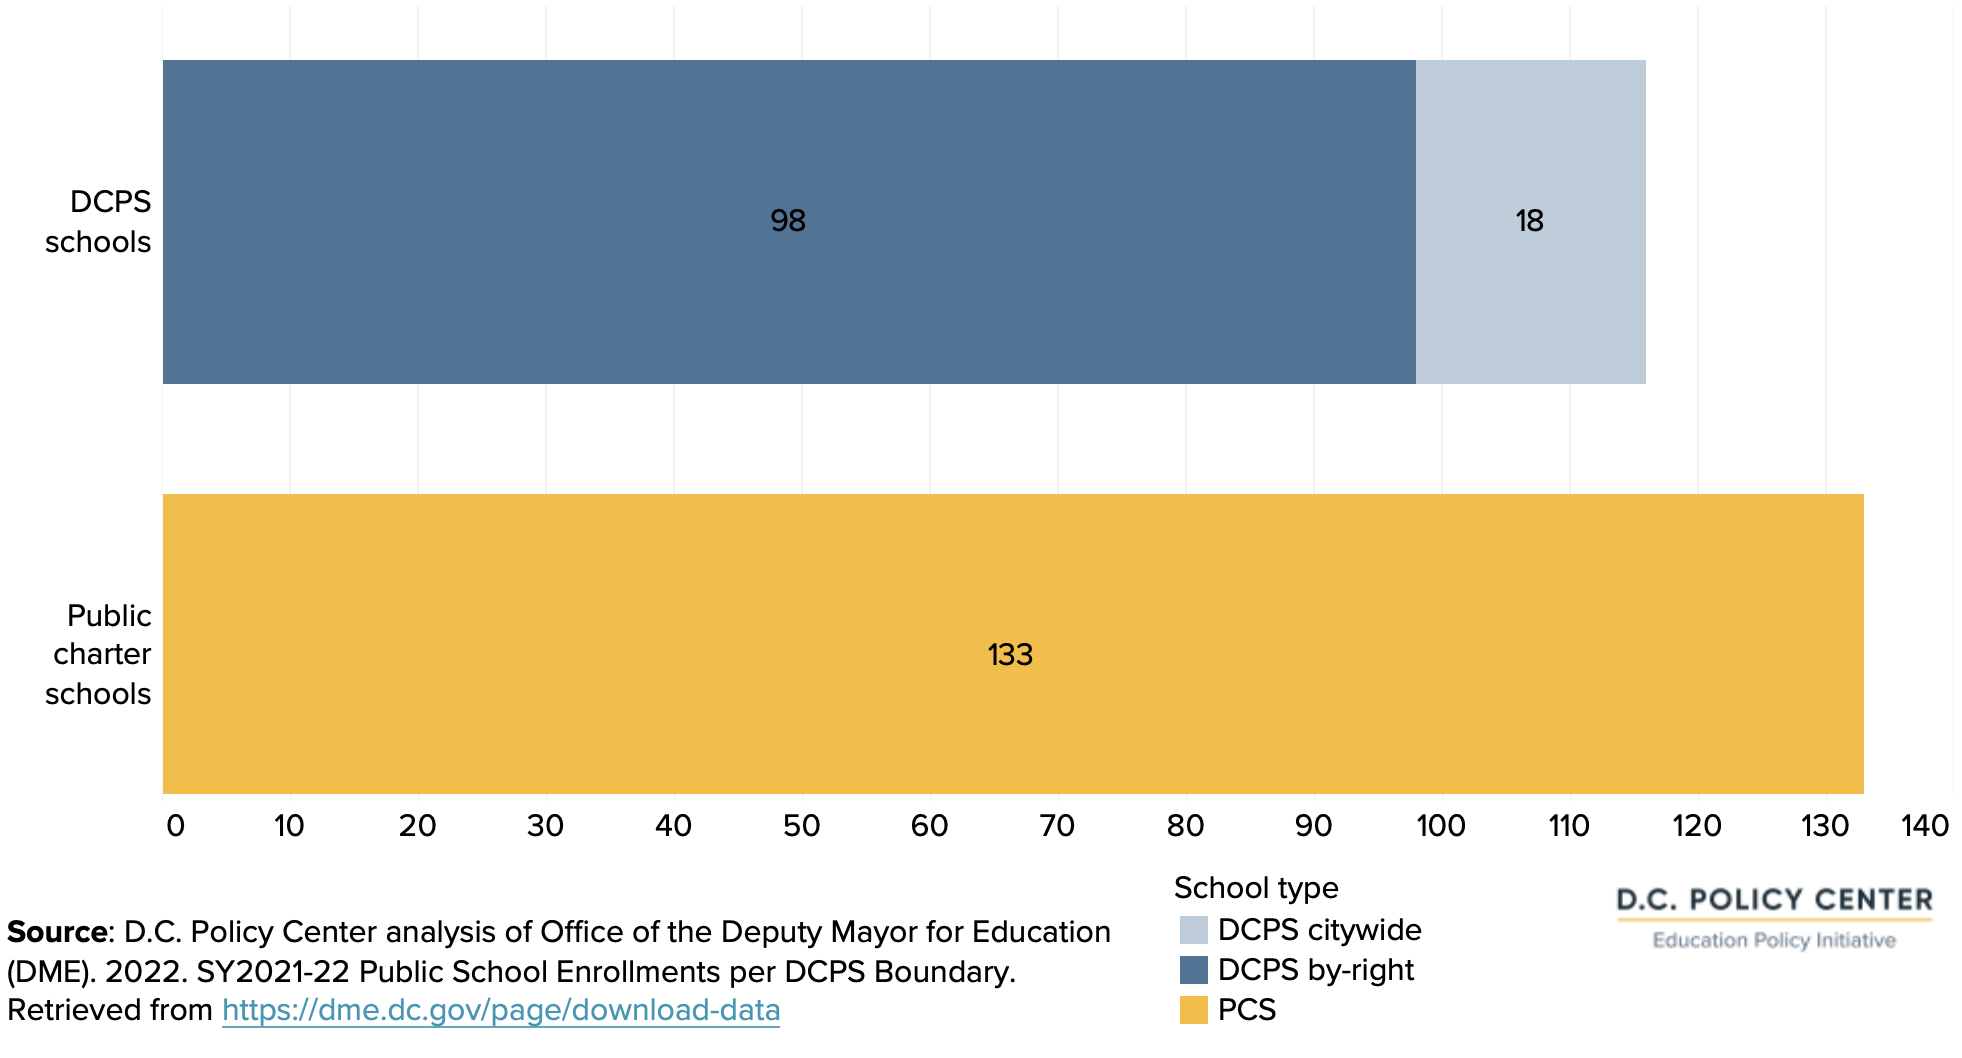
In school year 2021-22, D.C.’s public school students were served by 249 public schools, including 116 DCPS schools and 133 public charter schools. All public charter schools are citywide, and 121 public charter schools serve students in pre-kindergarten through grade 12 (12 out of the 133 public charter schools serve adult and alternative students). Out of the 116 DCPS schools, 98 are by-right schools and 18 are citywide. Ten DCPS schools are education campuses, which serve students in multiple grade bands (elementary and middle, or middle and high).
Table 1. Number of DCPS and public charter schools

Finding #1
Fewer than half of D.C.’s public schools — 98 out of 249 — are by-right schools, with seats guaranteed for students who live in a boundary area.
Figure 2. Number of DCPS and public charter schools in D.C., school year 2021-22
Counting grade bands as unique schools at education campuses that serve multiple grade bands, the 116 schools of DCPS can be considered as 126 schools.7 In this expanded set of 126 schools serving one grade band, 104 by-right schools are the focus of this analysis:
- 74 by-right elementary schools, which feed into
- 21 by-right middle schools, which then feed into
- 9 by-right high schools.
See Figure 4 for the full list of by-right DCPS schools by feeder pattern and grade band used in this analysis.
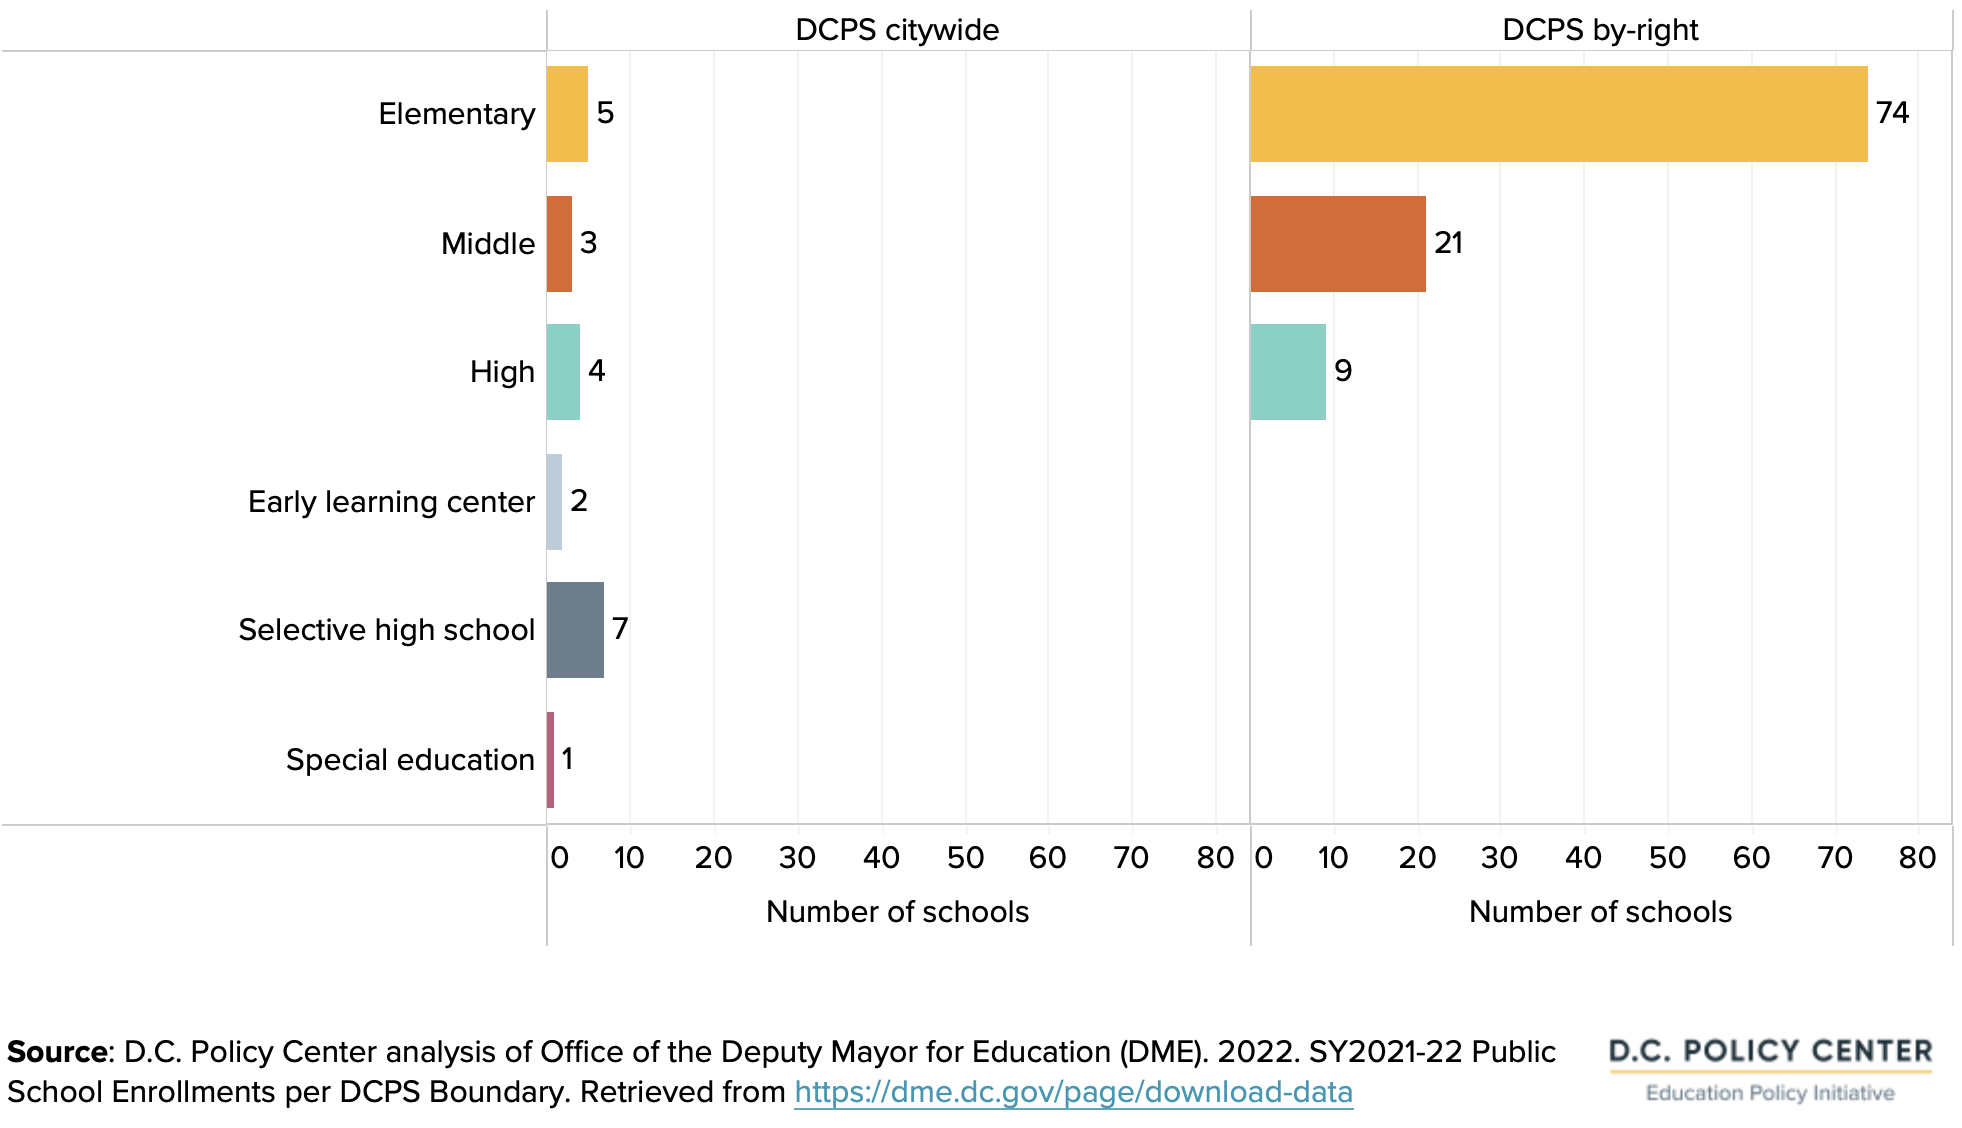
Of the remaining 22 DCPS citywide schools not accounted for above, half provide high school options: 7 selective high schools require an application for admission and 4 citywide high schools that determine admission solely through the common lottery. Other citywide DCPS schools include 5 elementary schools, 3 middle schools, 2 early learning centers, and 1 school serving DCPS students with the greatest special education needs. These schools are not considered as the focus of this report as they do not have geographic boundaries.
Figure 3. DCPS by-right and citywide schools by grade band, school year 2021-22
Finding #2
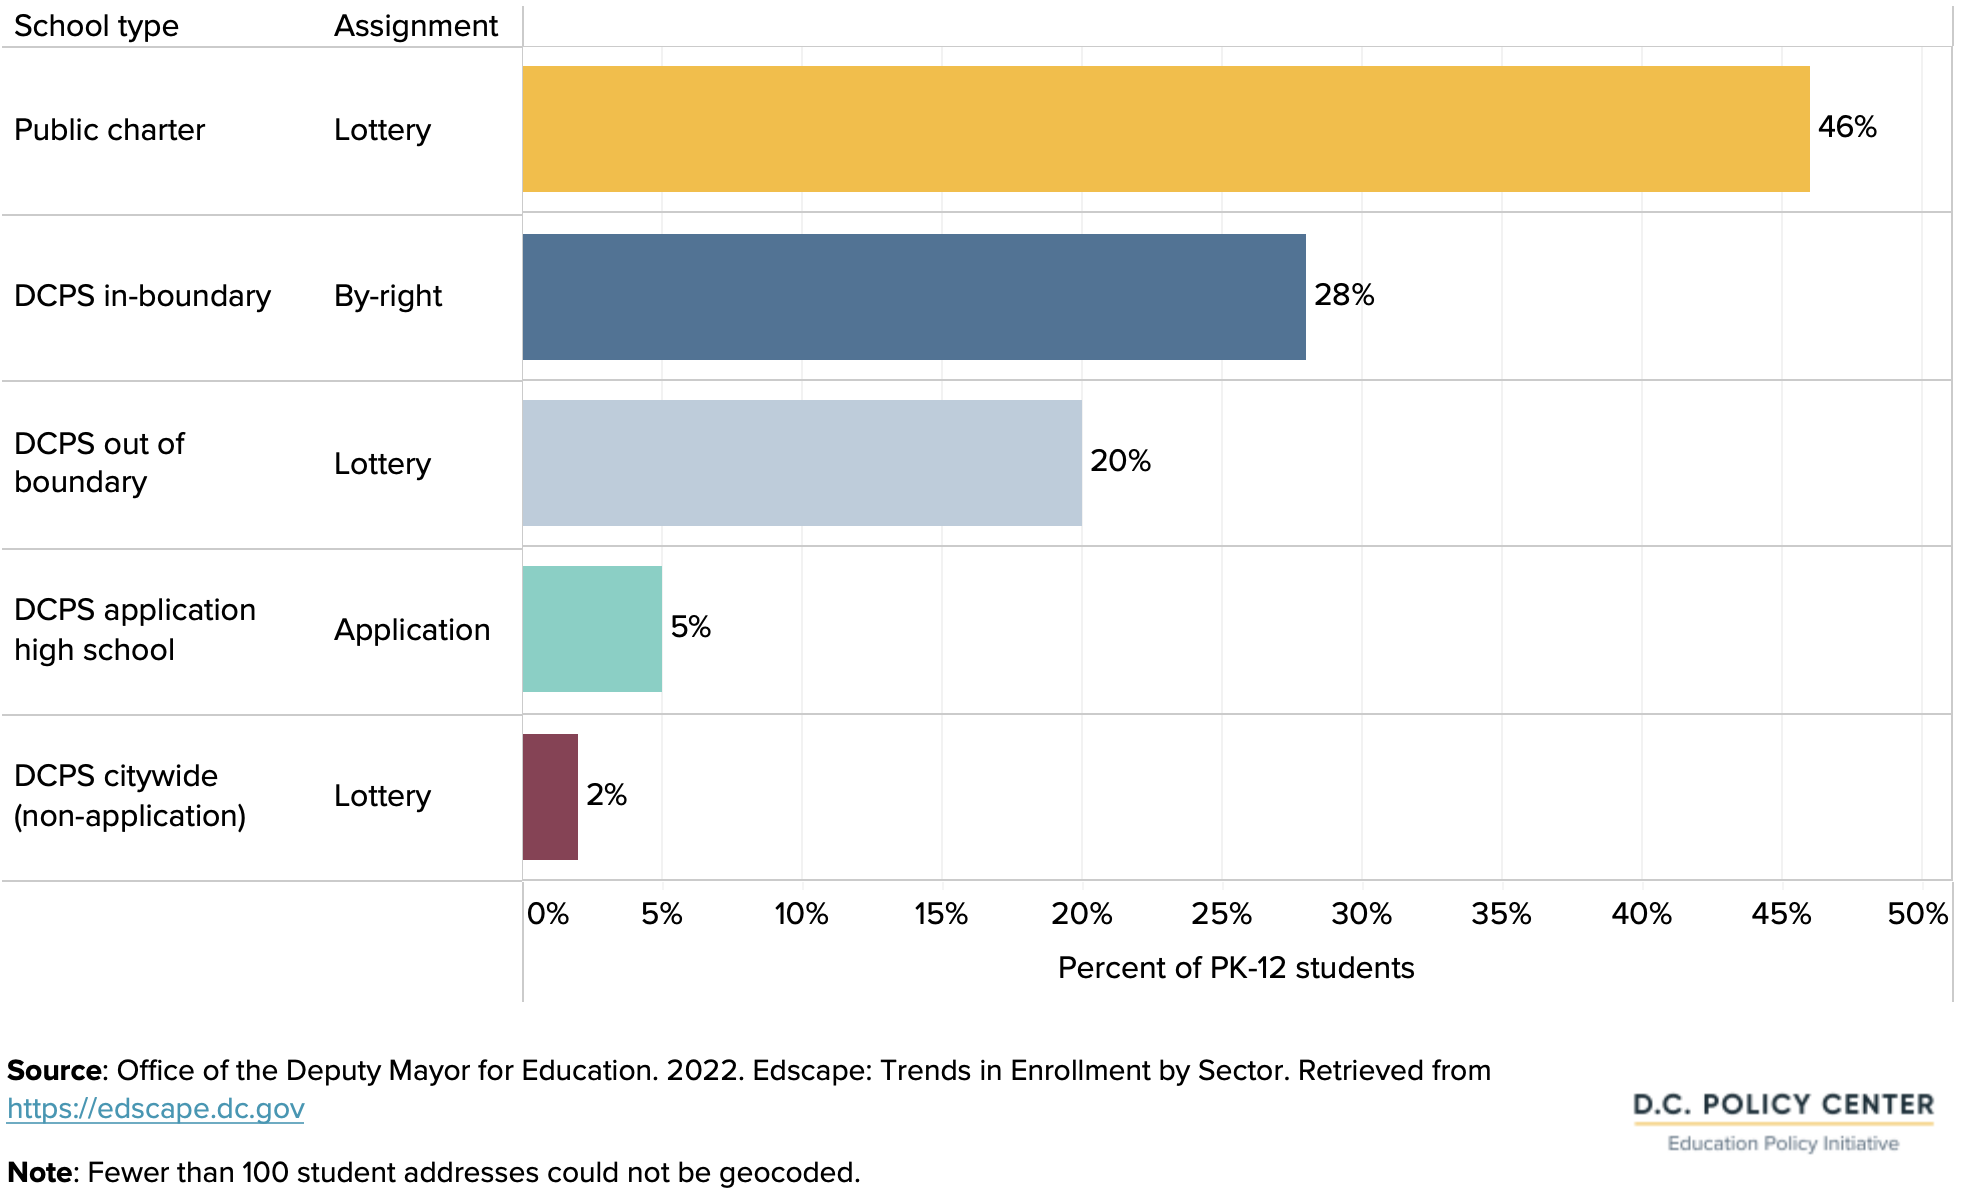
Most students in D.C. do not attend their by-right school. Instead, 72 percent of D.C. students apply through a common lottery to attend a DCPS school as an out-of-boundary student, a citywide DCPS school, or a public charter school.
28 percent of public school students attending pre-kindergarten through grade 12 in the District of Columbia attend their by-right school. Most students (72 percent) do not attend the by-right school where they have a guaranteed seat based on their address.8 Almost half of the public school students in D.C. (46 percent) attend a public charter school, 20 percent attend a DCPS by-right school but as an out-of-boundary student, and 7 percent attend DCPS citywide schools including DCPS high schools that require an application. Outside of public school, an estimated 16 percent of all school-age residents attend private school.9
Figure 4. Pre-kindergarten through grade 12 student enrollment in D.C.’s public schools by sector, school year 2021-22
Many factors influence these school enrollment choices. Parents frequently emphasize academics when asked directly what matters to them most. However, common lottery applications show that school demographics and location also influence enrollment preferences.
A recent study of how parents rank their preferences when they apply to the District’s common lottery found that parents care about academic outcomes, but they also generally prefer schools close to home, which can be related to transportation issues or other barriers during the application process. Parents also prefer schools where most of the student body has racial, ethnic, or socioeconomic backgrounds like their own children.10
When the right to access a school is based on geographic boundaries (and whether a home is located within a certain boundary), preferences for certain schools may determine housing choices. Families, especially those with more resources, tend to move to neighborhoods assigned to schools that are in high demand. This can create overcrowding in some by-right schools, especially if the school facility lacks the capacity to add more seats. Additionally, higher demand for housing in these neighborhoods can lead to higher housing prices, especially if the housing stock is limited. More expensive housing within a boundary can lead to a student body that is more affluent, and less socioeconomically diverse.
Redrawing school boundaries
From time to time, school districts may consider changing school boundaries or changing eligibility within boundaries to address changing student populations – perhaps to alleviate overcrowding, improve integration, or increase access to in-demand schools for students from other neighborhoods. These shifts redistribute the current student population, generally with a focus on an even allocation of students across schools.
D.C.’s 2023 process will look at student assignment to examine enrollment at by-right schools, adequate capacity, and equitable access.
In other districts, goals can have similar policy implications — examining integration, facility use, and innovative student assignment policies. For example, New York City made plans to increase school integration and diversity: Montgomery County, Maryland looked at facility use among other goals; and New Orleans sought to look at student priority in the lottery based on address.
These processes in other cities have lessons learned for D.C. — see the appendix for more information. One difference in D.C.’s process is combining these three policy goals of integration, facility use, and different ways to assign students to schools.
4. A look at boundary participation in DCPS
by-right schools
Boundary participation rates11 show the share of public school students who choose to enroll in their by-right school out of all public school students who are eligible to attend the school.12
Private school students are excluded from the universe to calculate boundary participation. Private school enrollment is highest in the Jackson-Reed (formerly Wilson) feeder pattern, which is the geographic area with the highest boundary participation rate. Thus, families in this area of the city are likewise making school choices, but their choice is primarily between public and private options.13
Boundary participation rates are a measure of demand for by-right schools compared to other public school options. This analysis examines:
- Boundary participation rates for elementary, middle, and high schools;
- Out-of-boundary participation in DCPS schools: the share of public school students attending a DCPS by-right school who do not live in the boundary area or who are attending a citywide DCPS school without a boundary; and
- Public charter school participation: the share of public school students attending a public charter school.
Finding #3
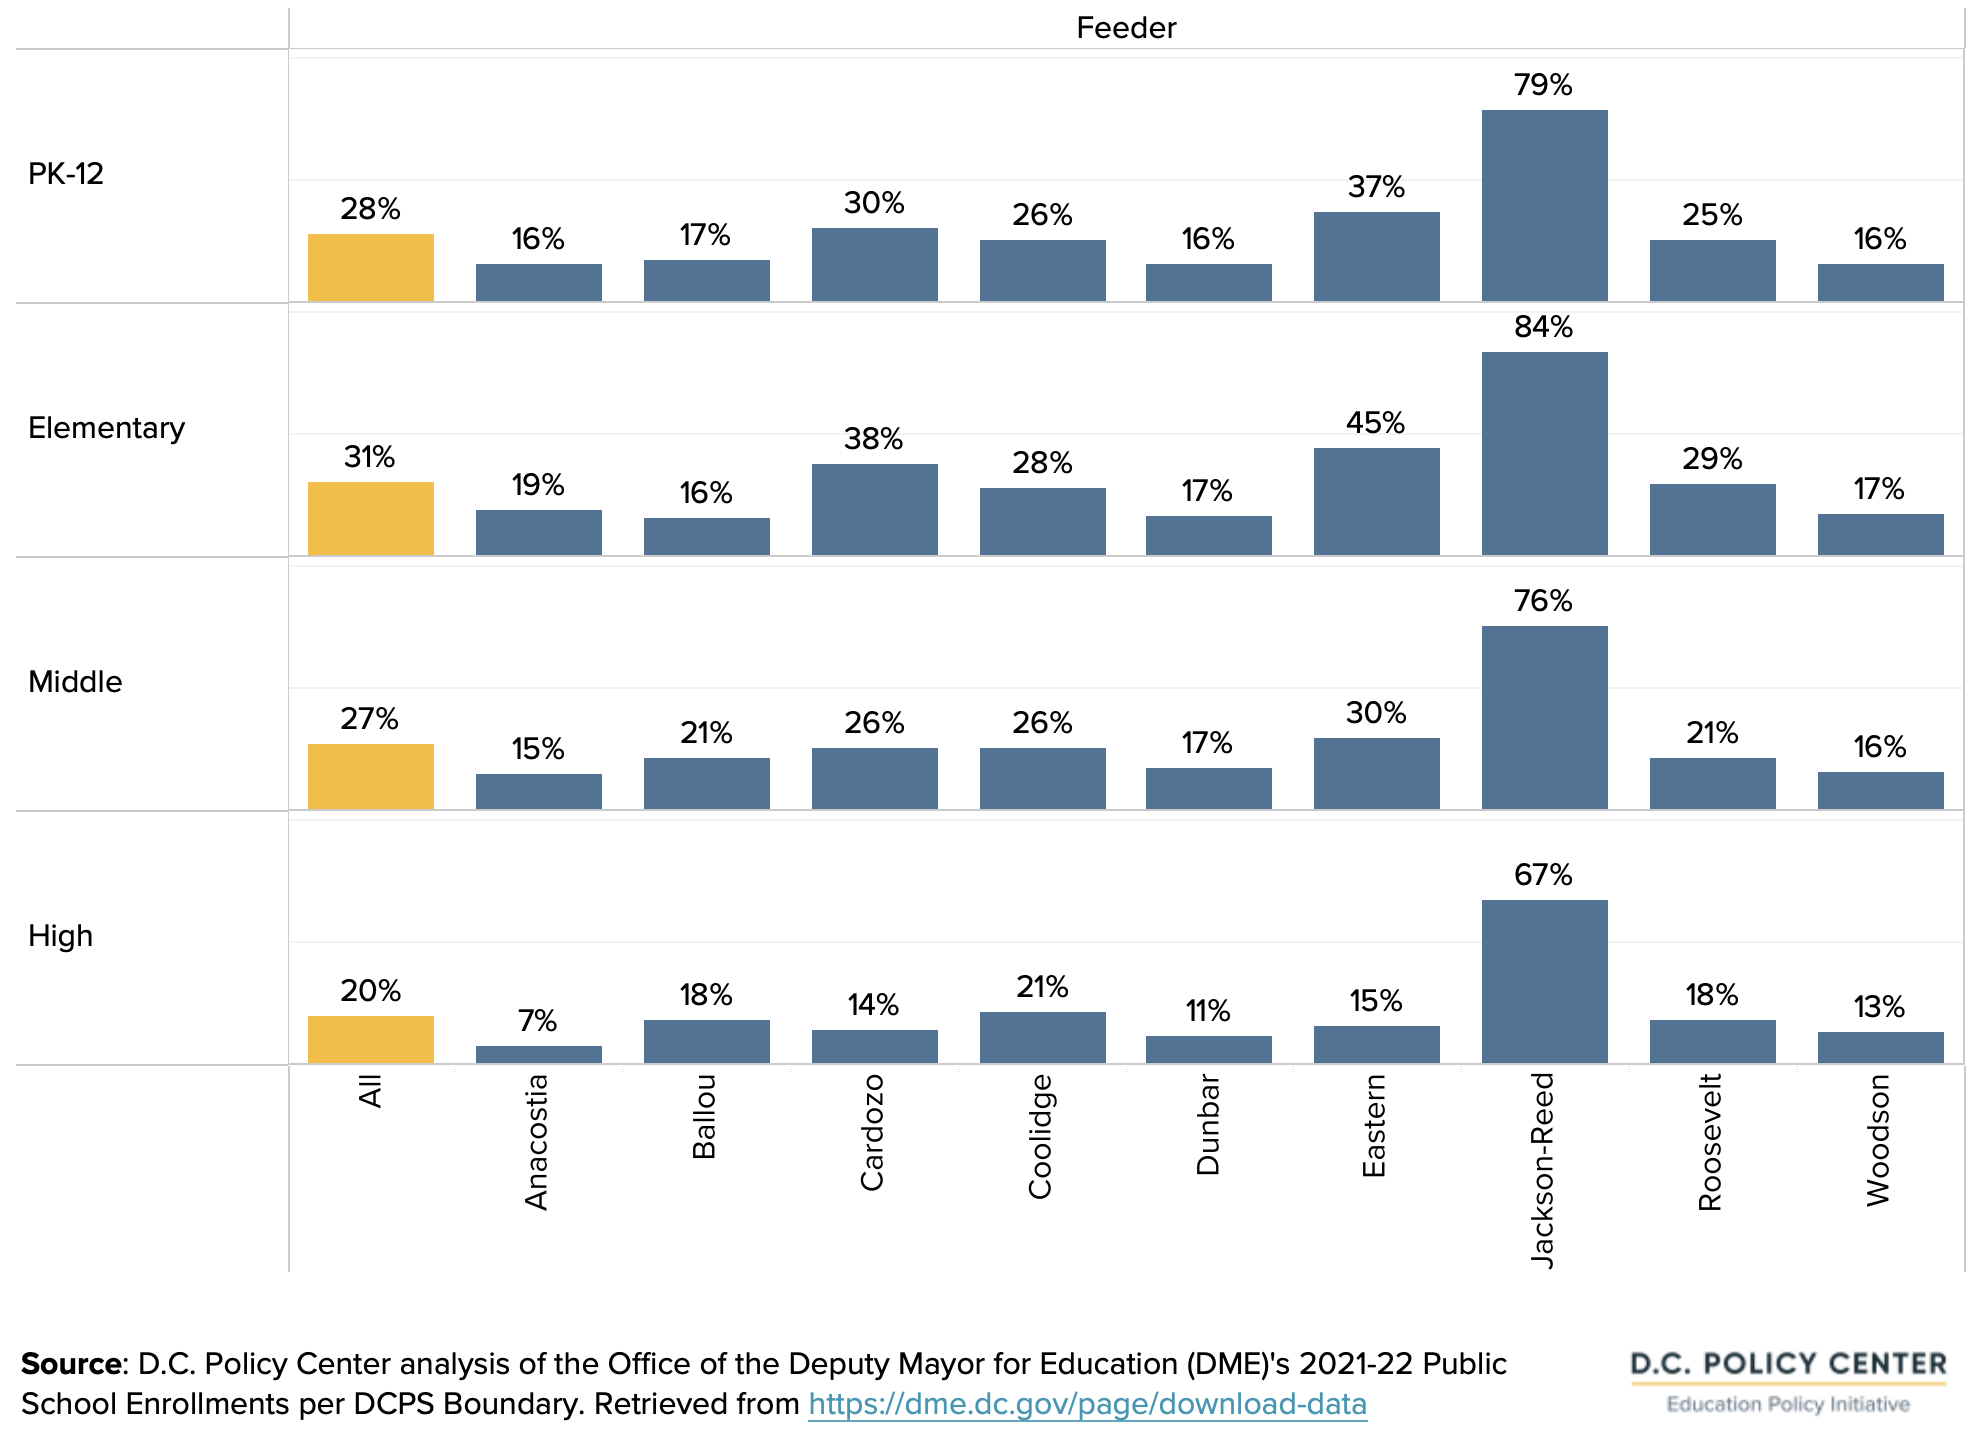
Boundary participation varies greatly across the city. Of the 9 feeder patterns, one (Jackson-Reed) has a boundary participation rate that is almost three times greater than the city average. In contrast, 4 other feeder patterns have boundary participation rates of less than 20 percent.
The average boundary participation rate across all DCPS by-right schools is 28 percent, measuring for students who attend the elementary, middle, and high schools that make up each feeder pattern.
The combined boundary participation rates are below 20 percent for the Anacostia, Ballou, Dunbar, and Woodson feeder patterns. This means that more than 80 percent of public school students living in these boundaries attend a public school option that is not their by-right school.
In stark contrast to the rest of the city, schools that make up the Jackson-Reed feeder pattern have a boundary participation rate of 79 percent, meaning that just 21 percent of students choose other public school options.
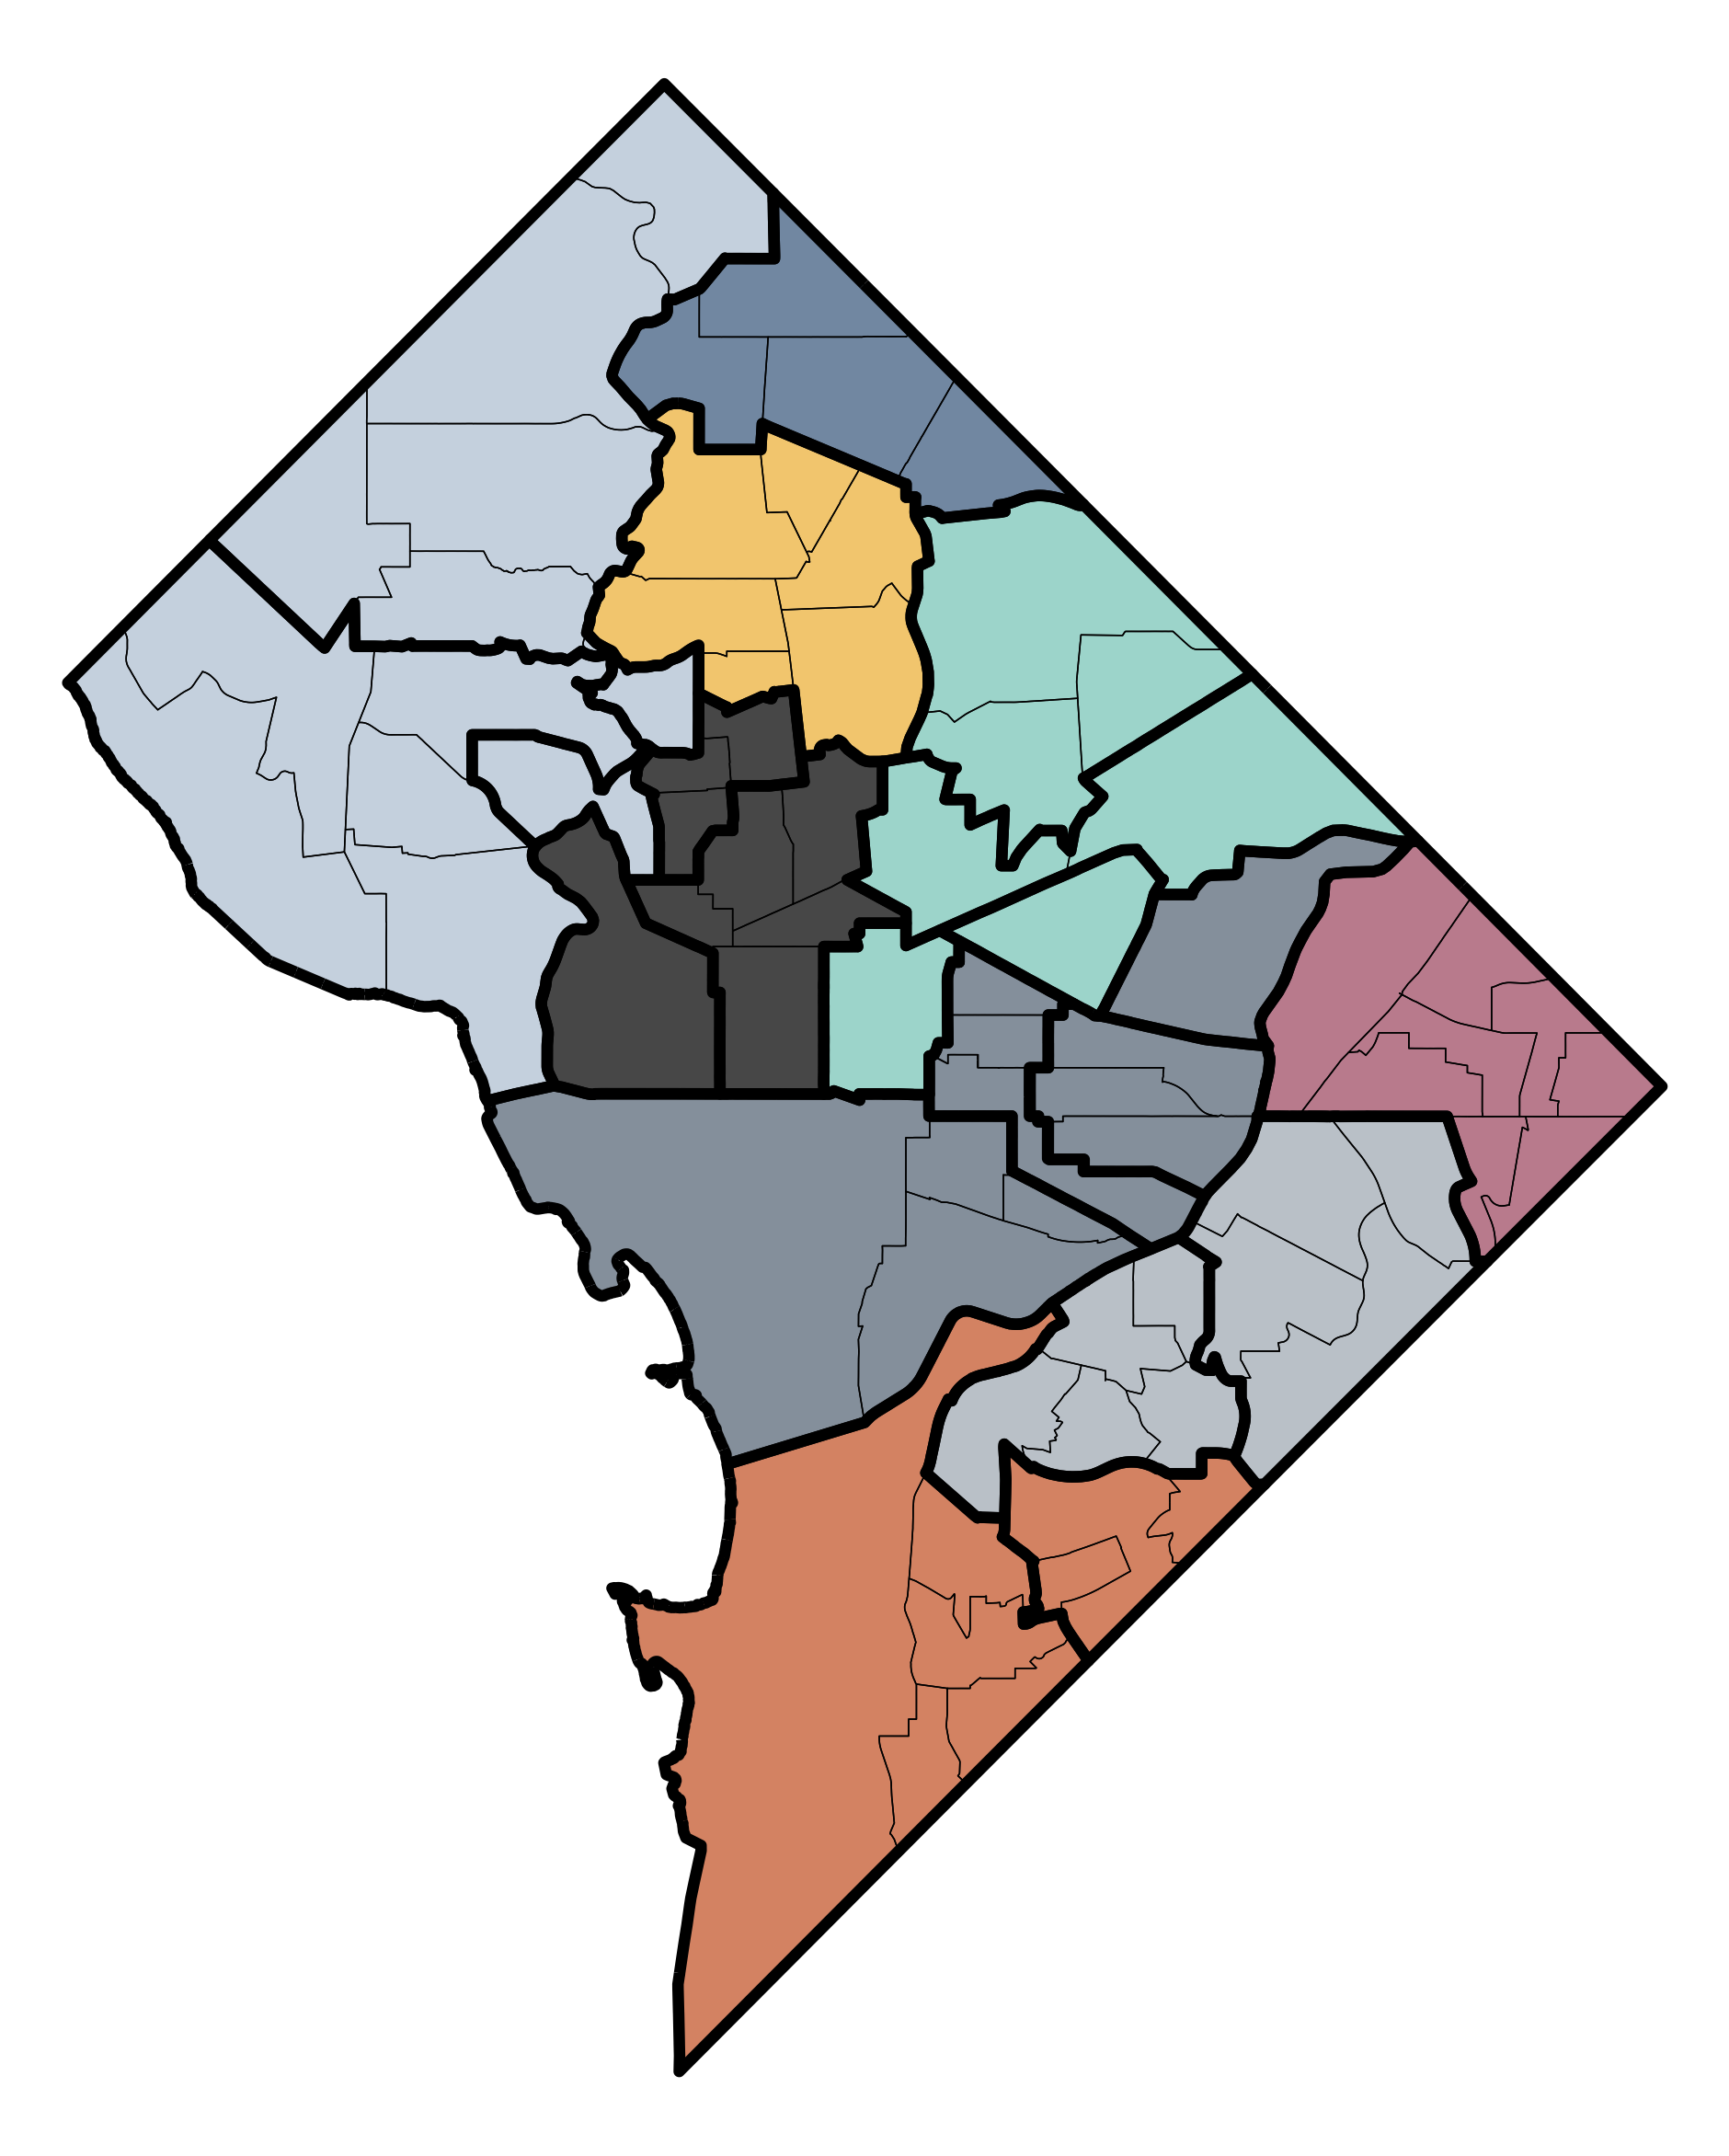
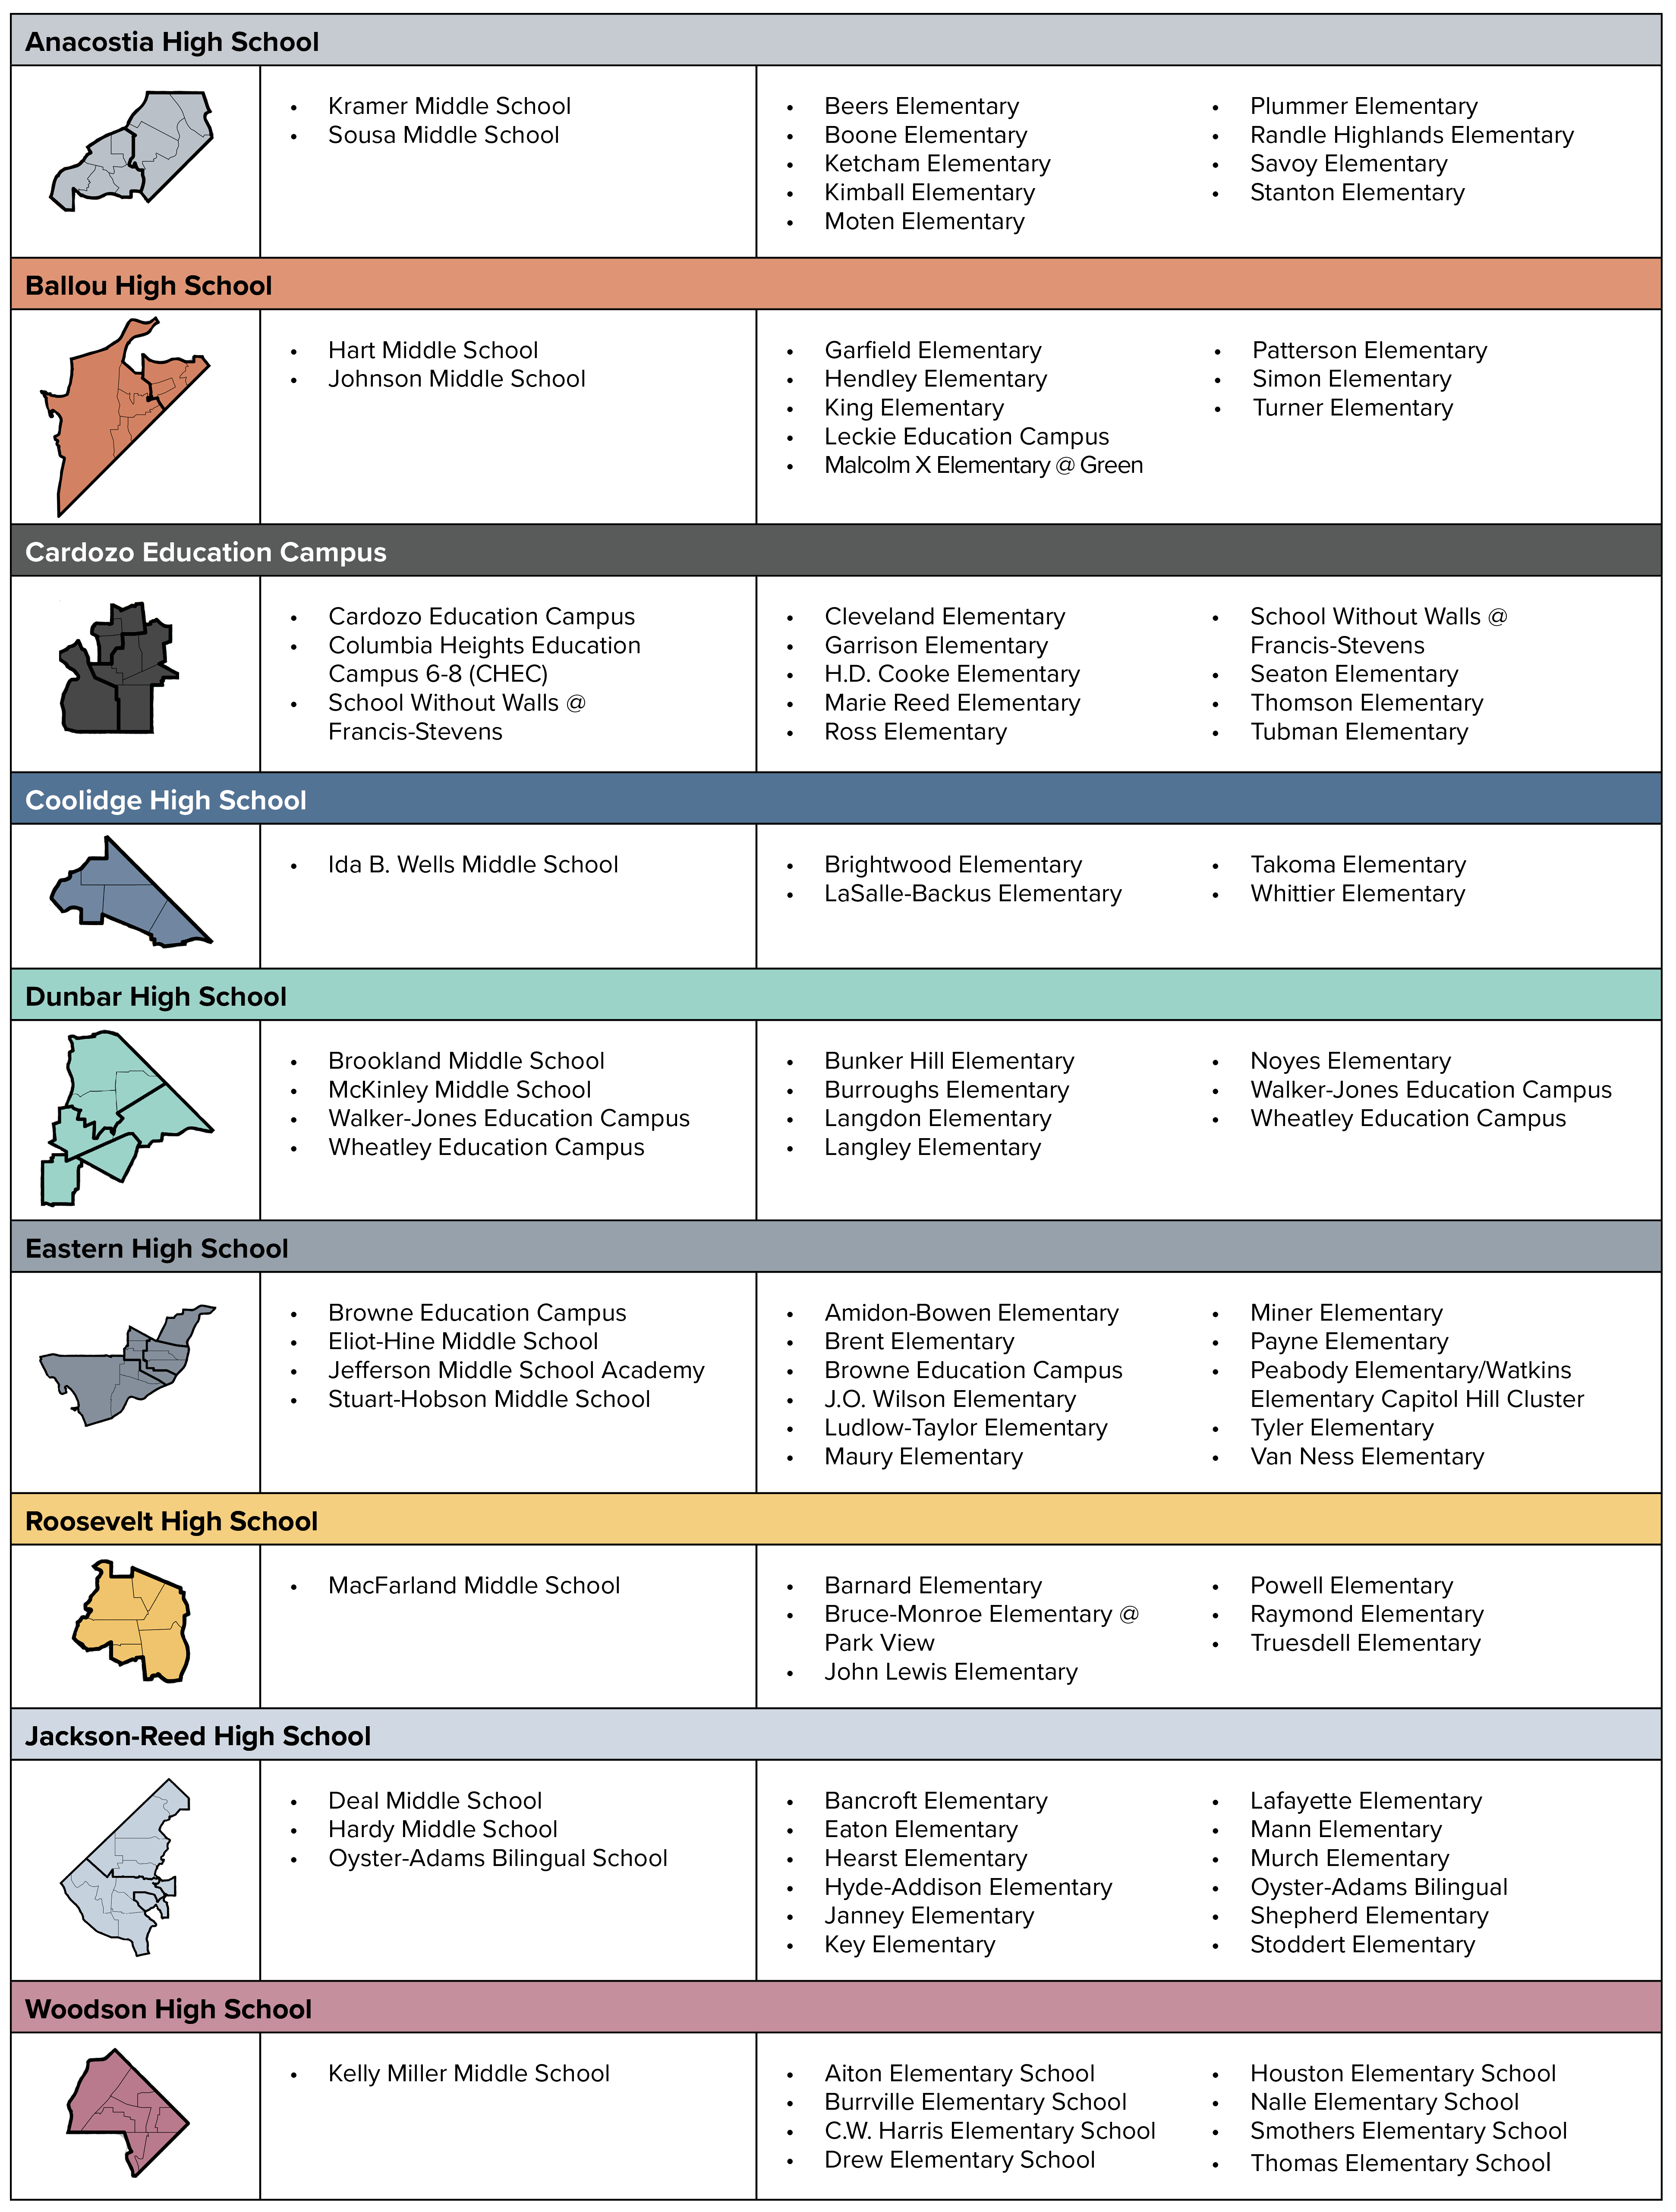
Figure 4. Current DCPS feeder patterns and by-right schools, by grade band
Finding #4
Younger students are more likely to attend their by-right school: Elementary grades have the highest boundary participation rates, at 31 percent. High schools have the lowest at 20 percent.
Elementary schools have the highest boundary participation, at 31 percent across all elementary schools. Boundary participation is 27 percent across all middle schools, and 20 percent across all high schools. The large decline in boundary participation at the high school level is due, in part, to the 11 selective and citywide DCPS high schools that are open to all students.
Figure 5. Boundary participation rate by grade band and feeder pattern, school year 2021-22
These boundary participation rates mean that adjusting geographic boundaries could have a meaningful enrollment impact for only a handful of schools that have high boundary participation rates (concentrated in the Jackson-Reed feeder pattern, which has 12 elementary schools, three middle schools, and one high school). In contiguous areas of the city where boundary participation is low, changing the geographic delineation of a boundary will not have a large effect on enrollment at by-right schools. A closer look below at maps of boundary participation and other school choices by grade band shows where these rates vary across the city.
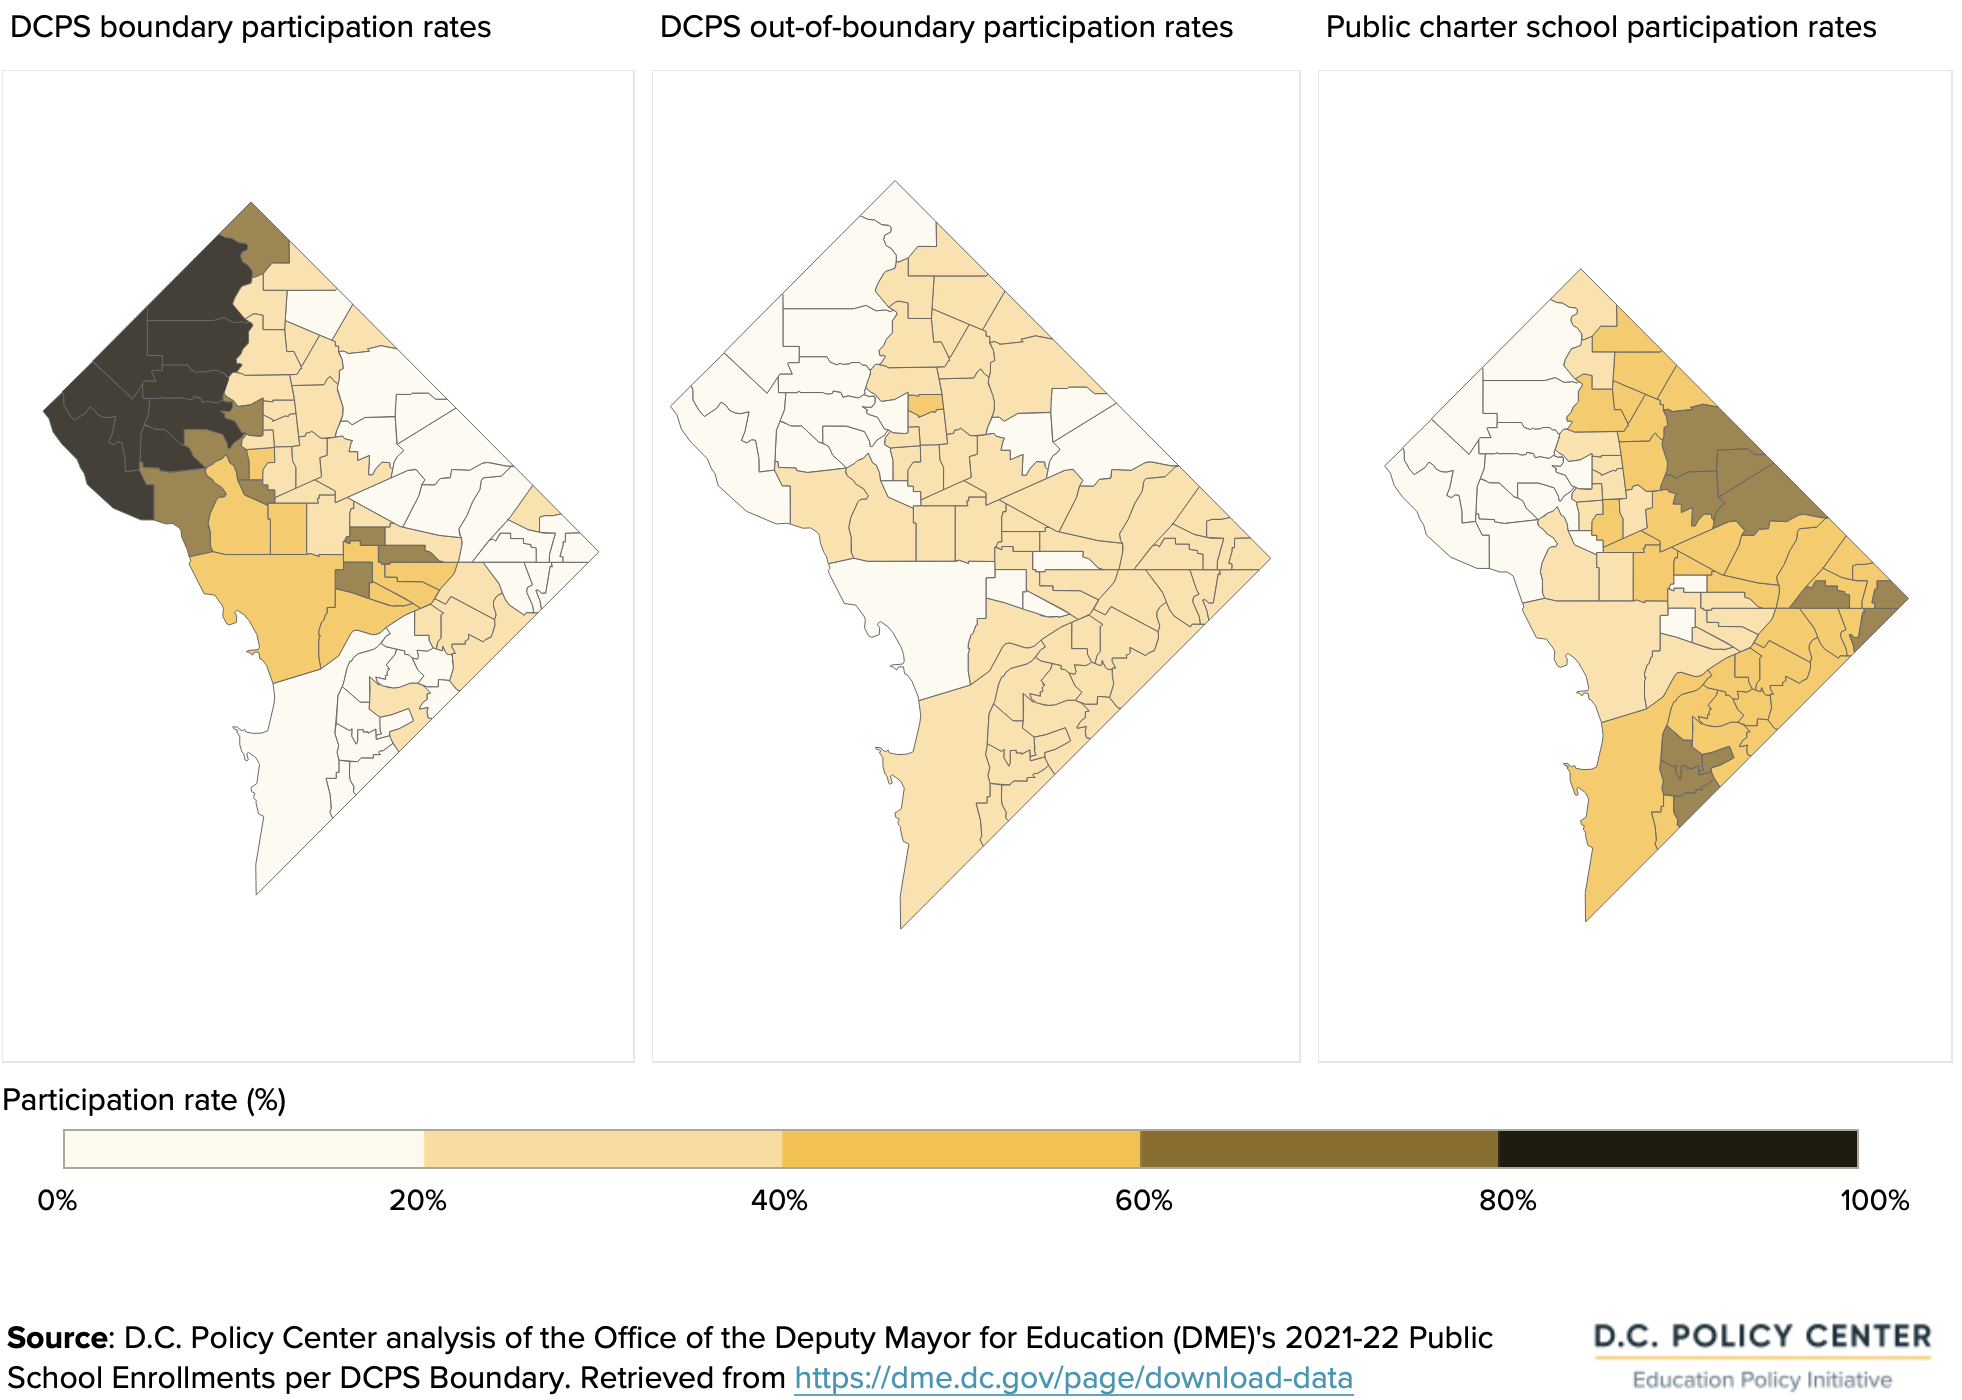
Elementary school choice
The boundary participation rate across all DCPS elementary schools is 31 percent. However, 16 elementary schools in the Jackson-Reed, Eastern, and Cardozo feeder patterns have much higher boundary participation: at least 60 percent (and as high as 90 percent).
Public charter school participation rate for elementary school students is 46 percent across the city, with rates mostly higher in the eastern and southern parts of the District.
The out-of-boundary participation rate (students attending DCPS schools but not as a by-right student) for elementary school students is 23 percent, and more consistent across the city aside from those areas with high boundary participation.
Figure 6. Types of public elementary schools that D.C. students attended, school year 2021-22
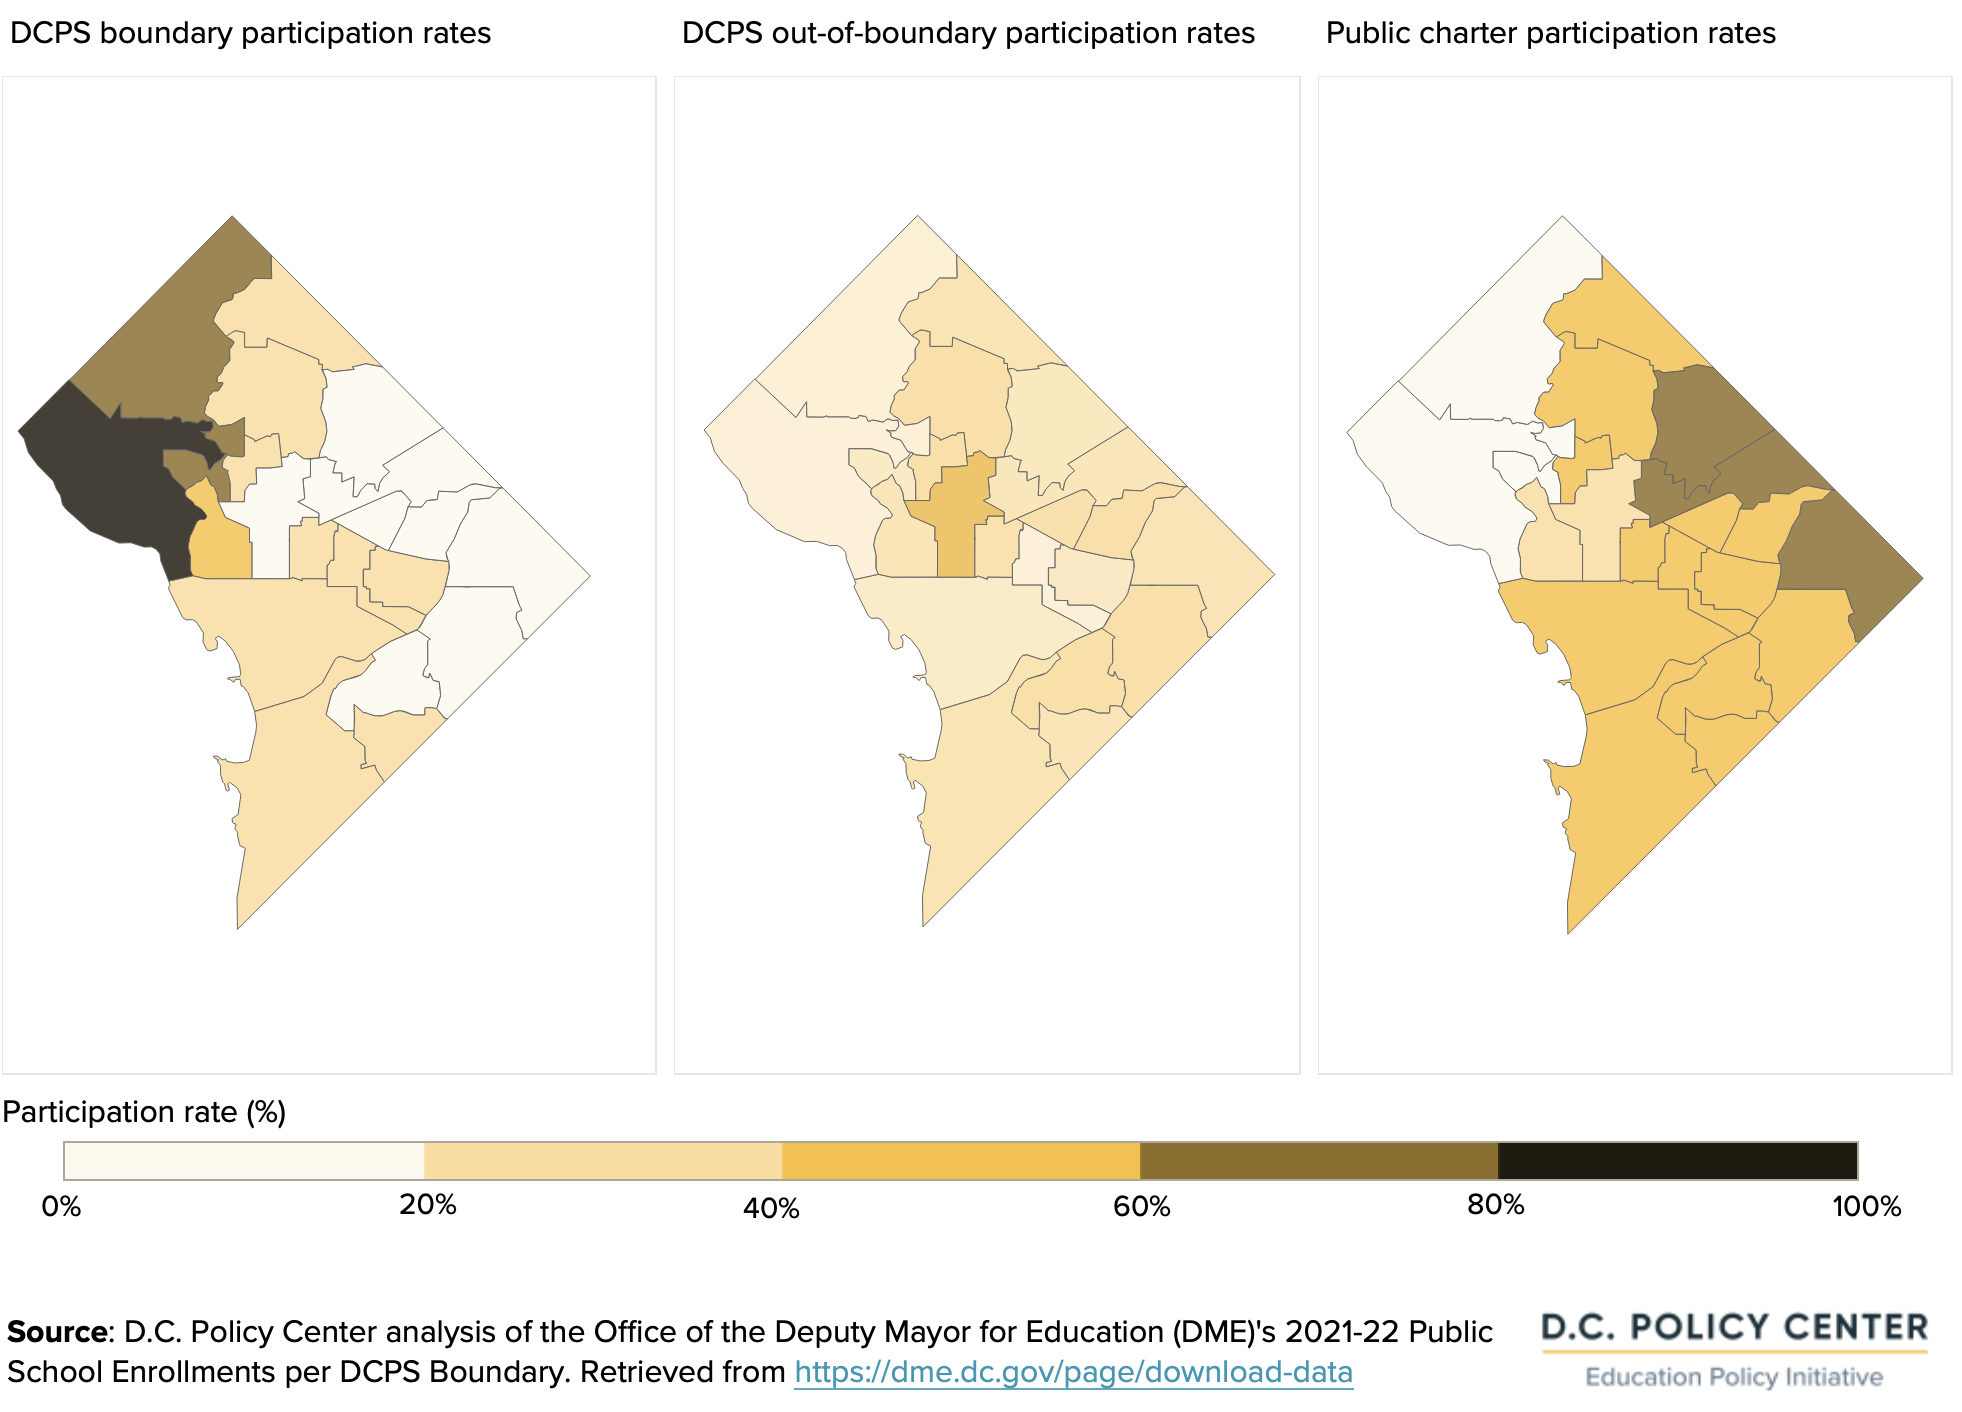
Middle school choice
At 27 percent, citywide middle school boundary participation is slightly lower than elementary schools’ 31 percent citywide participation. Of the 21 by-right middle schools in the city, only the three that feed into Jackson-Reed have high boundary participation rates — at least 60 percent.
In middle school, out-of-boundary participation rates are similar to elementary school out-of-boundary participation rates, at 21 percent, and fairly consistent across the city. Public charter school participation rises in middle school to 51 percent, and is typically higher than boundary participation for each middle school, aside from the Jackson-Reed feeder pattern’s middle schools.
Figure 7. Types of public middle schools that D.C. students attend and participation rates, school year 2021-22
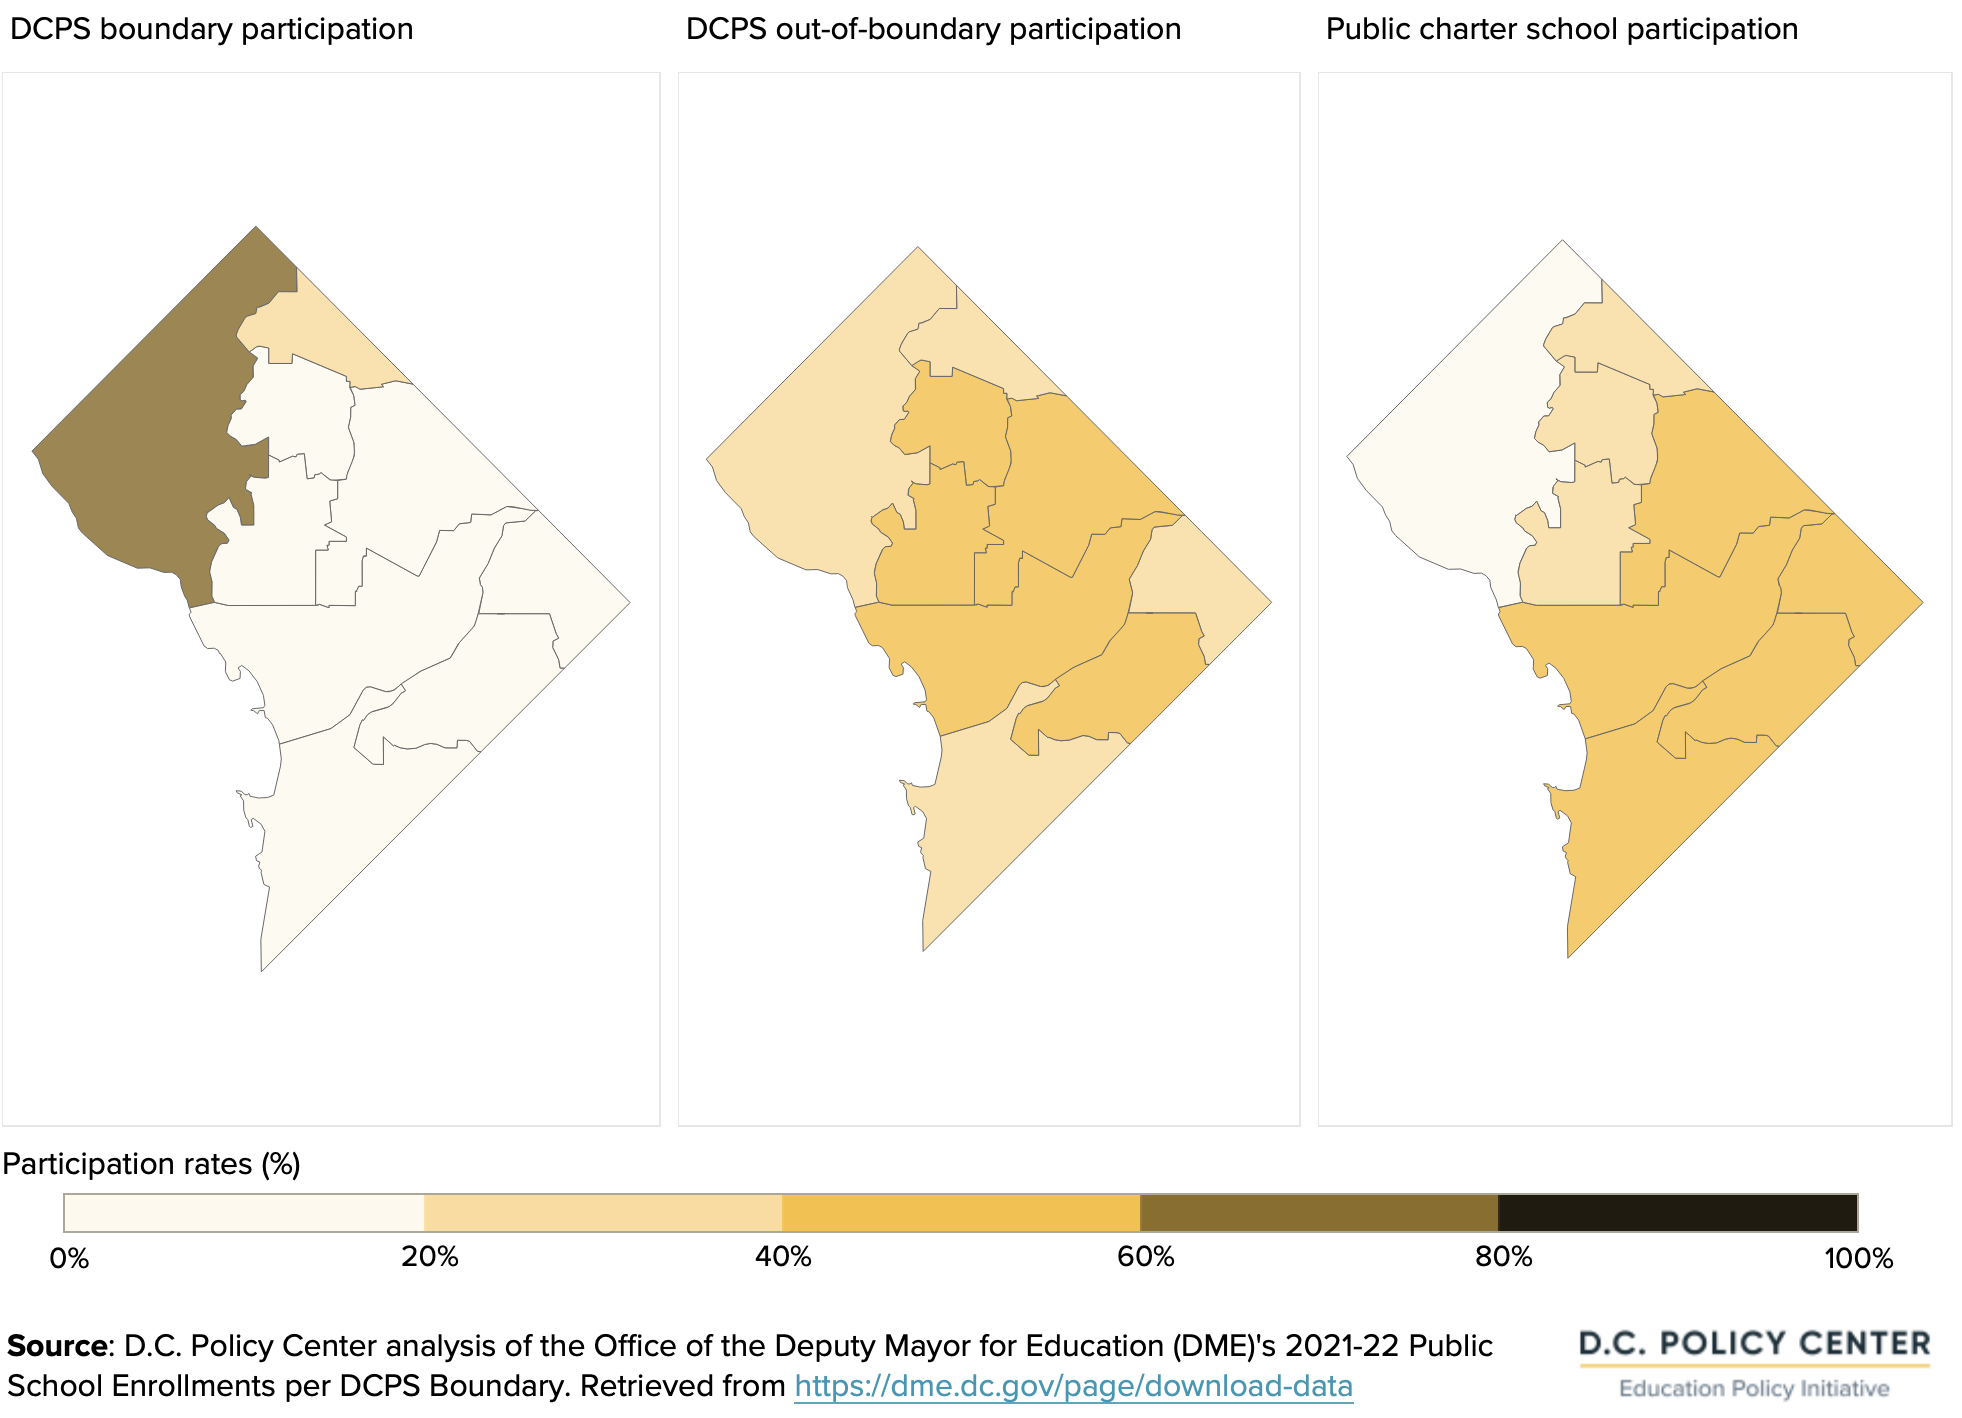
High school choice
Boundary participation rates drop again — to 20 percent — for high schools. Only Jackson-Reed High School, at 67 percent, has a boundary participation rate of more than half. For the rest of the city, students seem to split almost equally between out-of-boundary DCPS schools and public charter schools. Out-of-boundary participation at DCPS’s citywide high schools, including enrollment at the 11 DCPS selective high schools and programs, is 39 percent. Public charter school participation is at 42 percent.
Figure 8. Types of public high schools that D.C. students attended, school year 2021-22
5. Student group representation in by-right schools
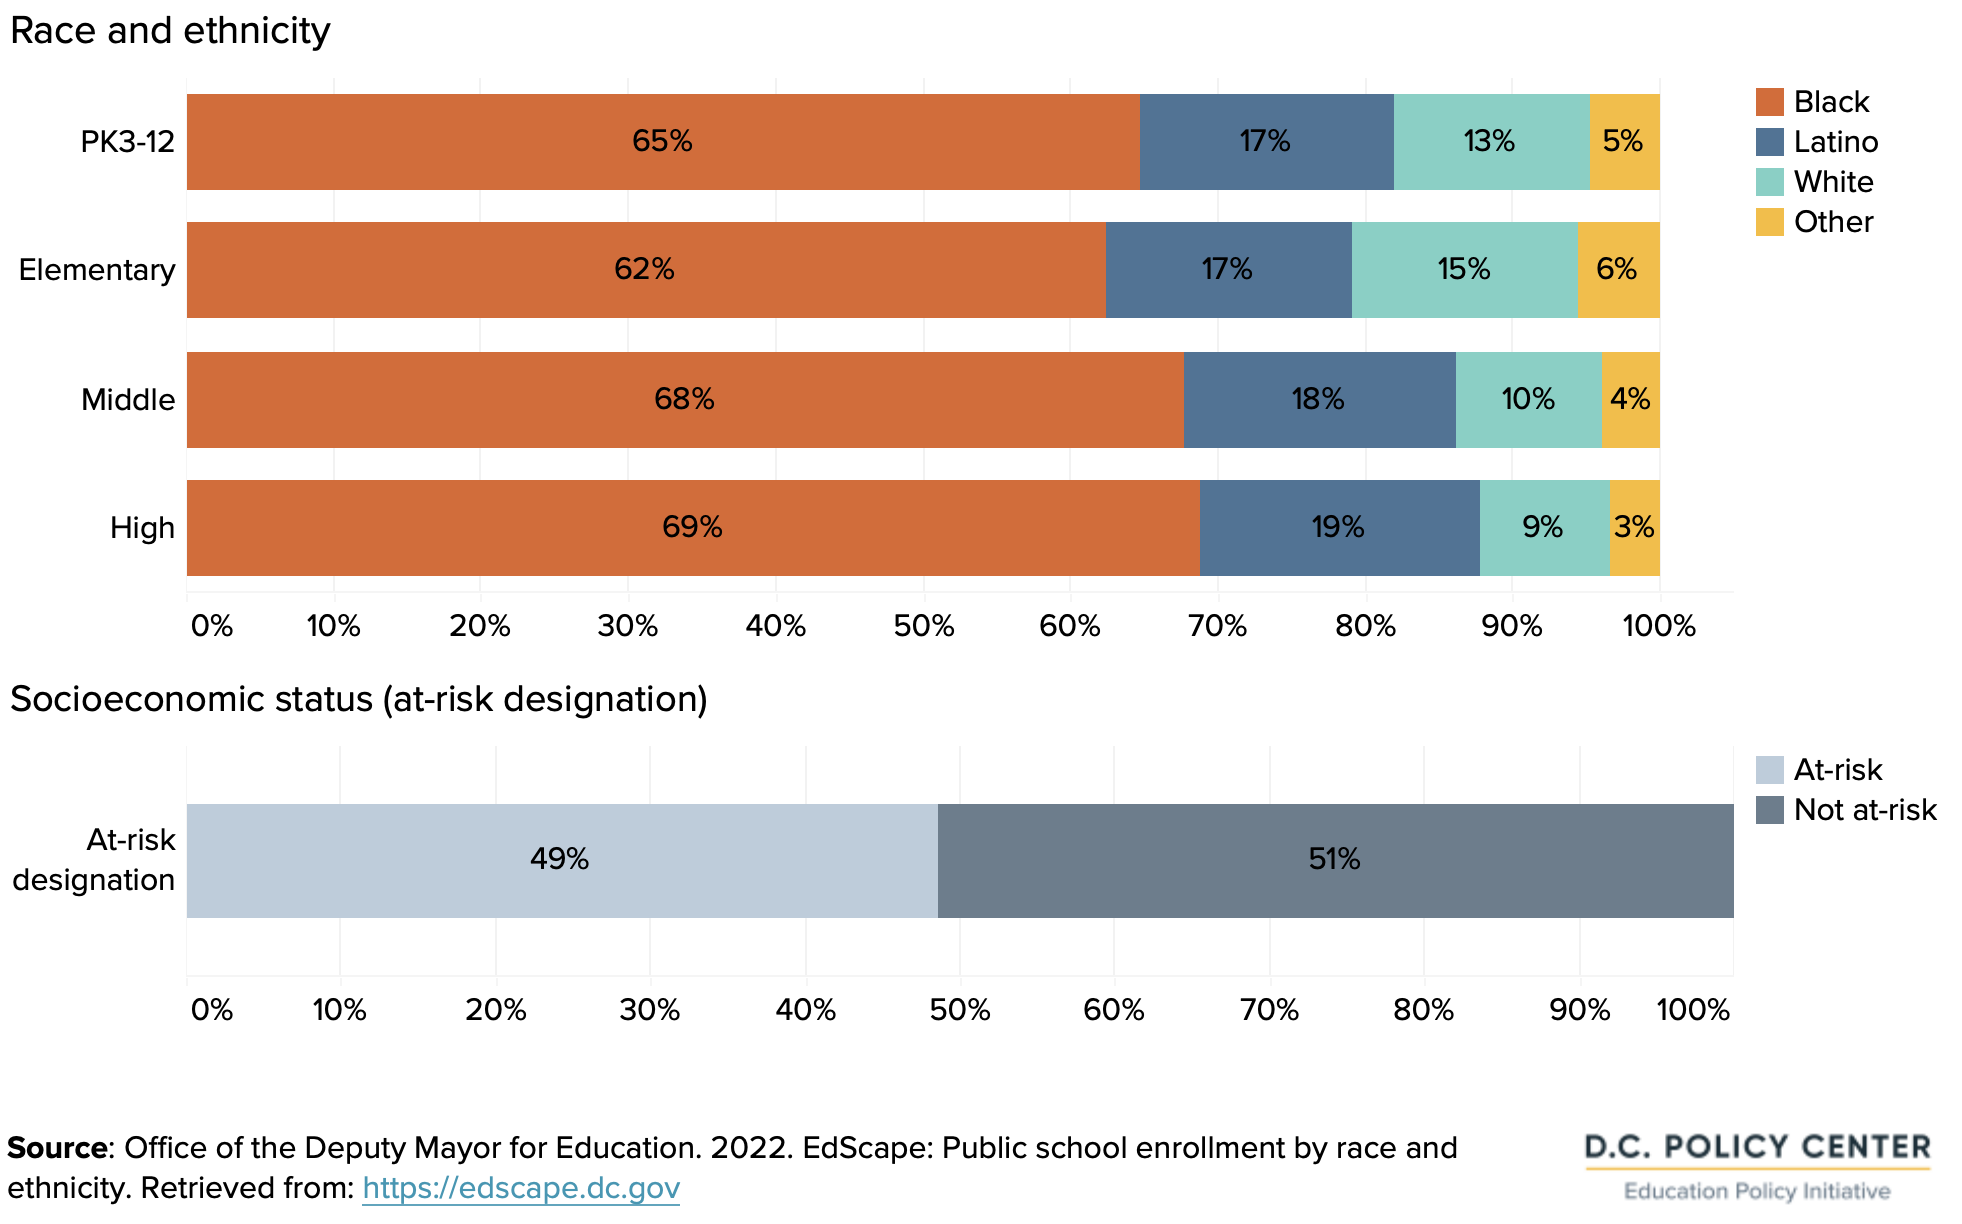
In school year 2021-22, most students in D.C.’s public schools were people of color (65 percent of students were Black and 17 percent were Latino), and 49 percent of students were designated as “at-risk” for funding purposes.14
In upper grades of middle and high school, the share of students who are Black is higher and the percentage of students who are white is lower. (Data are not publicly available for at-risk status by grade band.)
Thus, for a school to reflect the city’s demographics, it will have a majority of students who are Black and an equal balance of students who are and are not categorized as “at-risk”.
Figure 9. Student demographics in D.C.’s public schools, school year 2021-22
School-level representation shows the extent to which a school’s student body reflects the racial/ethnic or socioeconomic demographics of public school students citywide.
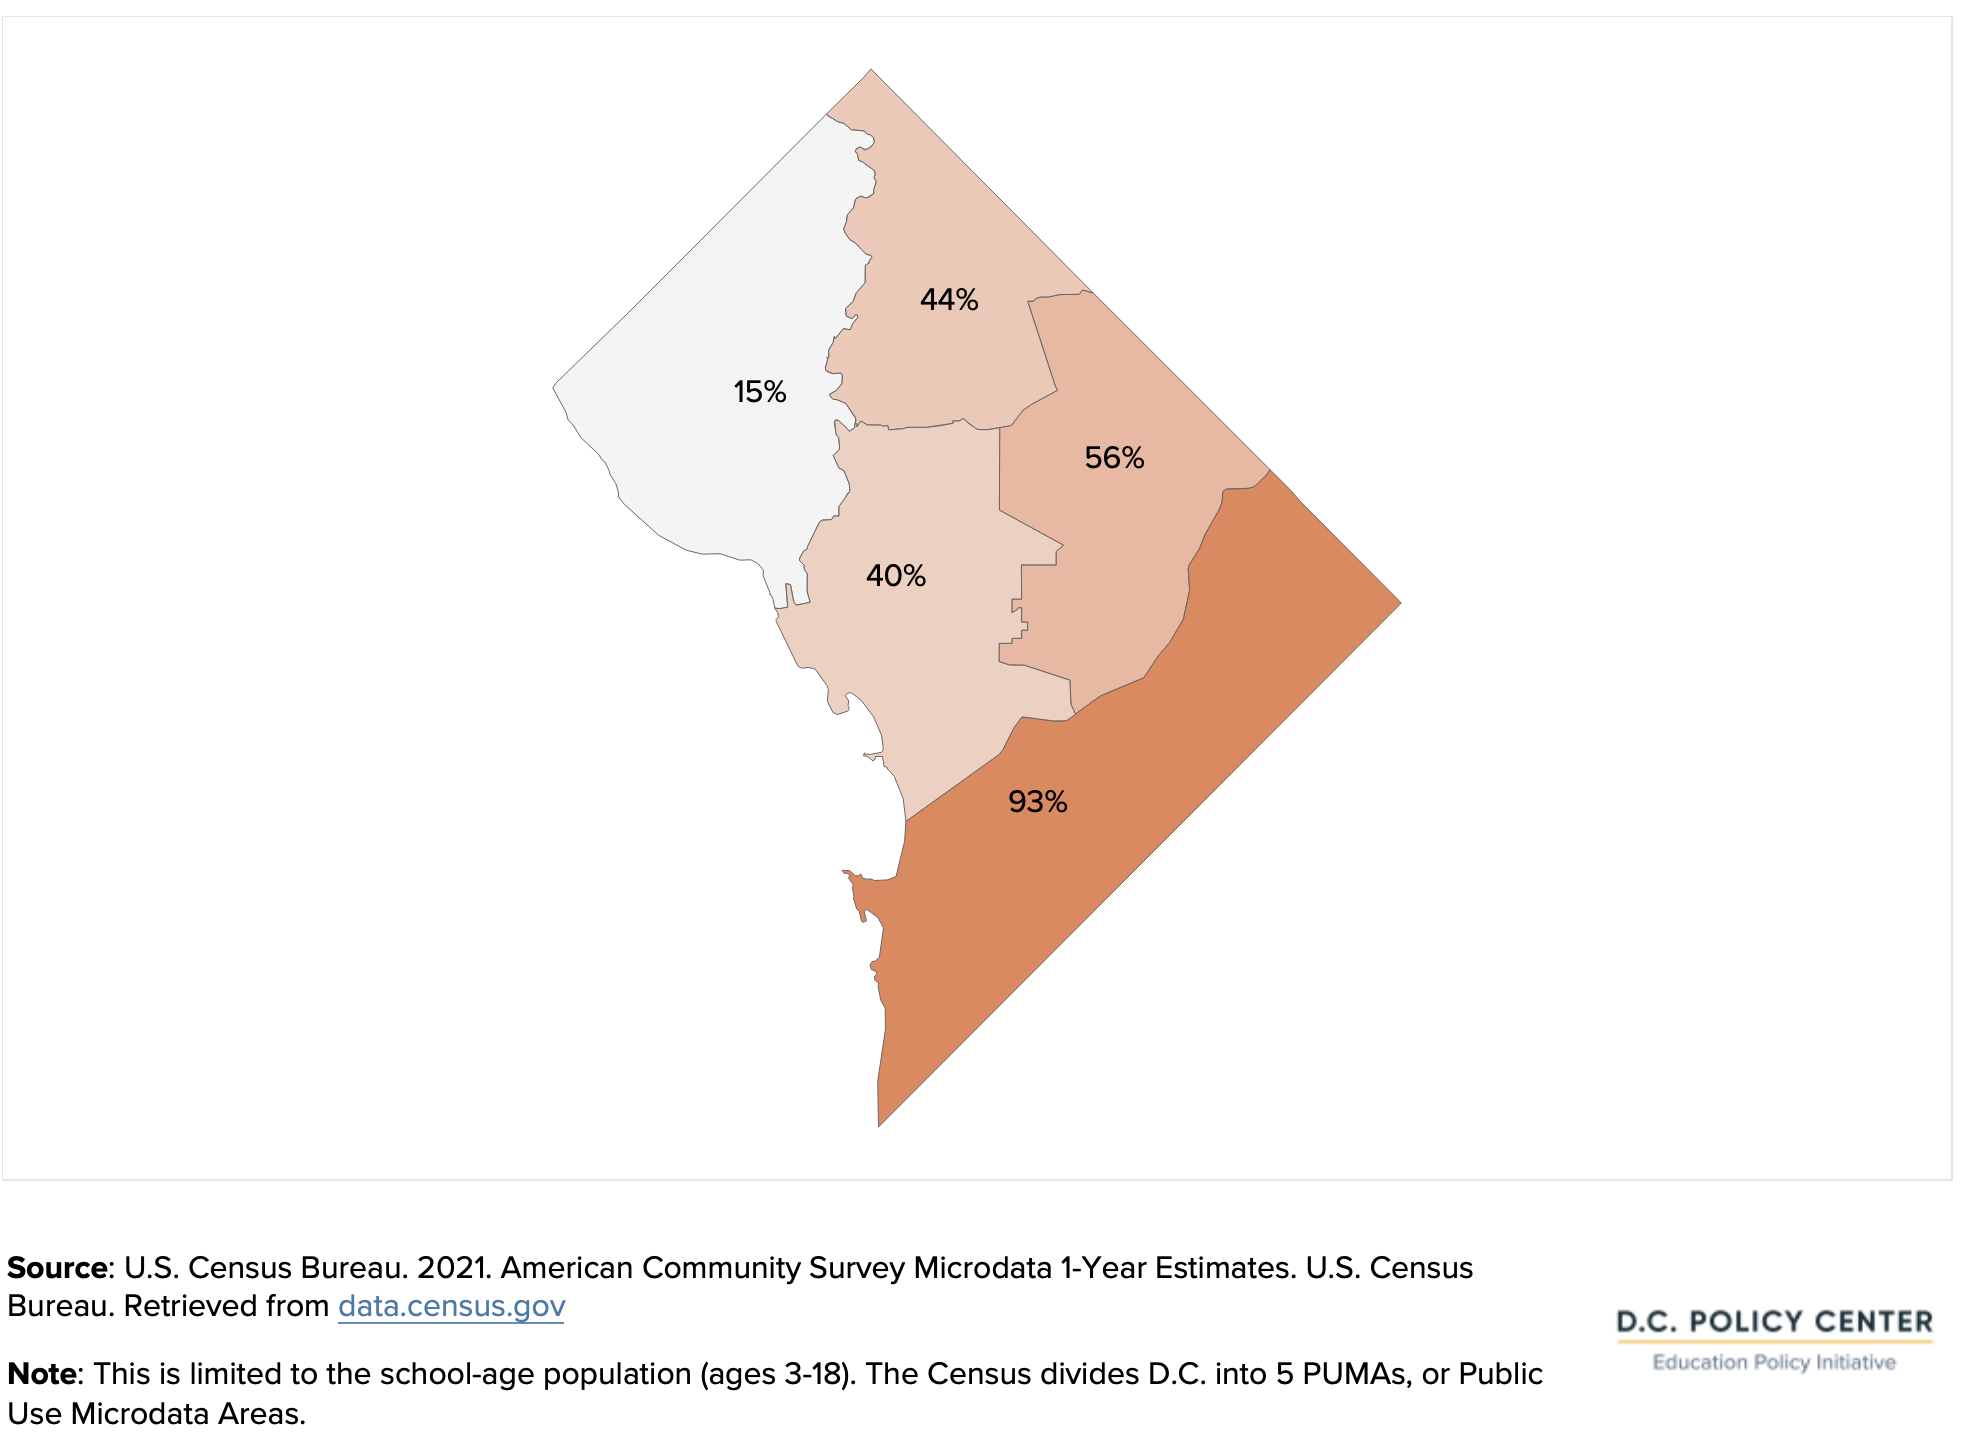
By-right schools, however, are more likely to represent the demographics of students who live within their boundary. These demographics vary greatly across the city. Data are not available by school boundary, but in the eastern part of the city that includes most of the Ballou, Anacostia, and Woodson feeder patterns, 93 percent of school-age residents are Black. In the western part of the city that includes most of the Jackson-Reed feeder pattern, 15 percent of school-age residents are Black.
Figure 10. Share of the school-age students who are Black, by PUMA, 2021
This distribution is related to a history of segregation in D.C.’s schools and neighborhoods linked racial covenants on home purchases, which excluded Black residents and other groups from certain neighborhoods. In addition, Federal Housing Administration (FHA) grades from the 1930s15 linked the racial composition of areas in D.C. to criteria for mortgage lending, institutionalizing racial segregation in the housing market.16 Racial and economic segregation is closely related to housing in D.C., with estimated housing values increasing and residents’ demographics both changing from east to west.17
Racial/ethnic, and economic segregation both have implications for representation of student groups at the school level, given that the median student in D.C. attends a school relatively close to home for school, 1.4 miles away.18 Research examining racially unequal adjacent school boundaries shows that they can, in turn, have different access school staffing, program offerings, discipline rates, among other characteristics.19
Racial and ethnic representation
This analysis compares school-level racial and ethnic representation to citywide racial and ethnic demographics, within particular grade bands.
For each school, we subtract the share of students citywide by grade band who are Black, Latino, and white from the percentage for each group at the school. In this way, schools are distributed around the citywide and grade band value for each student group. The smaller the absolute value of the difference between share of each student group across the city and share of each student group for a by-right school, the better the representation at that school. Groups are over-represented at a school where there is a positive difference, and under-represented at a school where there is a negative difference.
There are other ways of measuring segregation at schools (summarized below), but they can be complicated and oftentimes do not fit the District’s racial and ethnic characteristics. In contrast, the representation distributions constructed in the way described presents a simple, and easily understood visual of over- or under-representation in each by-right school.
Measuring student representation
There are several ways to measure segregation in schools. The substantial presence of three racial and ethnic student groups in D.C. means that our measure cannot focus only on one majority and one minority group. We considered a few established methods to measure racial and ethnic representation, but none met our needs. These include:
- An exposure index measures the extent to which students from one race are around students from another race. This metric is not appropriate for D.C., because it works best with only two race and ethnicity groups and would ignore one of D.C.’s primary student groups.
- An isolation index measures how much a single race is clustered in one school. This measure would highlight only one group and instead gives an idea of which schools are the least diverse, and not which schools are most representative.
- Dissimilarity and divergence indices show how well the racial composition of a school relates to the neighborhood, but neighborhood-level data are not available from this most recent Census.
- Lastly, the Theil index, used to measure inequality by calculating the distance from an “ideal” distribution, can compare multiple groups, but is both complicated and difficult to interpret.
Finding #5
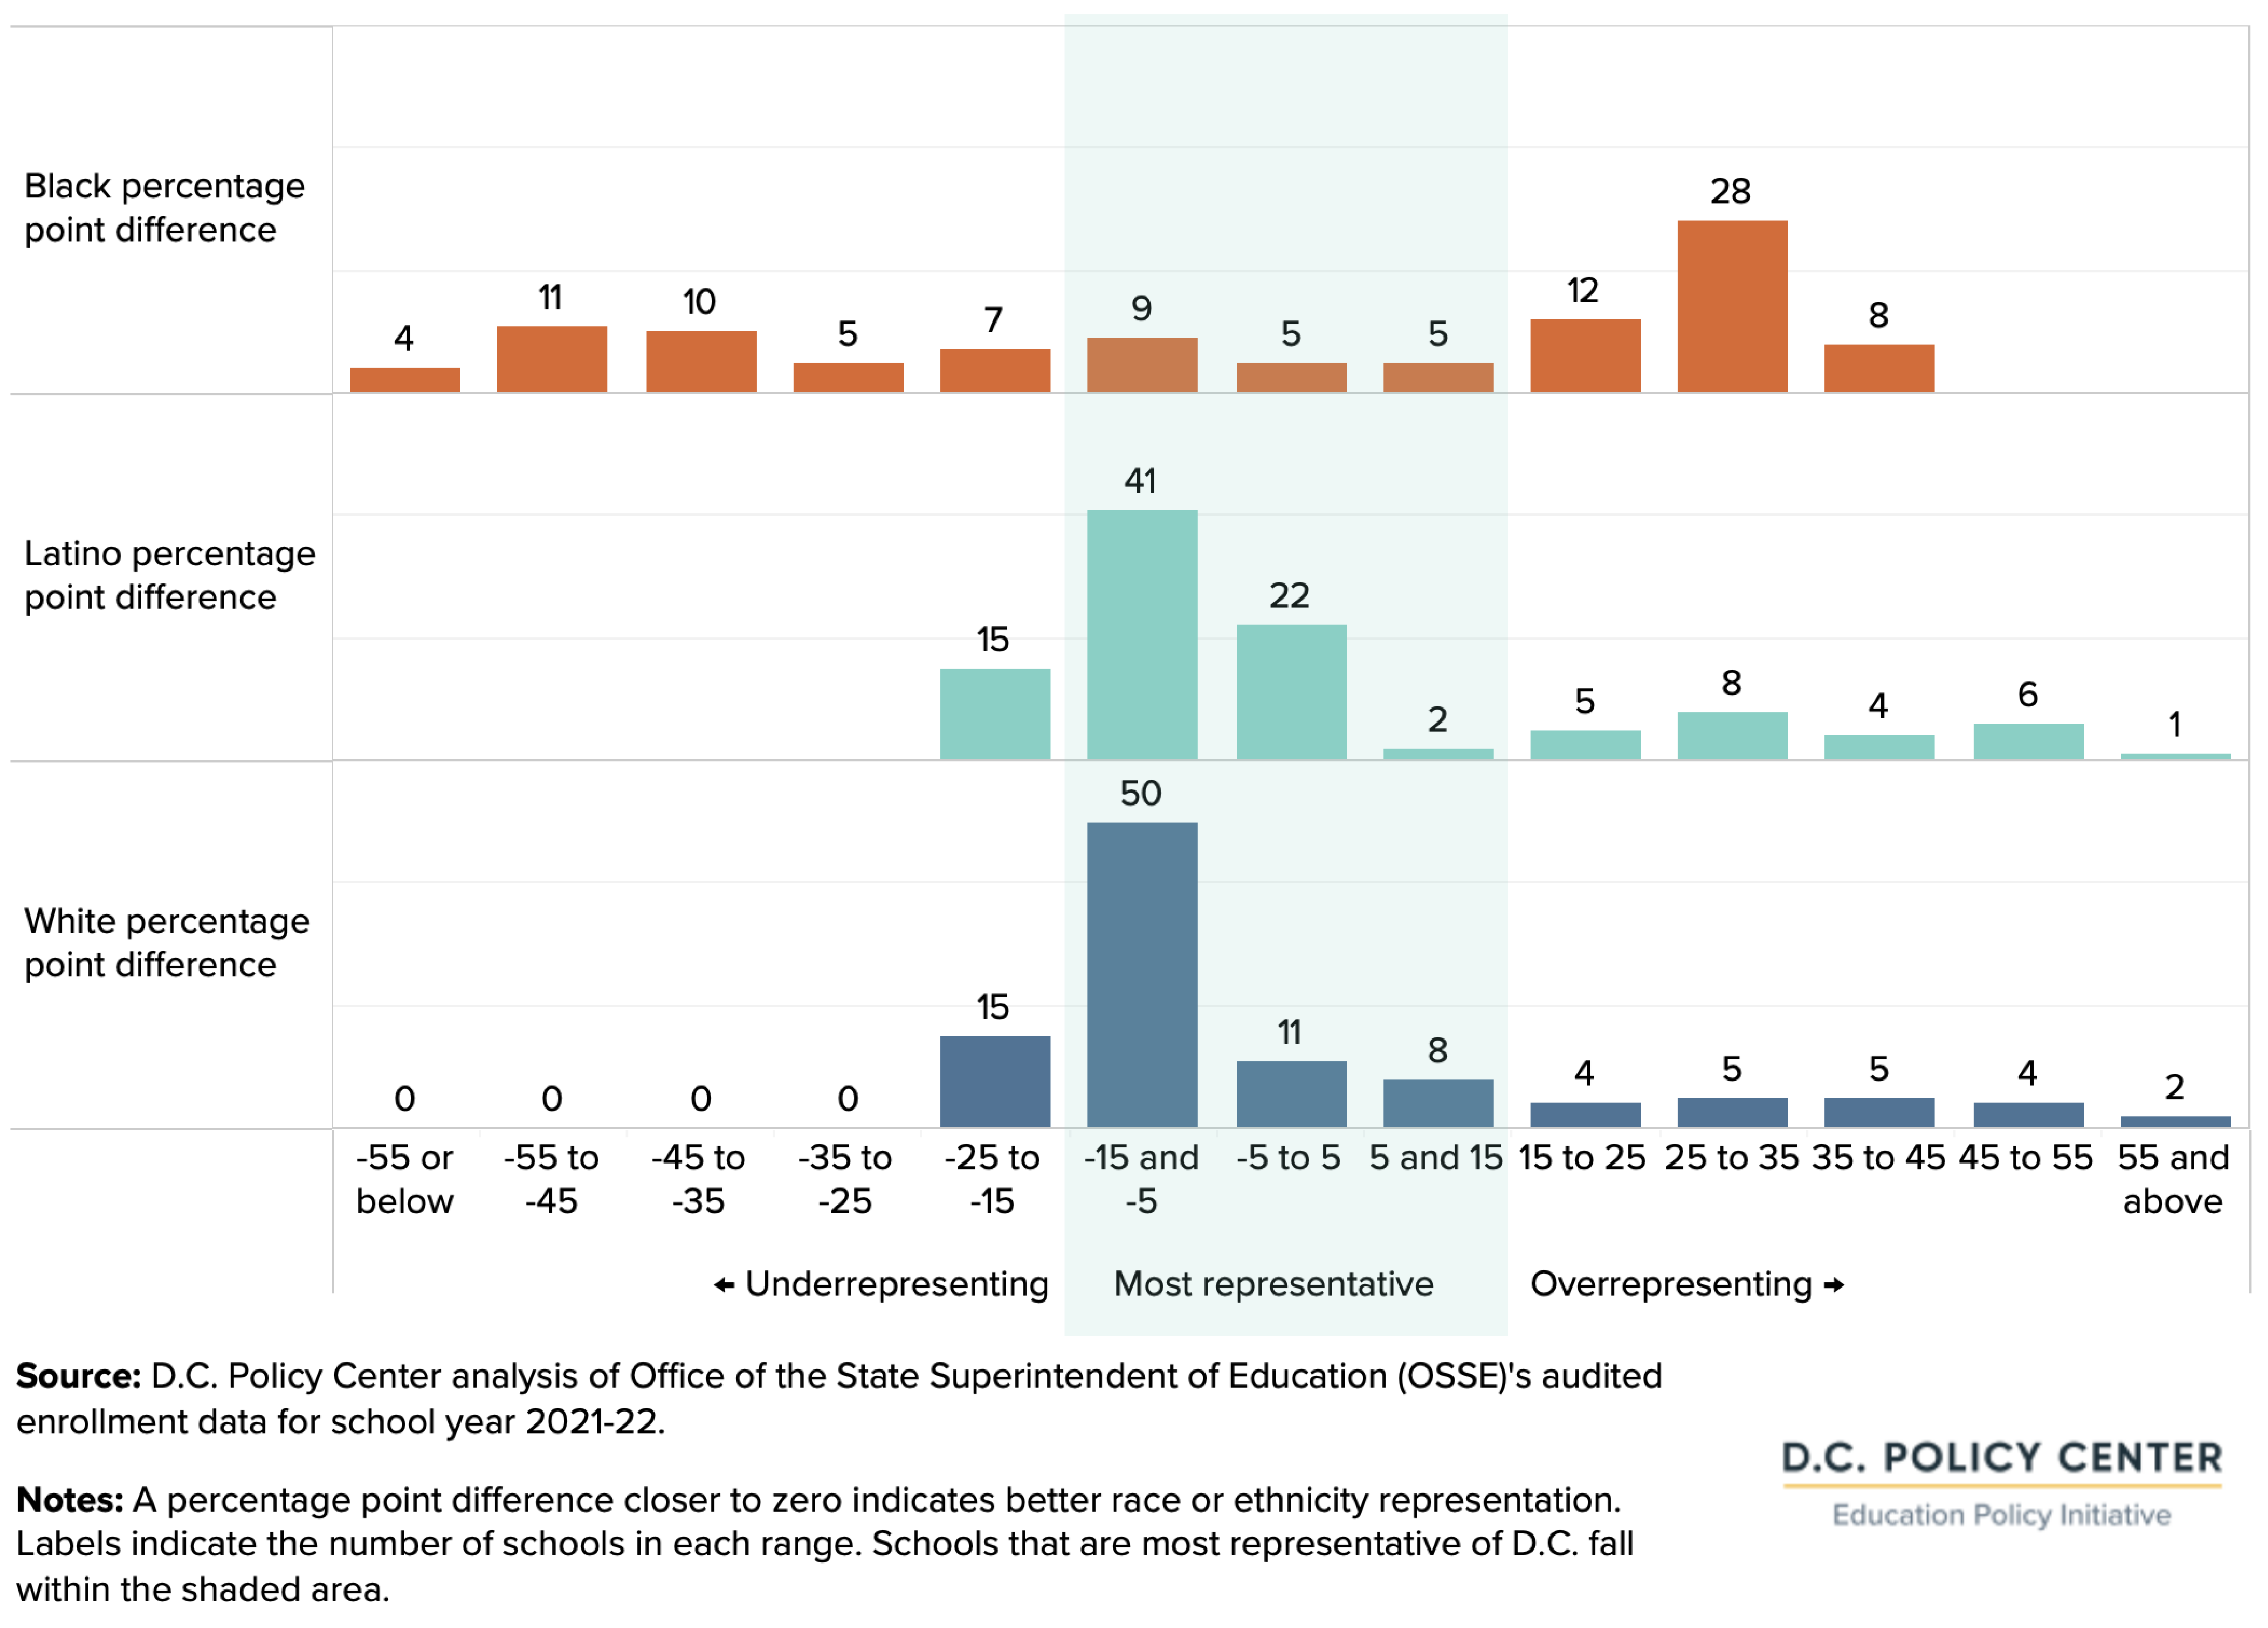
In general, by-right schools are not racially and ethnically representative of students across the city. This is, in part, because of neighborhood demographics: At 53 of D.C.’s 104 by-right schools, the share of Black students is at least five percentage points higher than the city average for the grade band.
There are just five by-right schools at which Black students are represented close to (within five percentage points of) the overall citywide average. Black students are likely to be over-represented at by-right schools: at 53 out of 104 schools, the share of Black students in the student body is at least five percentage points higher than the city average for that grade band (compared to 28 schools for white students, for example).
Latino and white students are more likely to be within five percentage points of the citywide average (22 schools and 11 schools, respectively) or under-represented. These patterns are due in part to a third of by-right schools having a student population that is at least 90 percent Black.
Figure 11. Difference in the share of student groups between by-right schools and the city average, 2021-22, by race and ethnicity
Finding #6
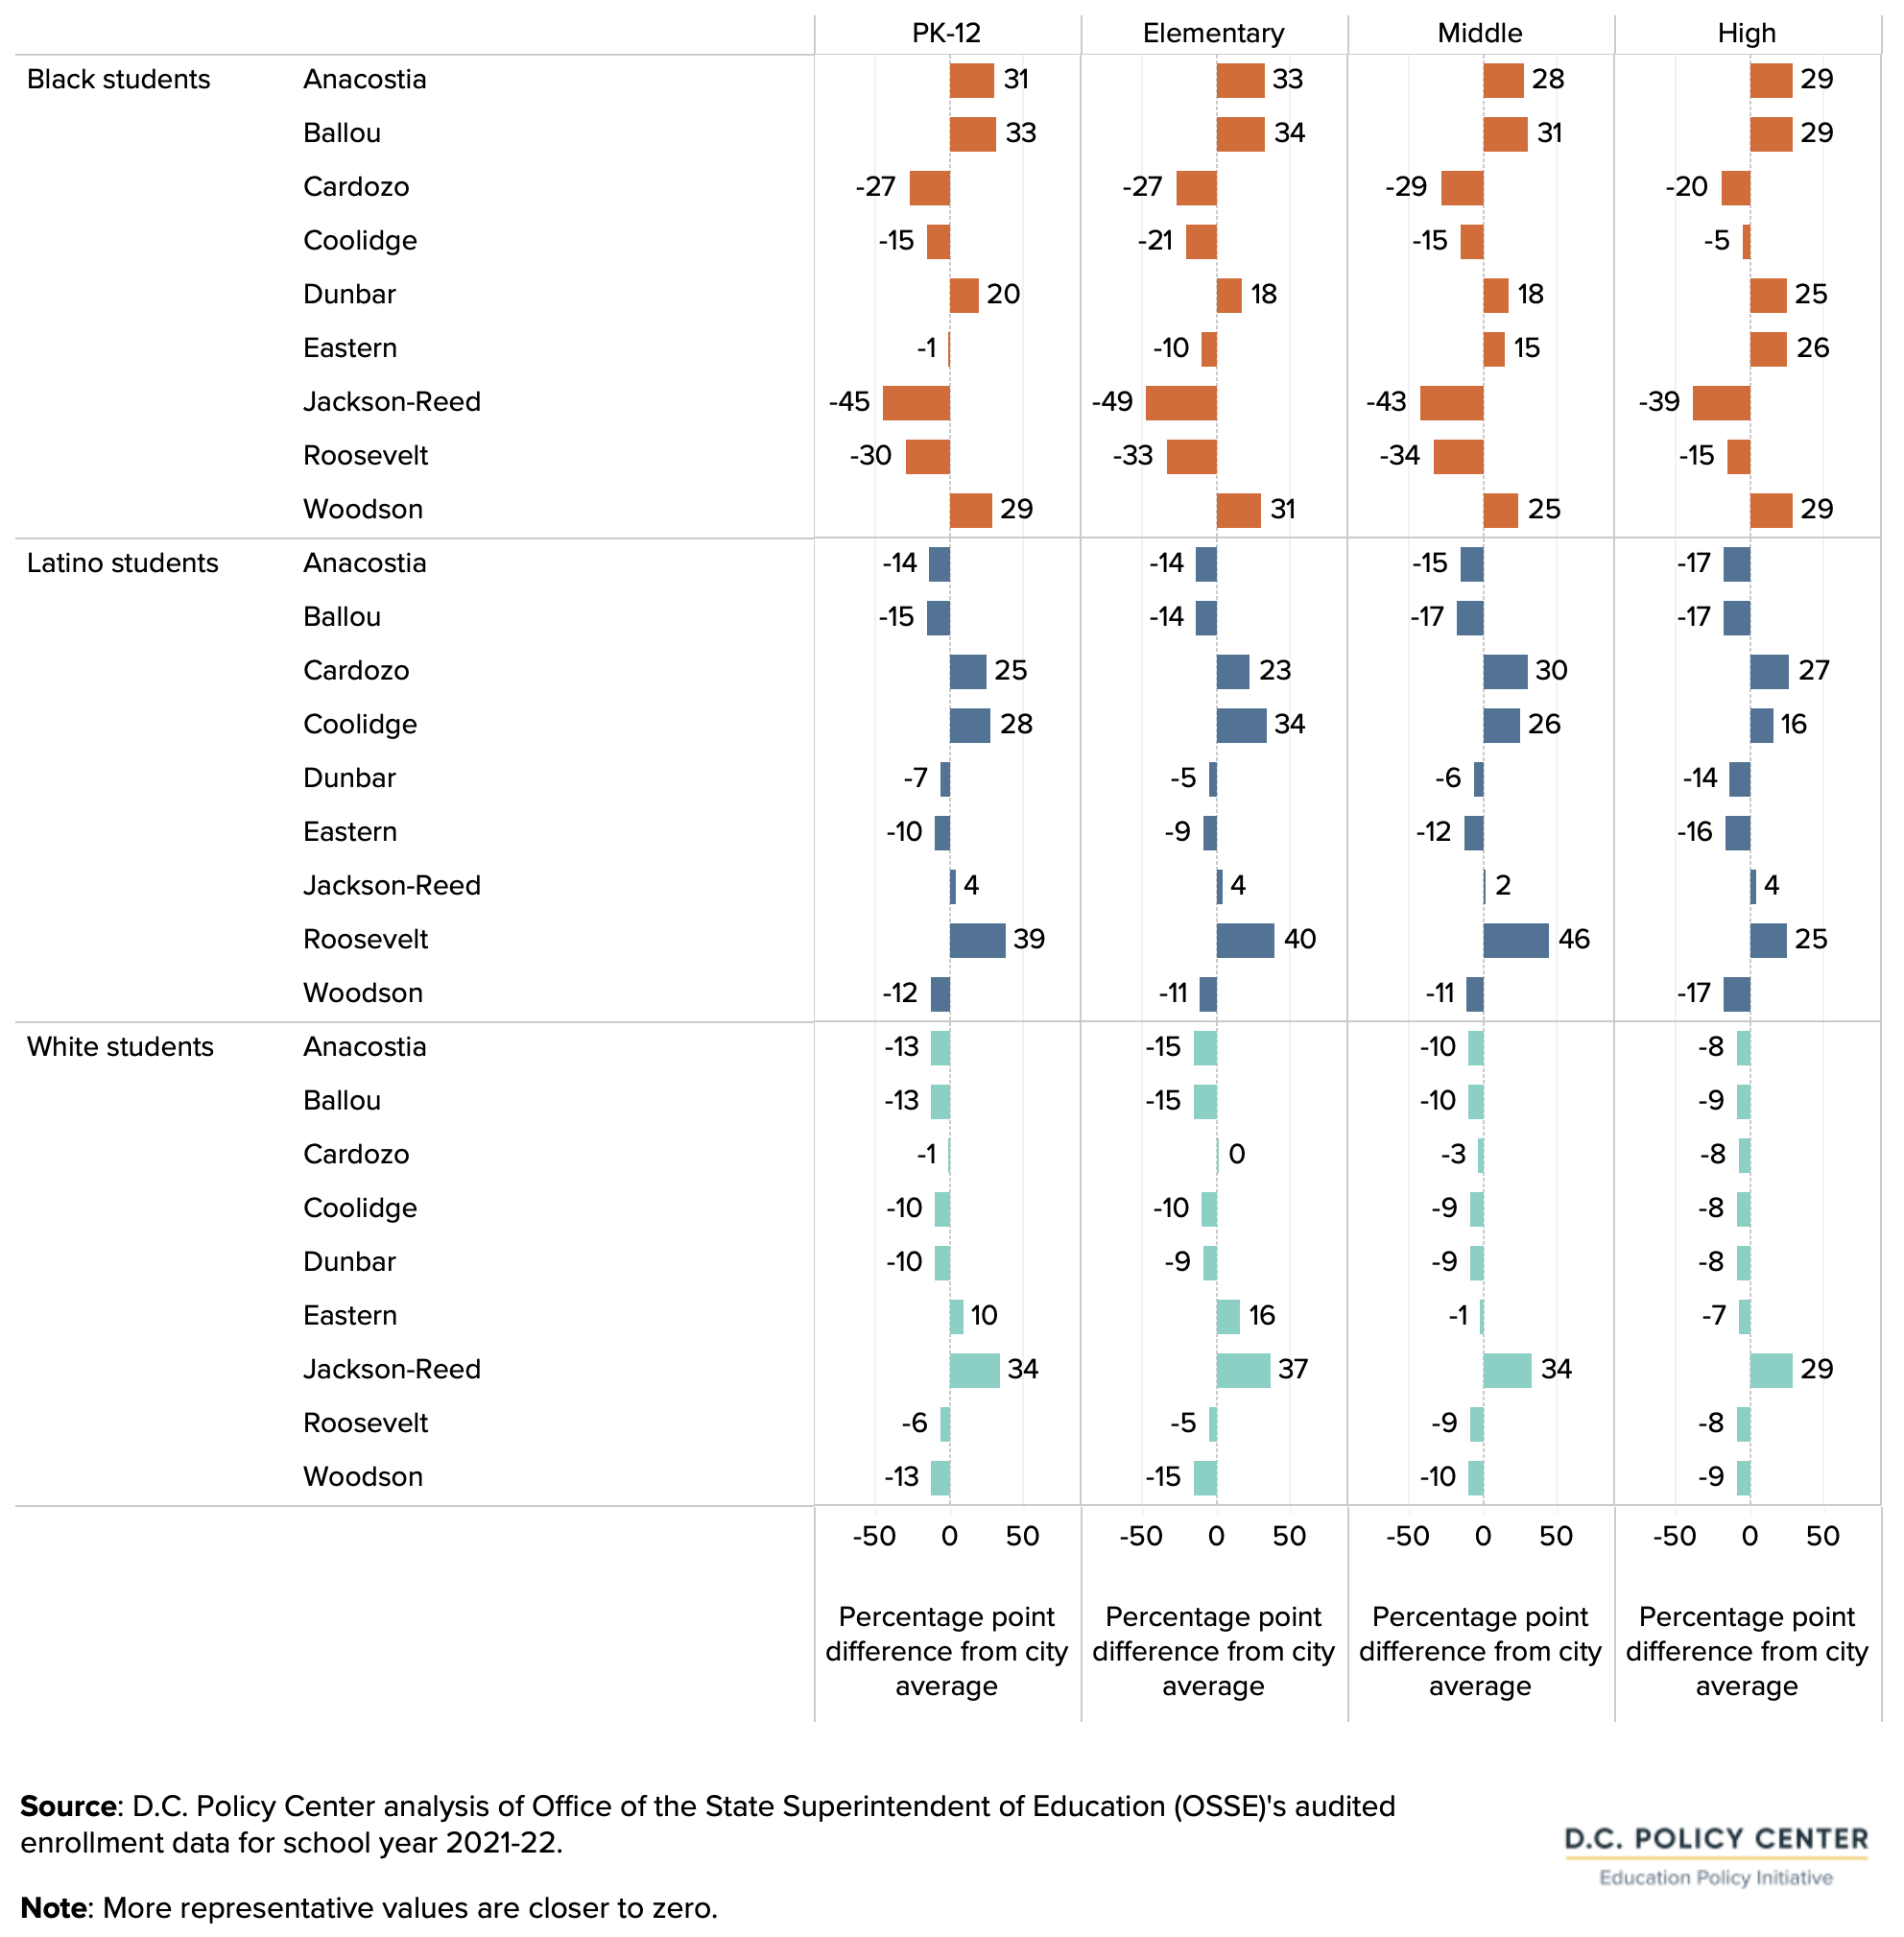
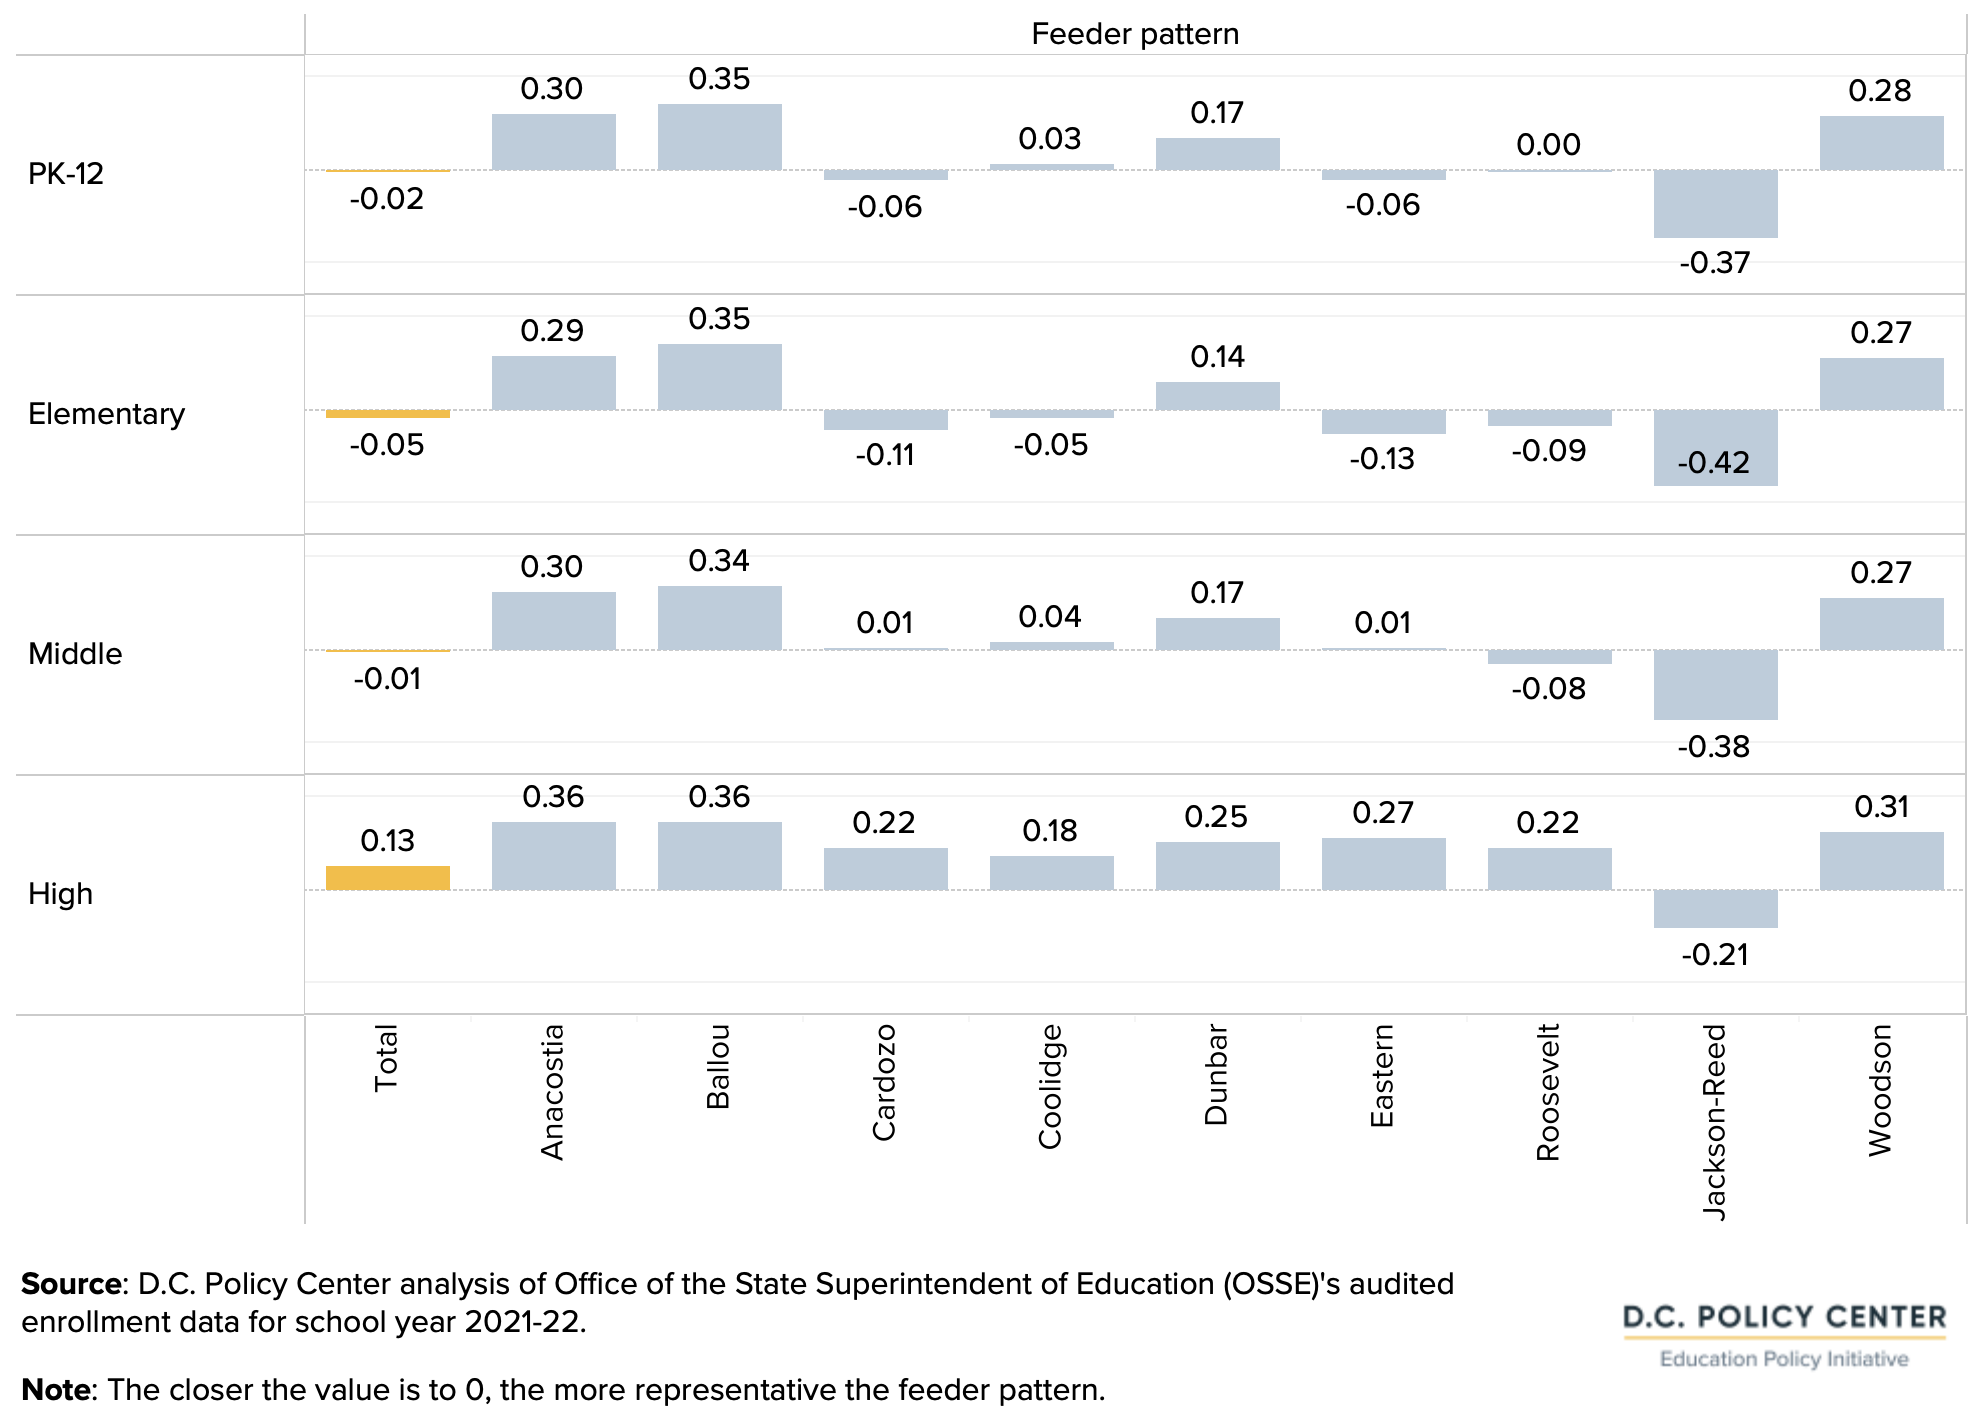
At the feeder pattern with the highest boundary participation, Black students are under-represented and white students are over-represented: Jackson-Reed is unique in this discrepancy.
Overall, by feeder pattern, the Eastern feeder pattern is the most representative for race and ethnicity, with student groups the closest to the city average. Jackson-Reed is the least representative, with values that are farther away from the city average, especially for Black students and white students.
Figure 12. Representation of student groups at D.C.’s schools of right, by feeder pattern and grade band, compared to the city average, 2021-22
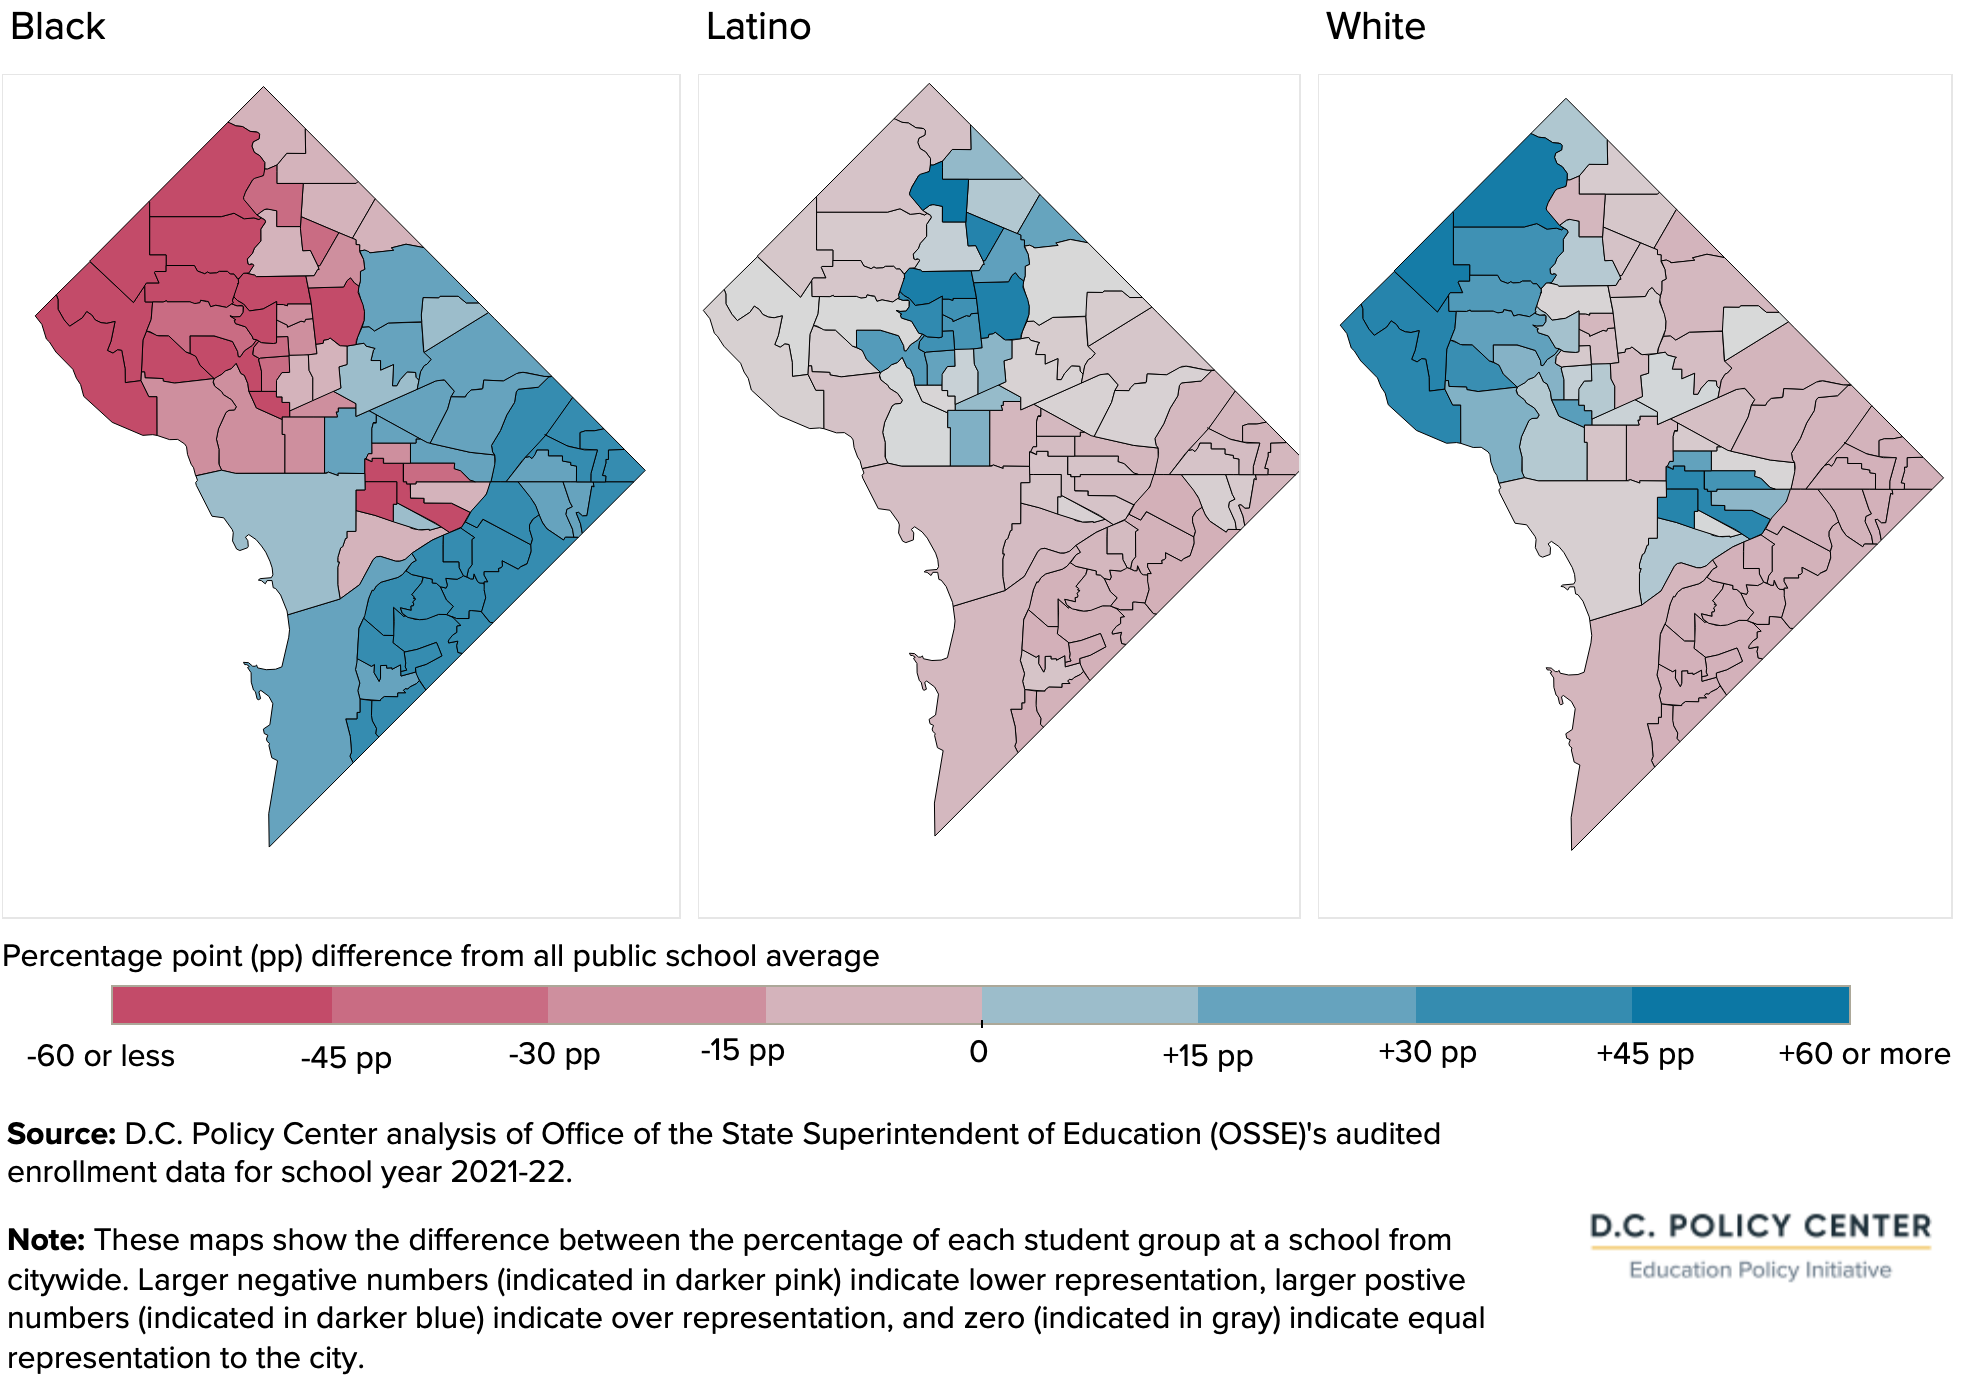
Mapping this same analysis at the grade-band level reveals that Black students are much more segregated than Latino and white students of all ages.
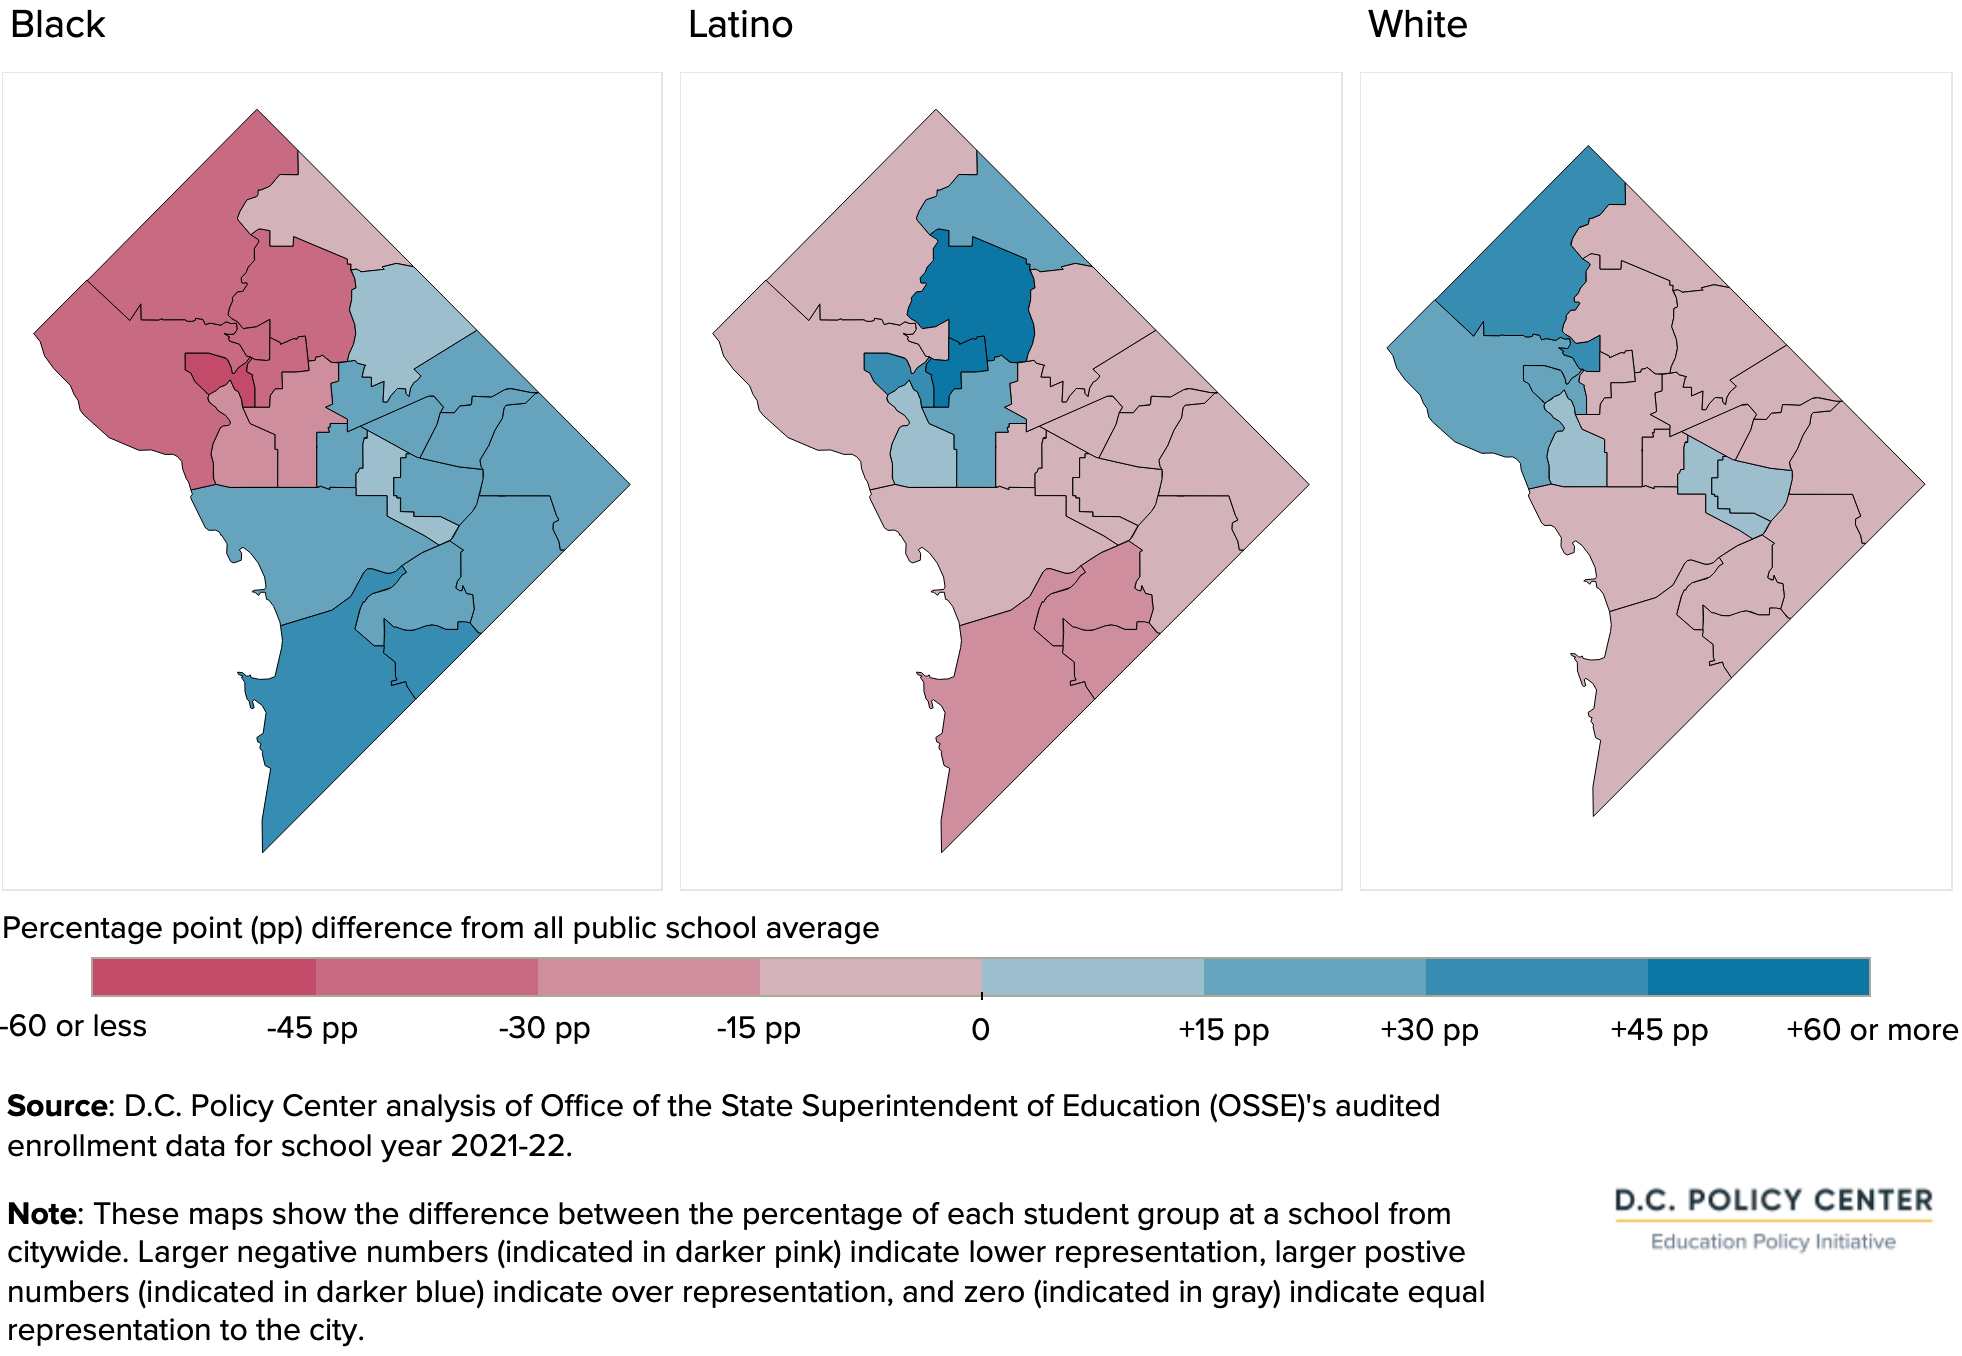
Elementary school racial and ethnic representation
Across the 74 by-right elementary schools, the share of Black students is close to (within five percentage points of) the city average at only four schools. Black students are under-represented at 35 elementary schools, mostly in Northwest and Capitol Hill, and over-represented at 35 other elementary schools in Northeast, east of the Anacostia River, and Southwest.
Importantly, there are many schools where Black students are significantly over-represented and there are likewise many schools where they are significantly underrepresented (by plus or minus 45 percentage points).
White students tend to be over-represented at the elementary schools where Black students are under-represented. Only 12 elementary school closely represented (within five percentage points) the citywide share of white students.
Latino students are over-represented at elementary schools in the northern center corridor of the city and under-represented elsewhere.
Importantly, when Latino and white students are under-represented, their representation tends to be within 15 percentage points of the city average, but when they are over-represented, this percentage of students who are Latino or white can be higher than 60 percentage points compared to the city average. These outcomes are largely driven by neighborhood demographic characteristics but could be amplified by out-of-boundary participation patterns and private school enrollment.
Figure 13. Racial and ethnic representation at DCPS by-right elementary schools, school year 2021-22
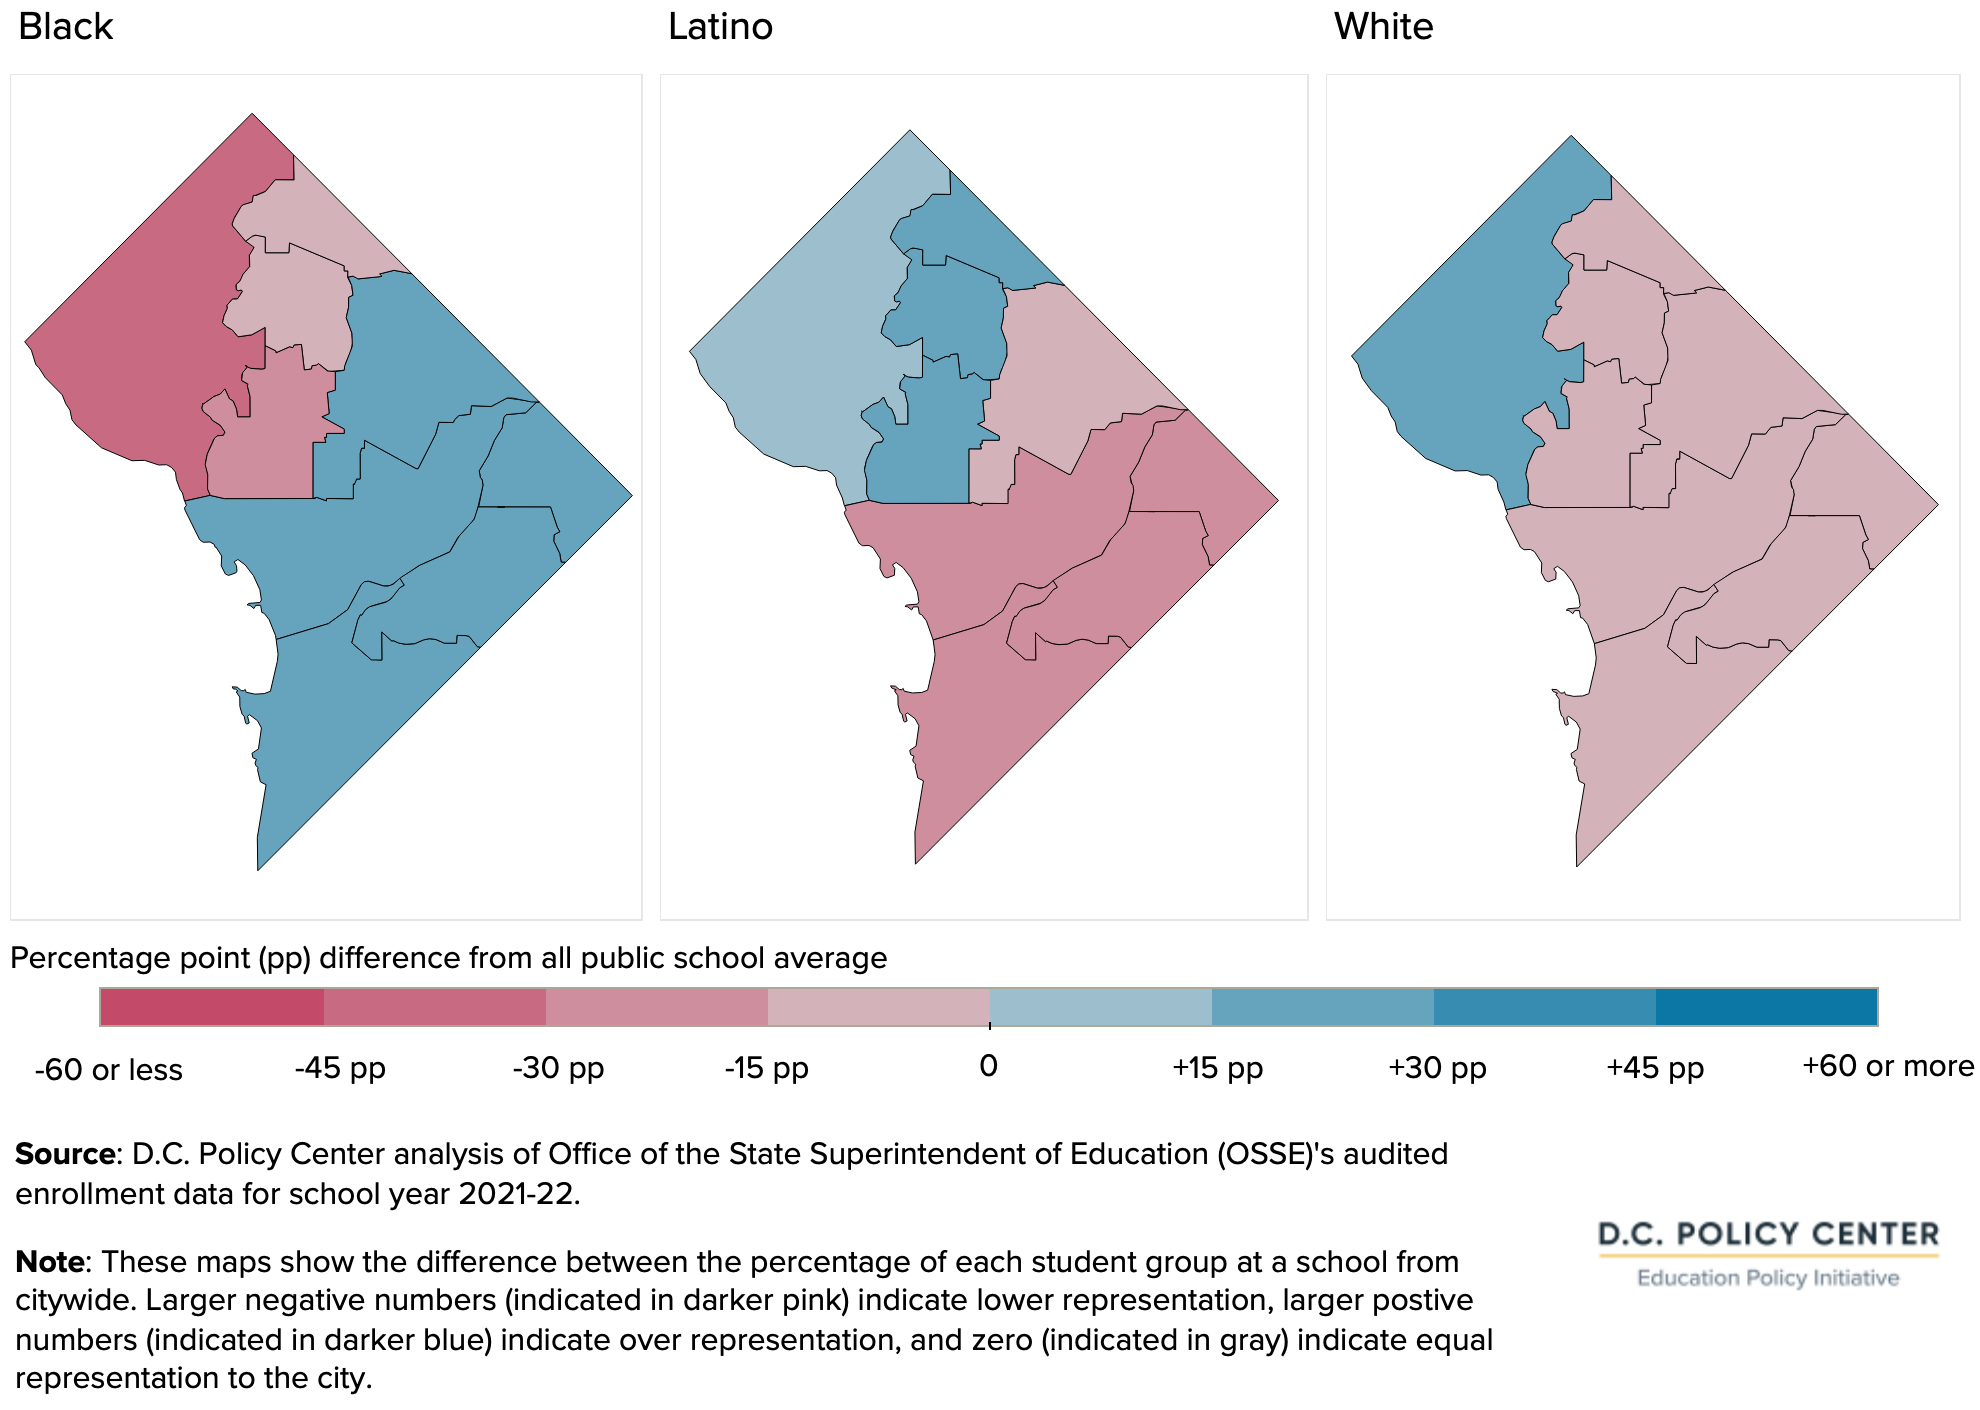
Middle school racial and ethnic representation
These patterns hold and become even sharper for by-right middle schools. No by-right middle school closely represents the citywide average for Black students. At most by-right middle schools (13 out of 21), Black students are over-represented – but they are more drastically under-represented at the remaining by-right middle schools by up to 64 percentage points. Latino and white students tend to be over-represented at by-right middle schools where Black students are under-represented, especially in areas of Northwest.
Figure 14. Racial and ethnic representation at DCPS by-right middle schools, school year 2021-22
High school racial and ethnic representation
For by-right high schools, only two closely represent any race or ethnicity. Black students are under-represented in Northwest aside from Coolidge High School, and over-represented elsewhere. Latino students are the mirror image. White students are under-represented at all schools aside from Jackson-Reed High School.
Figure 15. Racial and ethnic representation at DCPS by-right high schools, school year 2021-22
Socioeconomic representation
Similar to racial and ethnic representation, socioeconomic representation shows how closely students who are designated as at-risk are distributed across schools compared to the city average. In this case, 49 percent of public school students are designated as at-risk, so schools would be closest to the city average if their students are split almost evenly between those designated as at-risk and those who are not.
As for racial and ethnic representation, for each school, the citywide average of students who are designated as at-risk is subtracted from the school’s percentage. And again, an absolute value closer to zero means better socioeconomic representation, while a positive value indicates over-representation and a negative value indicates under-representation.
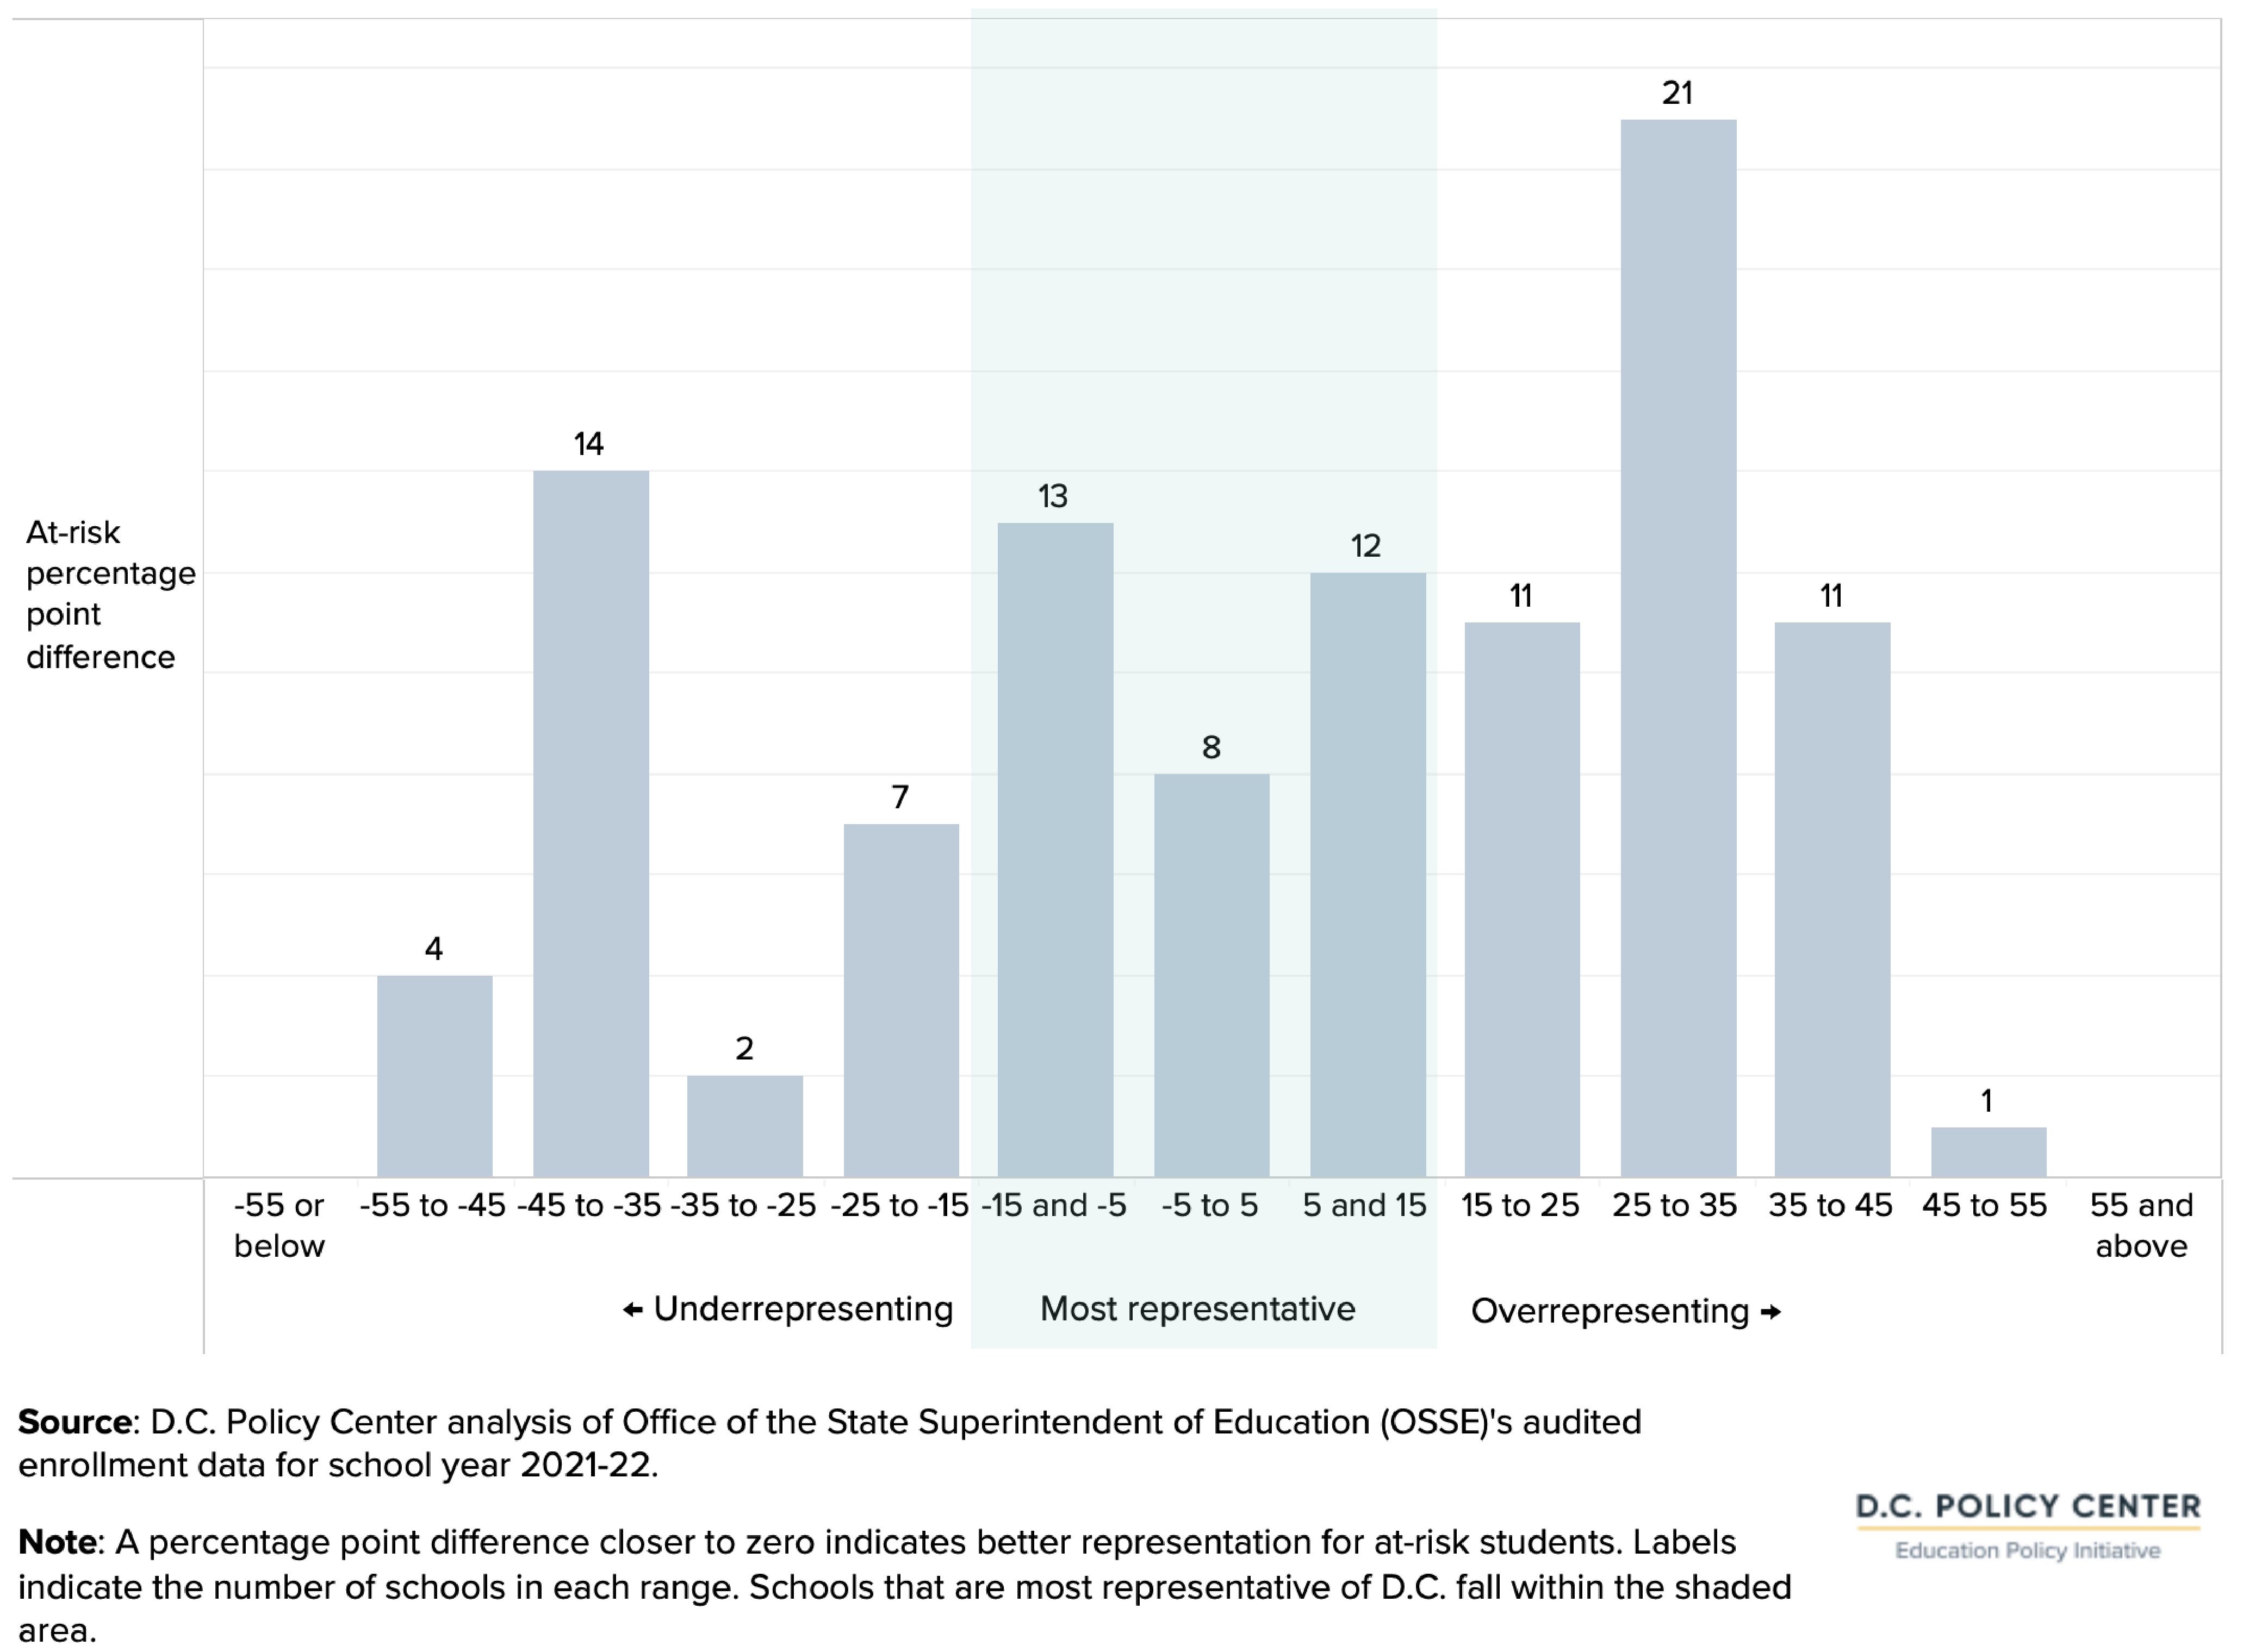
Finding #7
By-right schools in D.C. are more representative socioeconomically than racially and ethnically: One out of every three schools within 15 percentage points of the city average for at-risk students compared to one out of every five schools within 15 percentage points of the city average for Black students.
Eight schools are within five percentage points of the city average for share of the student body designed as at-risk. At-risk students are more often over-represented (at 56 schools) than under-represented (at 40 schools).
The distribution is more even for students designated as at-risk than it is for Black students, with one out of every three schools being within 15 percentage points of the city average for at-risk students, compared to one of every five schools within 15 percentage points of the city average for Black students.
Figure 16. Representation of socioeconomic groups at D.C.’s by-right schools, compared to city average, 2021-22
Geographically, there is more socioeconomic representation in the center of the city, with more schools in this area being close to (within 15 percentage points of) the city average. Practically speaking, this means that there is little socioeconomic representation at schools within the Jackson-Reed, Ballou, Anacostia, and Woodson feeder patterns. The Coolidge feeder pattern has the most socioeconomic representation.
Figure 17. Socioeconomic diversity at by-right DCPS schools, 2021-22
Percentage point difference between the share of at-risk students in a by-right school and the citywide average
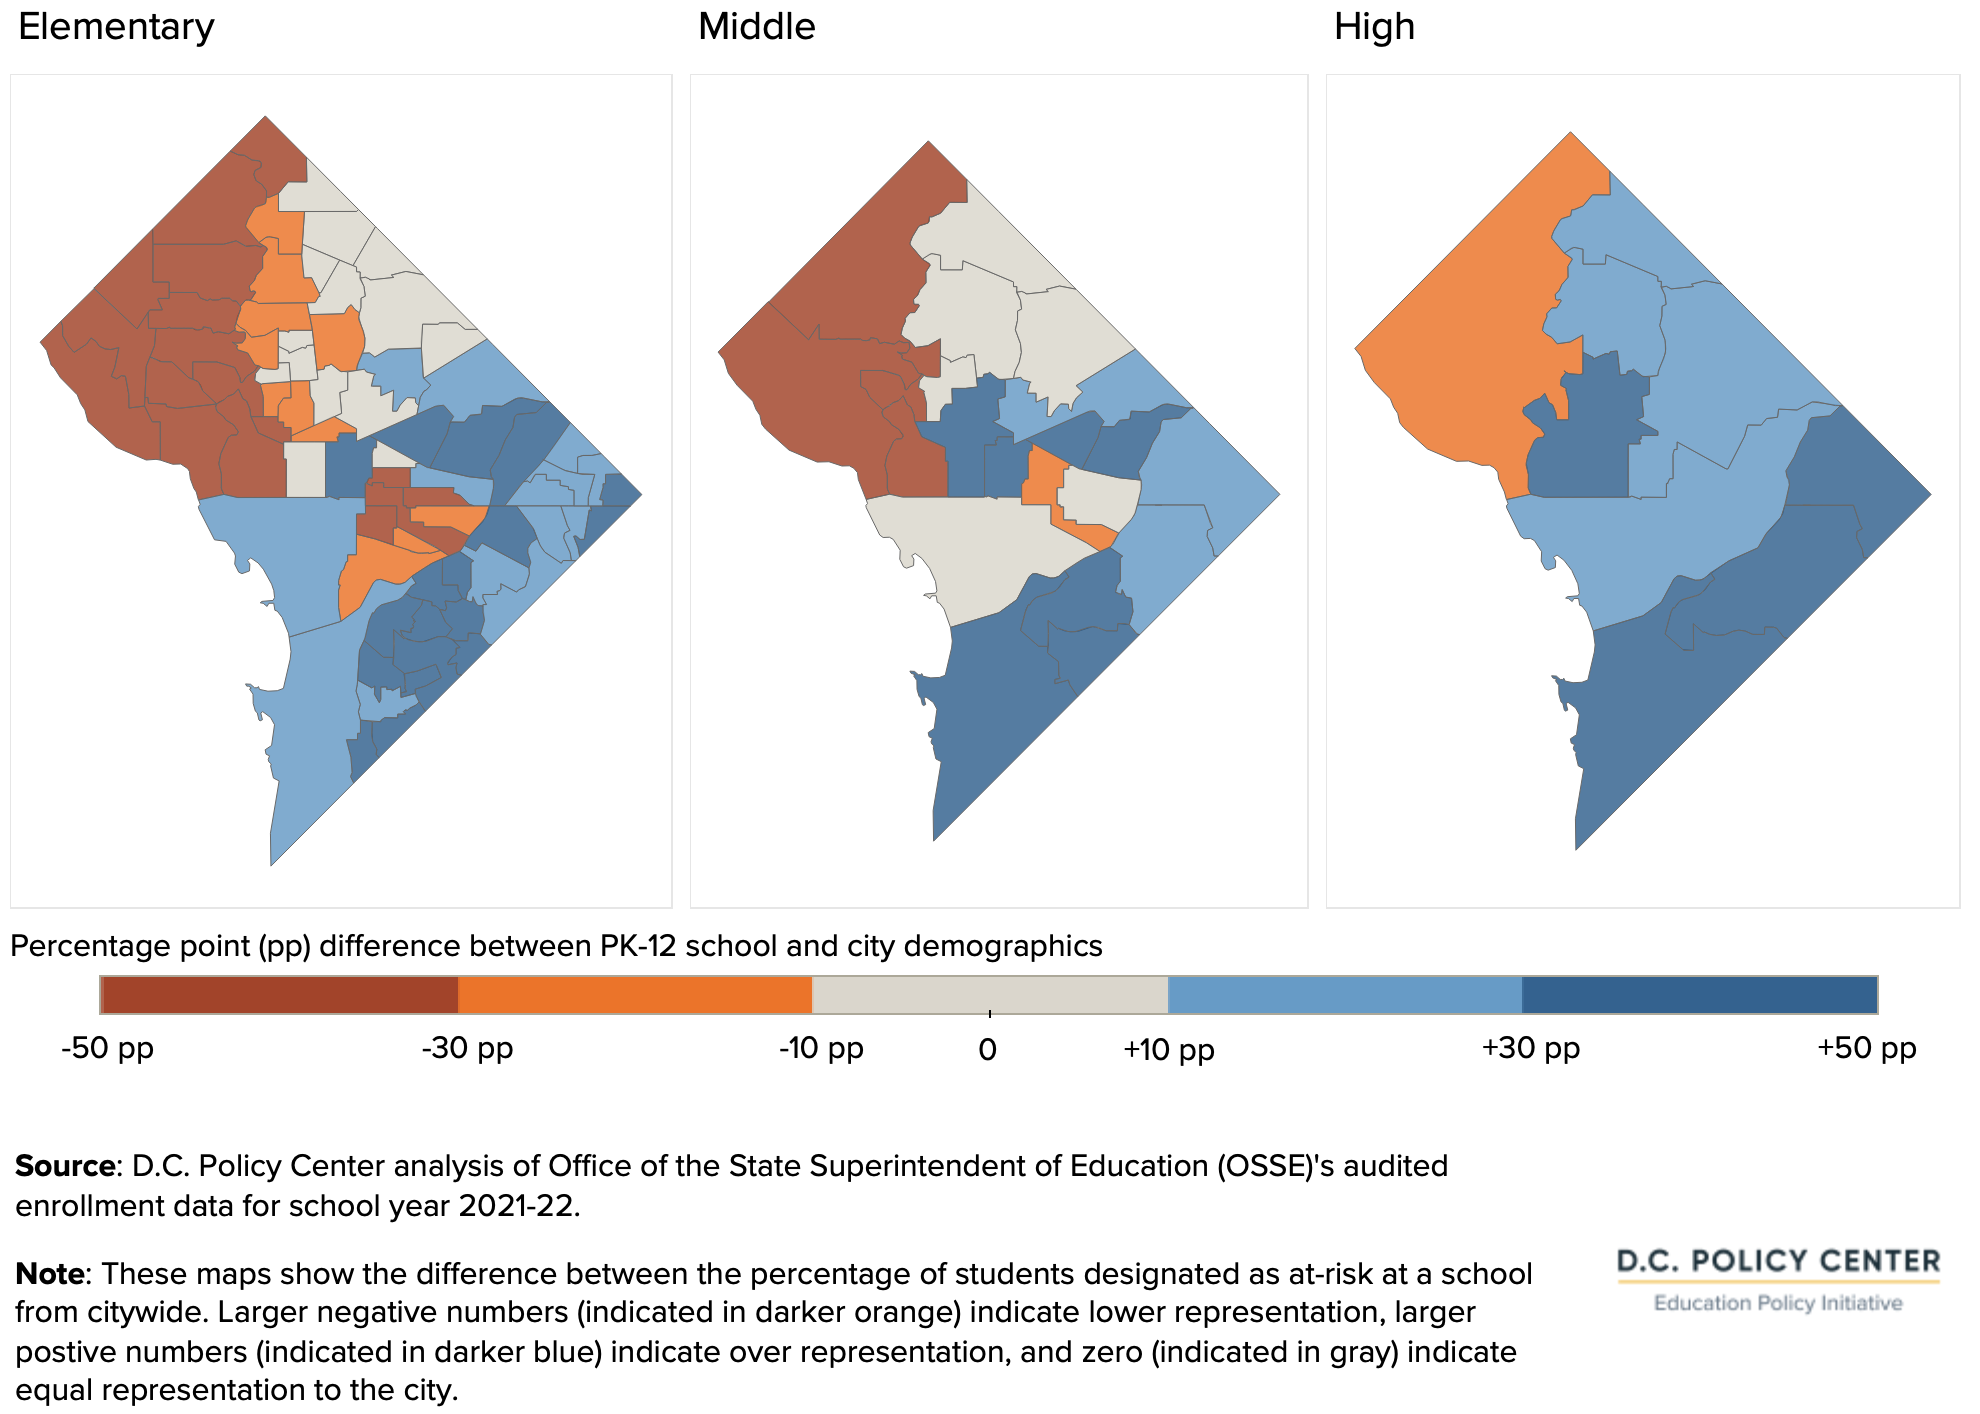
The Cardozo, Coolidge, Eastern, and Roosevelt feeder patterns are the most socioeconomically representative of the citywide student population. Within each of those feeder patterns, the share of the student body designated as at-risk is within five percentage points of the citywide average. Jackson-Reed is the least representative feeder pattern, with students who are designated as at-risk under-represented by 37 percentage points.
In general, feeder patterns become less socioeconomically representative as students grow older, in part because high school students become eligible for a new category of “overage” within the at-risk designation. (The specific share of students who are at-risk by grade band is not publicly available. It has not been calculated for this report because it is difficult to assign students at some schools to a particular grade band.)
Figure 18. Socioeconomic representation of students designated as at-risk in D.C.,
Percentage point difference from citywide average, by grade band and feeder pattern, school year 2021-22
This analysis shows that there is less racial and ethnic representation than socioeconomic representation. There is also more variation by feeder pattern for race and ethnicity than for socioeconomic representation.
6. Facility utilization
At DCPS by-right schools, students in kindergarten through grade 12 may directly enroll without matching in the common lottery if they live within the school’s boundary area, regardless of the facility’s capacity.
Given varying boundary participation across the city, the distribution of the school-age population, and different building characteristics, some facilities serve more students than intended, while others are below capacity.
Facility utilization does not necessarily follow the same pattern as boundary participation, which means that solutions that shift access to certain in-demand schools will be different from those to improve facility utilization. The DME will examine facility utilization along with enrollment projections and other factors as they develop the 2023 Master Facilities Plan.
In school year 2021-22, the 104 by-right schools were located at 98 facilities, which expands to 105 facilities for this analysis when education campuses are considered separately in each grade band. Some by-right schools are co-located with other by-right schools:
- 6 Education Campuses have one elementary school and one middle school on site,
- 1 Education Campus has one middle school and one high school.
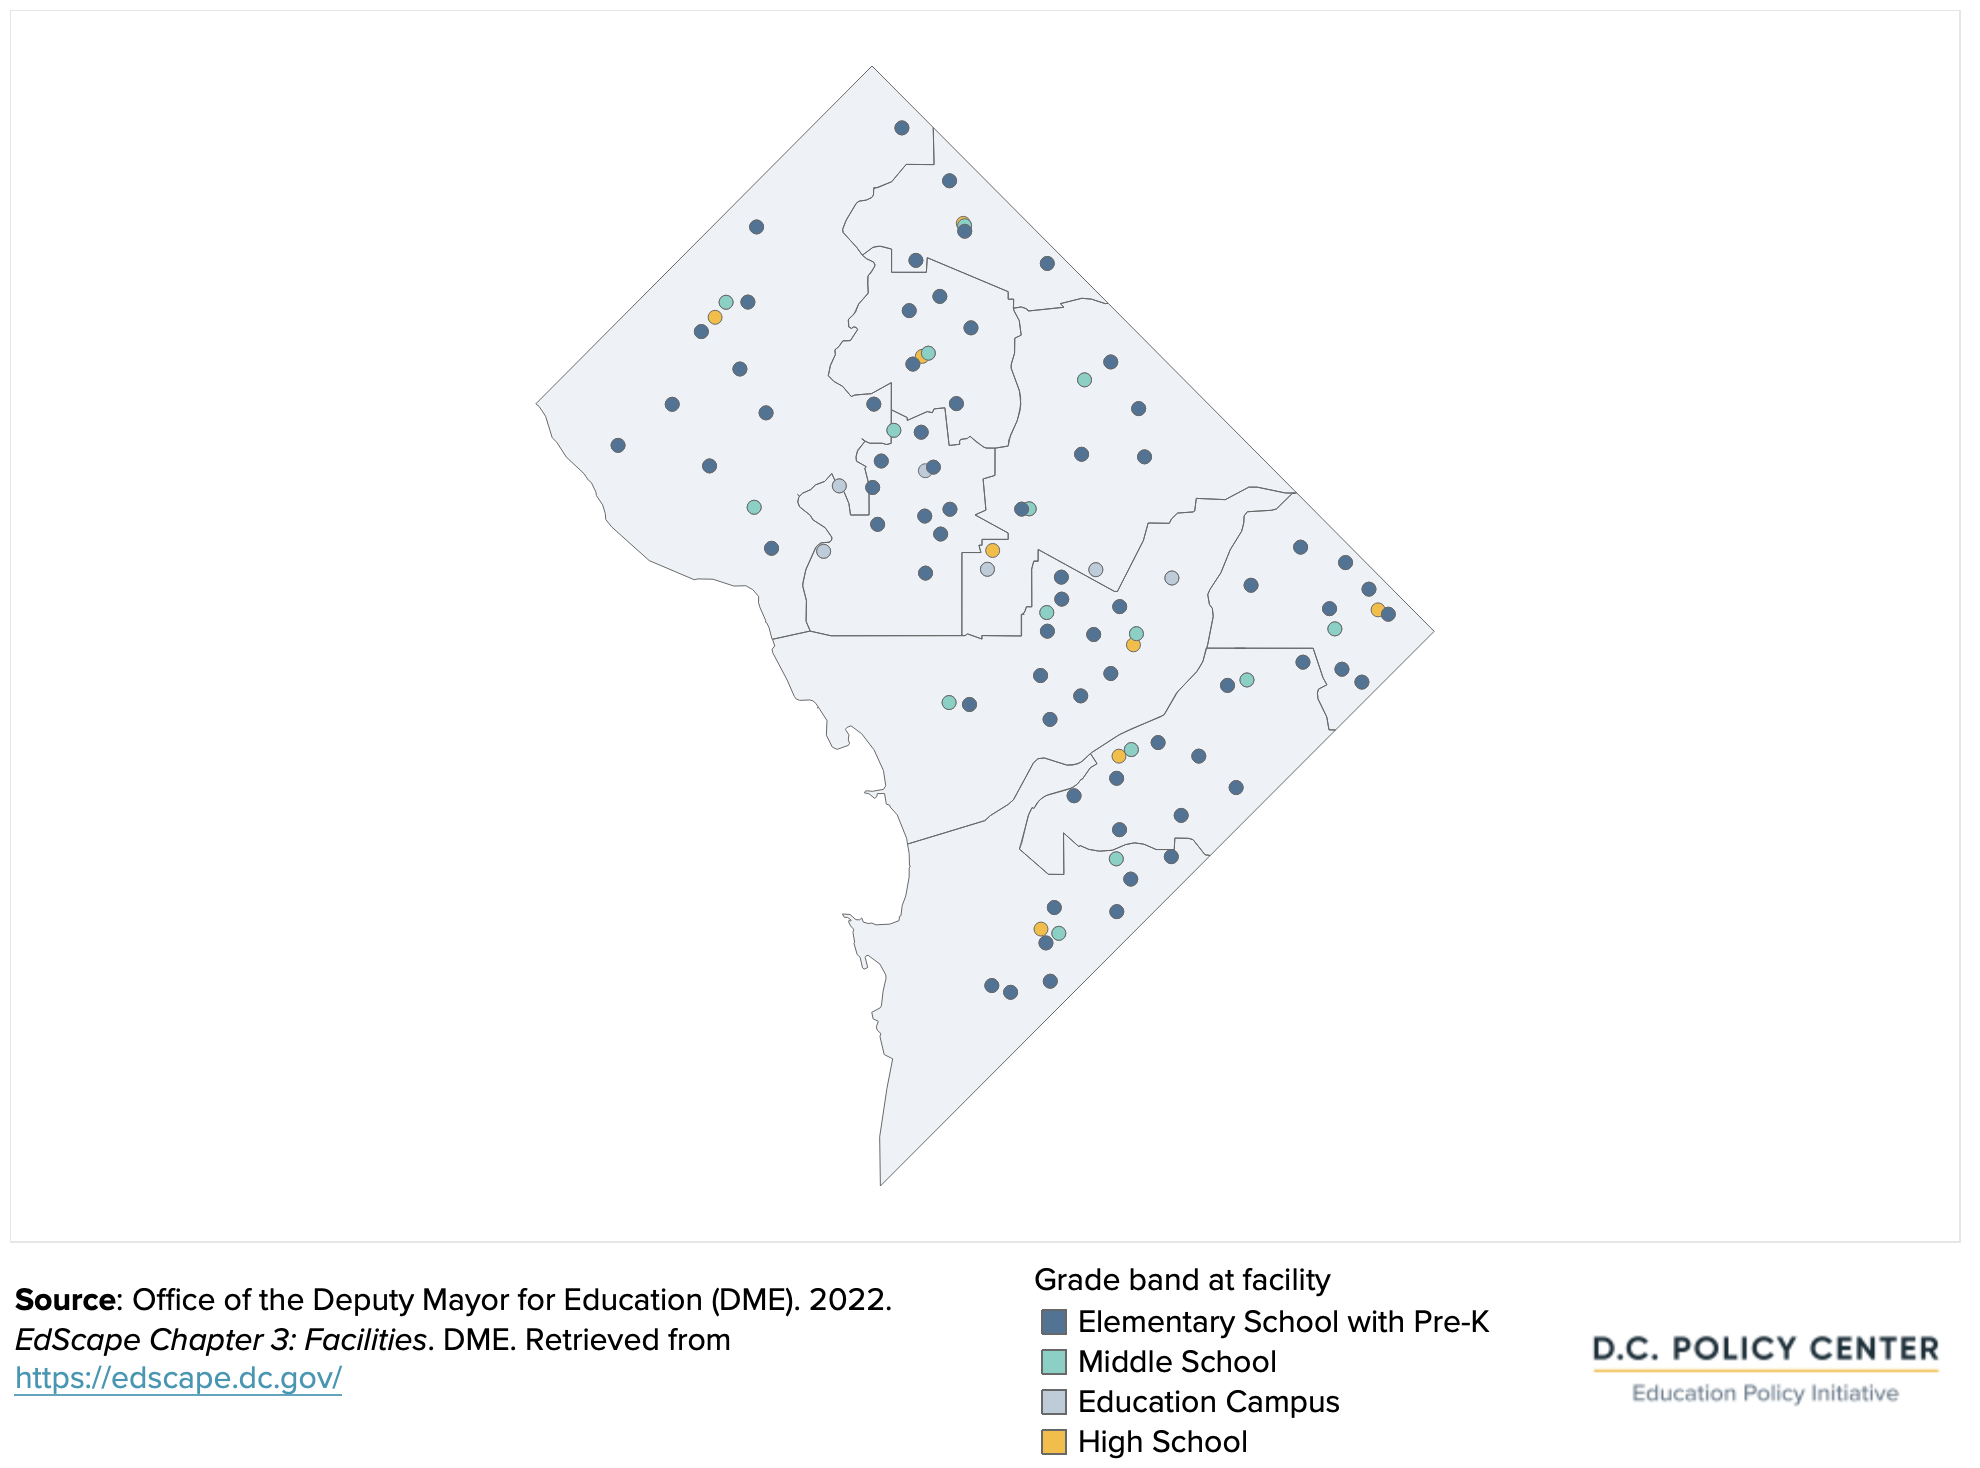
Most by-right schools’ facilities (75 facilities) served students in elementary school grades. 21 facilities served middle school students, and 9 served high school students.
Figure 19. Location of DCPS by-right school facilities by grade band and high school boundary, school year 2021-22
Utilization rates show the extent to which buildings are used. They are calculated as enrollment divided by programmatic capacity, which is reported by DCPS using a consistent methodology based on room type (i.e., general classroom, art room, gym, etc.), room load capacity, and the number of each room type.20 Programmatic capacity includes both permanent and portable capacity.
For two DCPS by-right schools21 undergoing modernization efforts, enrollment for utilization is not available. For the remaining 103 DCPS by-right school buildings, the average utilization rate is 69 percent, which means out of space available for every 100 students, there are 69 students enrolled at the school.
Finding #8
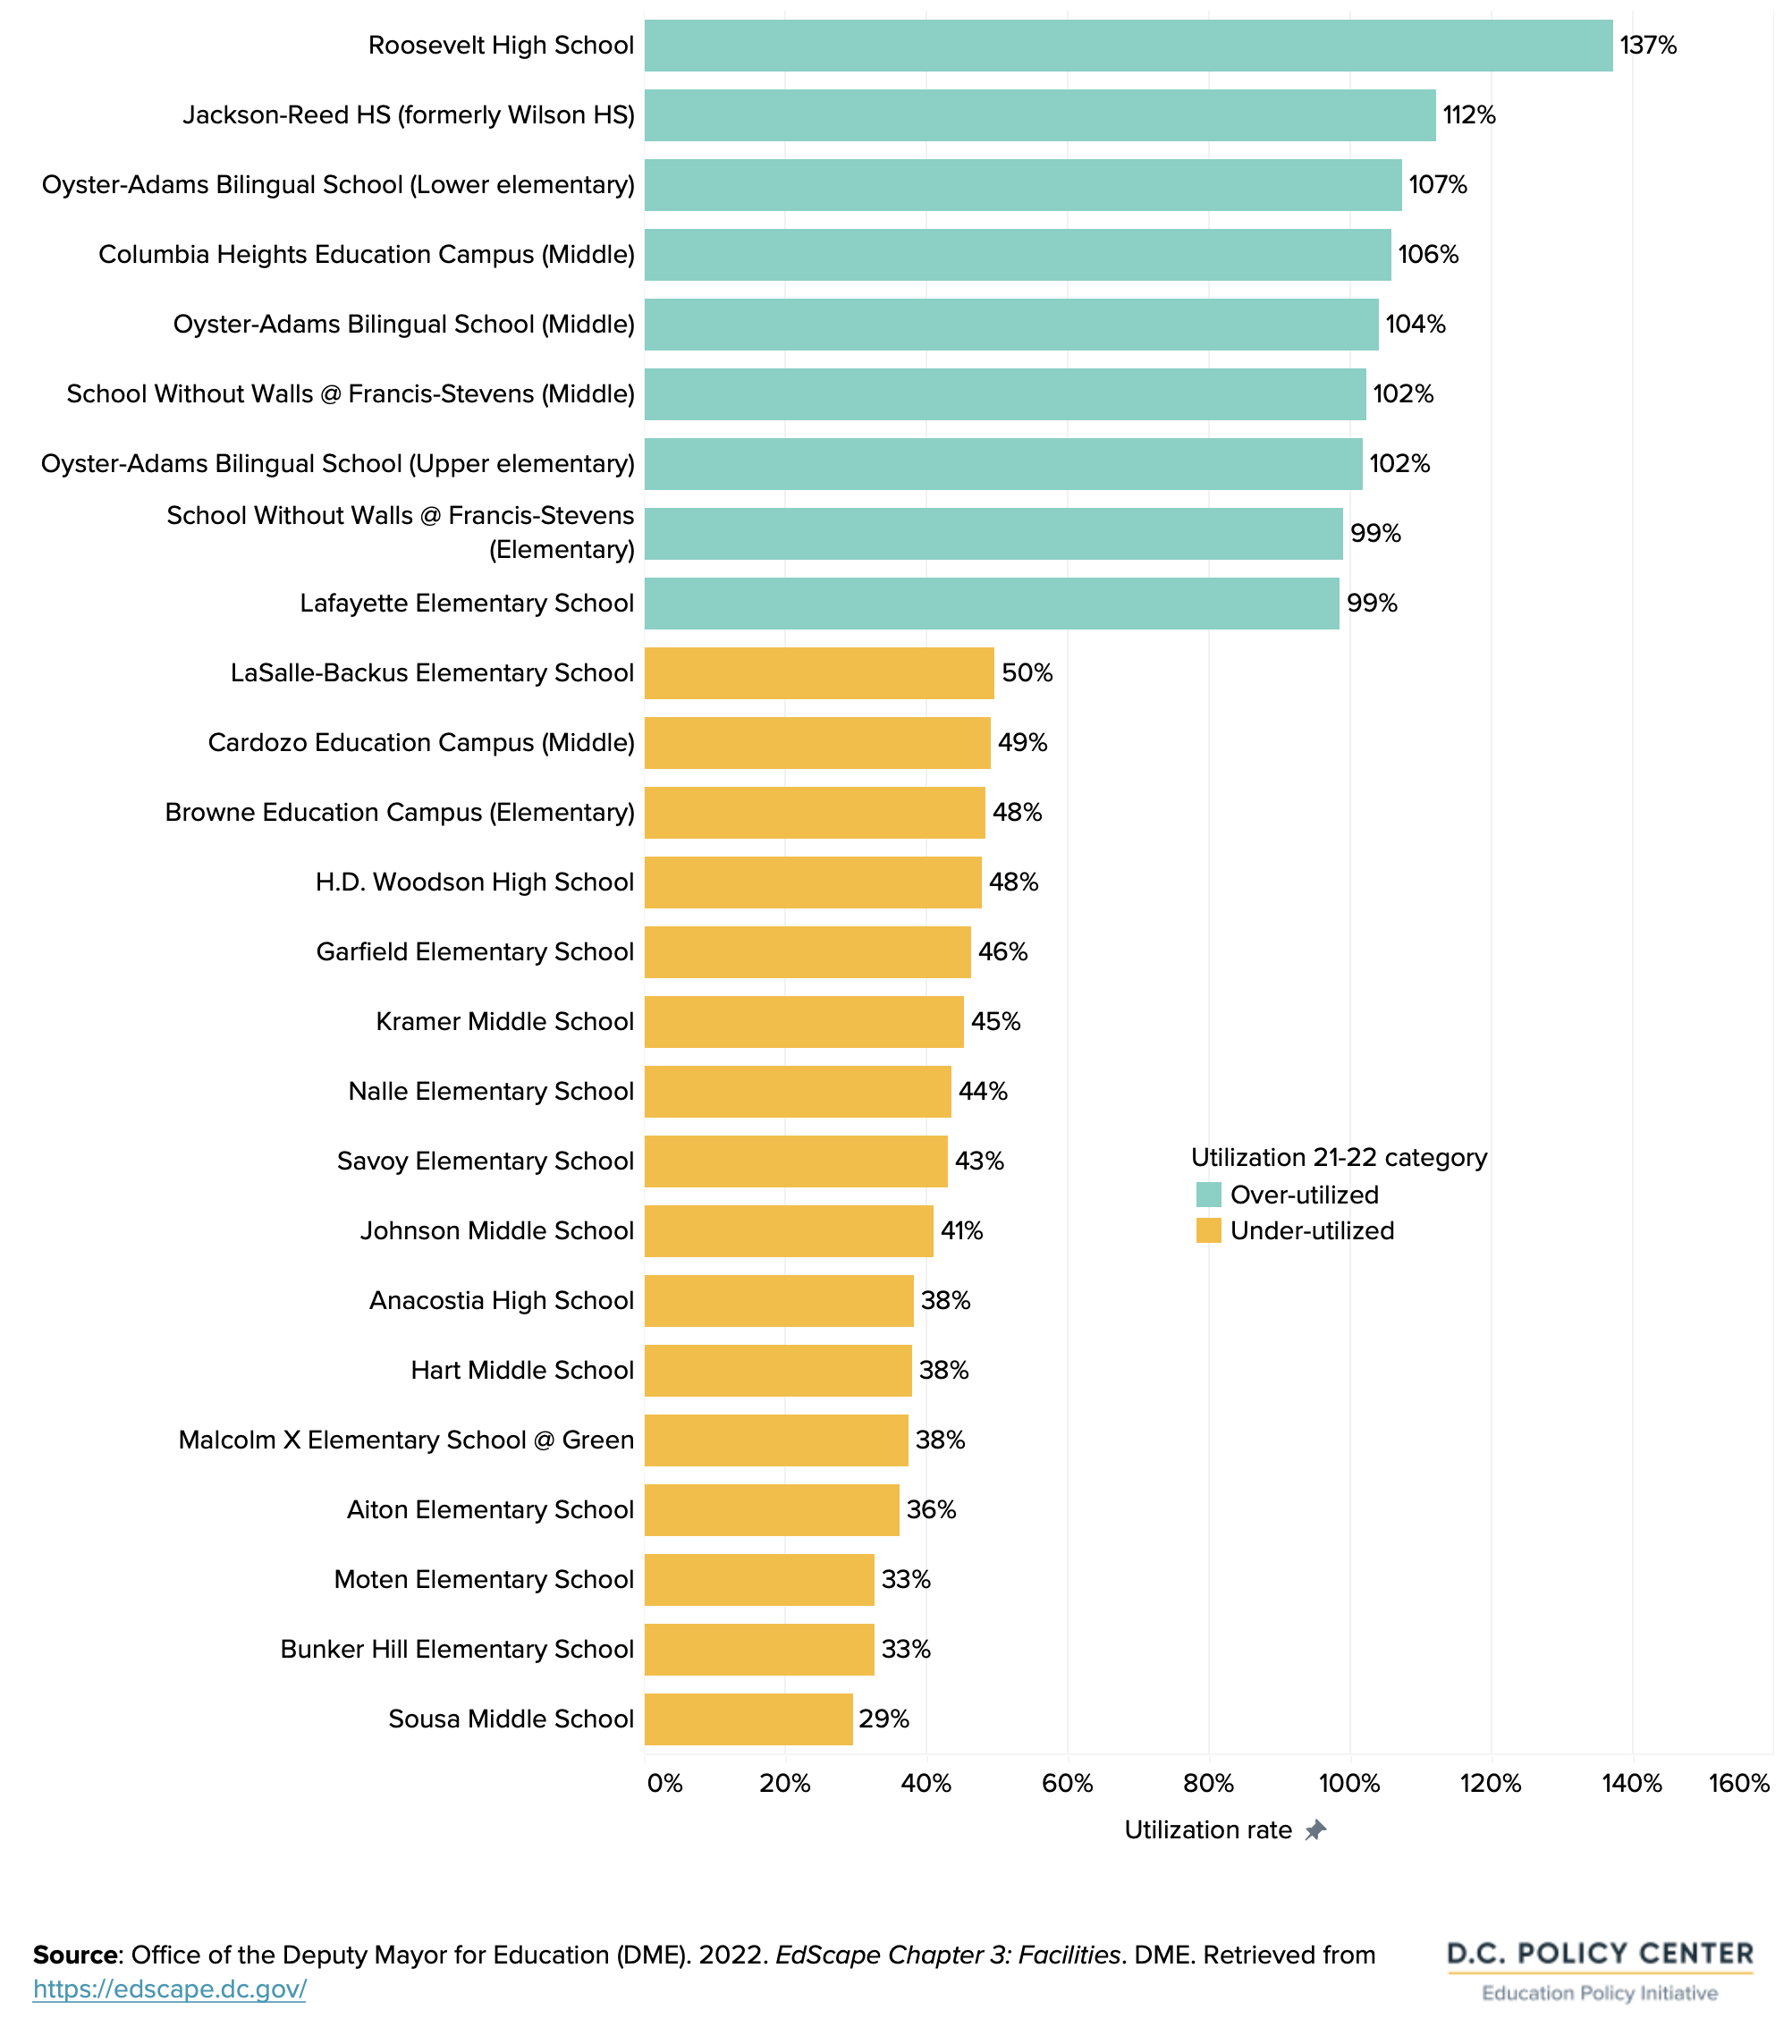
Facility utilization rates vary across the city and by grade band. There are some pockets of high utilization even where boundary participation is low: Just 9 facilities are flagged as over-utilized, and 16 facilities are flagged as under-utilized.
Facility utilization rates do not always follow the same patterns as boundary participation and representation. Some facilities, especially at the elementary level in areas of Southeast D.C., have utilization rates that are 80 percent or more where boundary participation is 30 percent or less.
Figure 20. Facility utilization rates for DCPS by-right schools, school year 2021-22
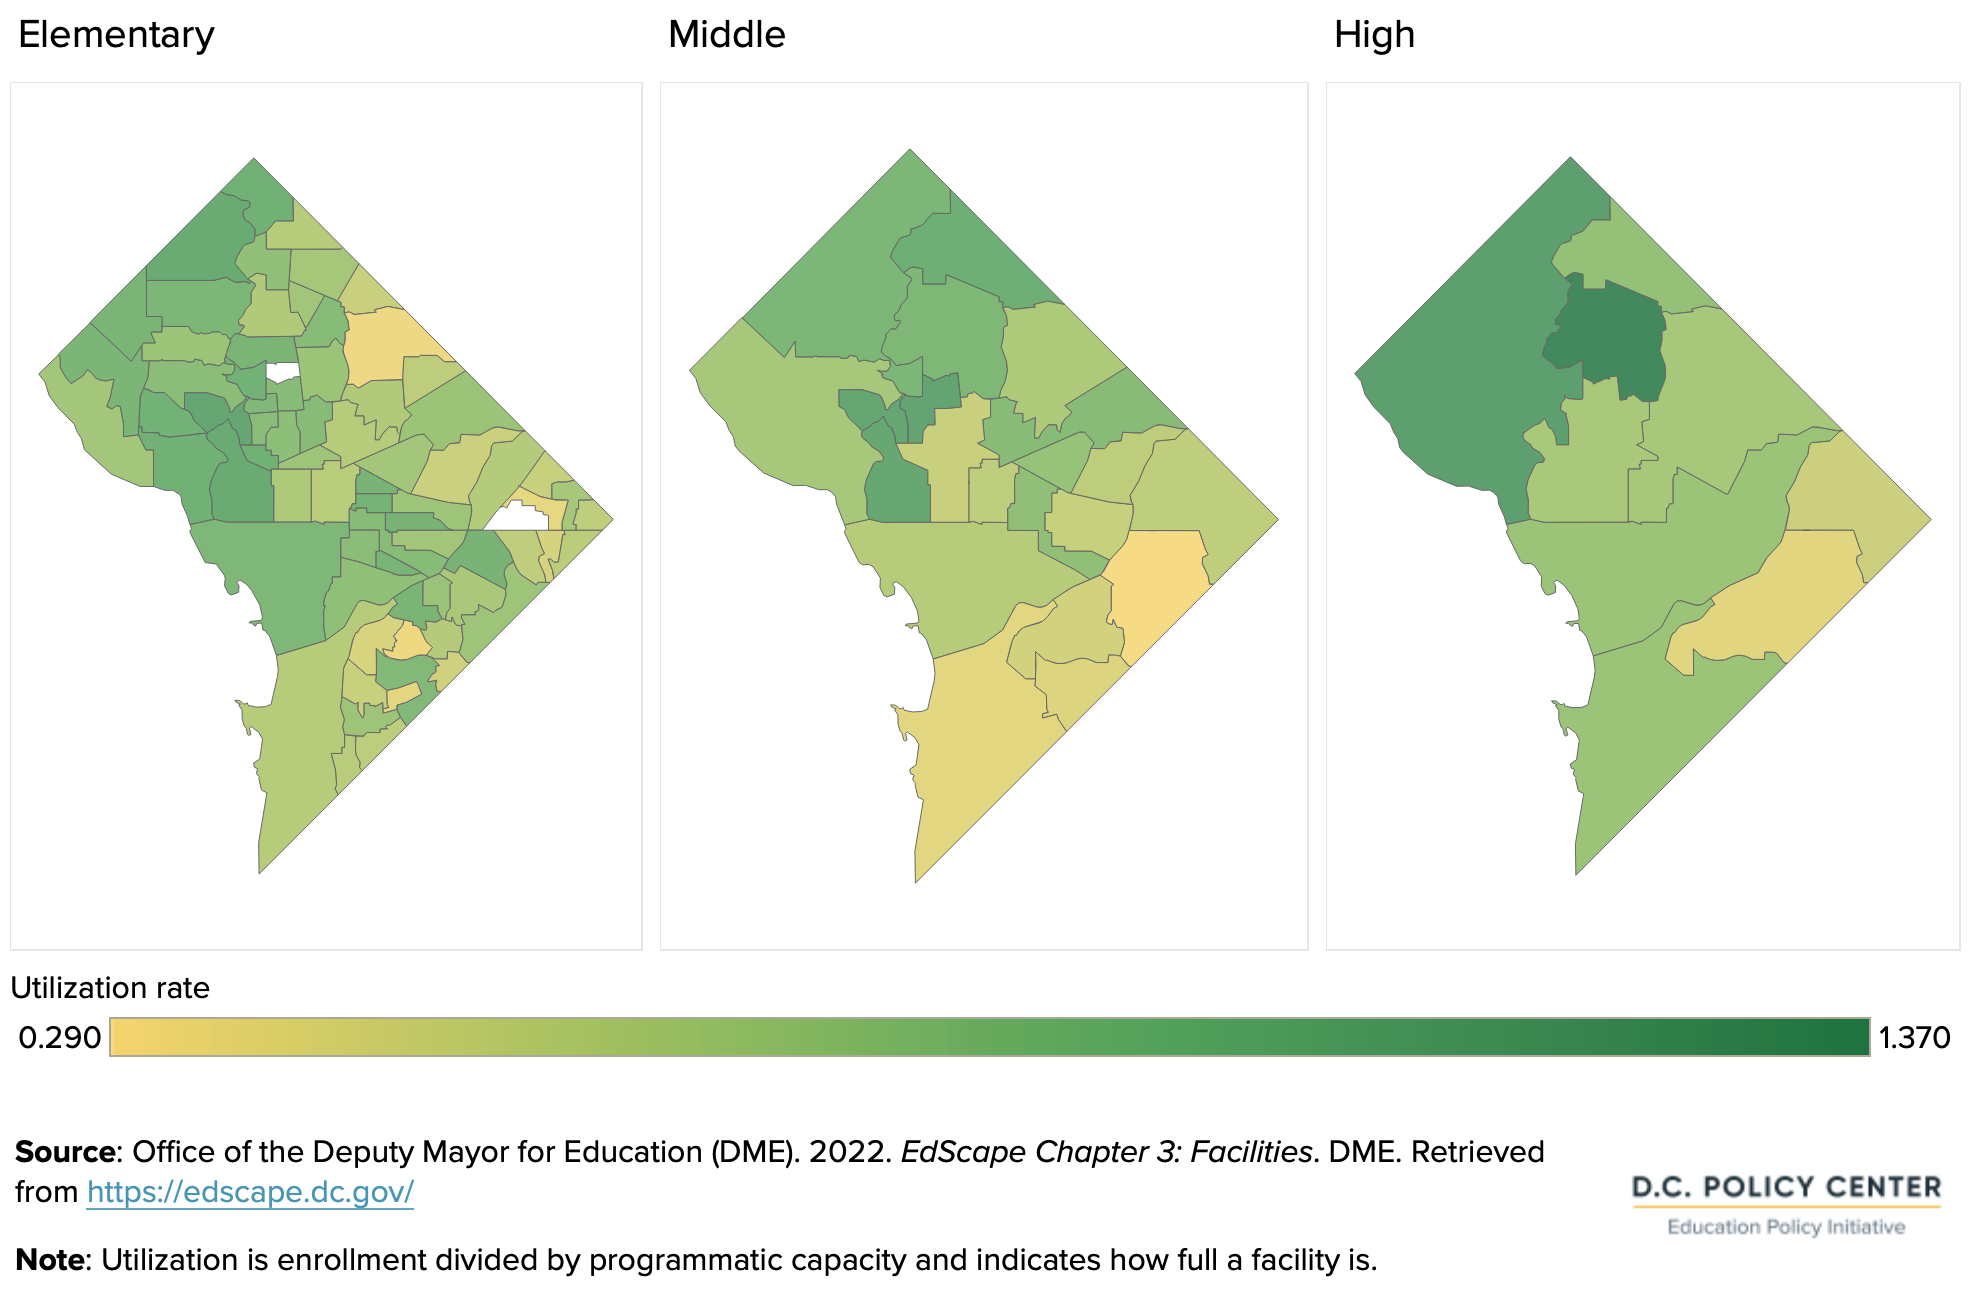
By grade band, average facility utilization is highest for high schools and lowest for middle schools. At 76 percent, high school utilization rates are, on average, higher than the citywide average. This is mostly due to very high rates — over 100 percent — at Roosevelt High School and Jackson-Reed High School. Middle school facility utilization is slightly lower at 64 percent, with variation by feeder pattern. The facility utilization for elementary schools is the same as the citywide average of 69 percent.
Figure 21. Facility utilization rates by grade band and feeder pattern, school year 2021-22
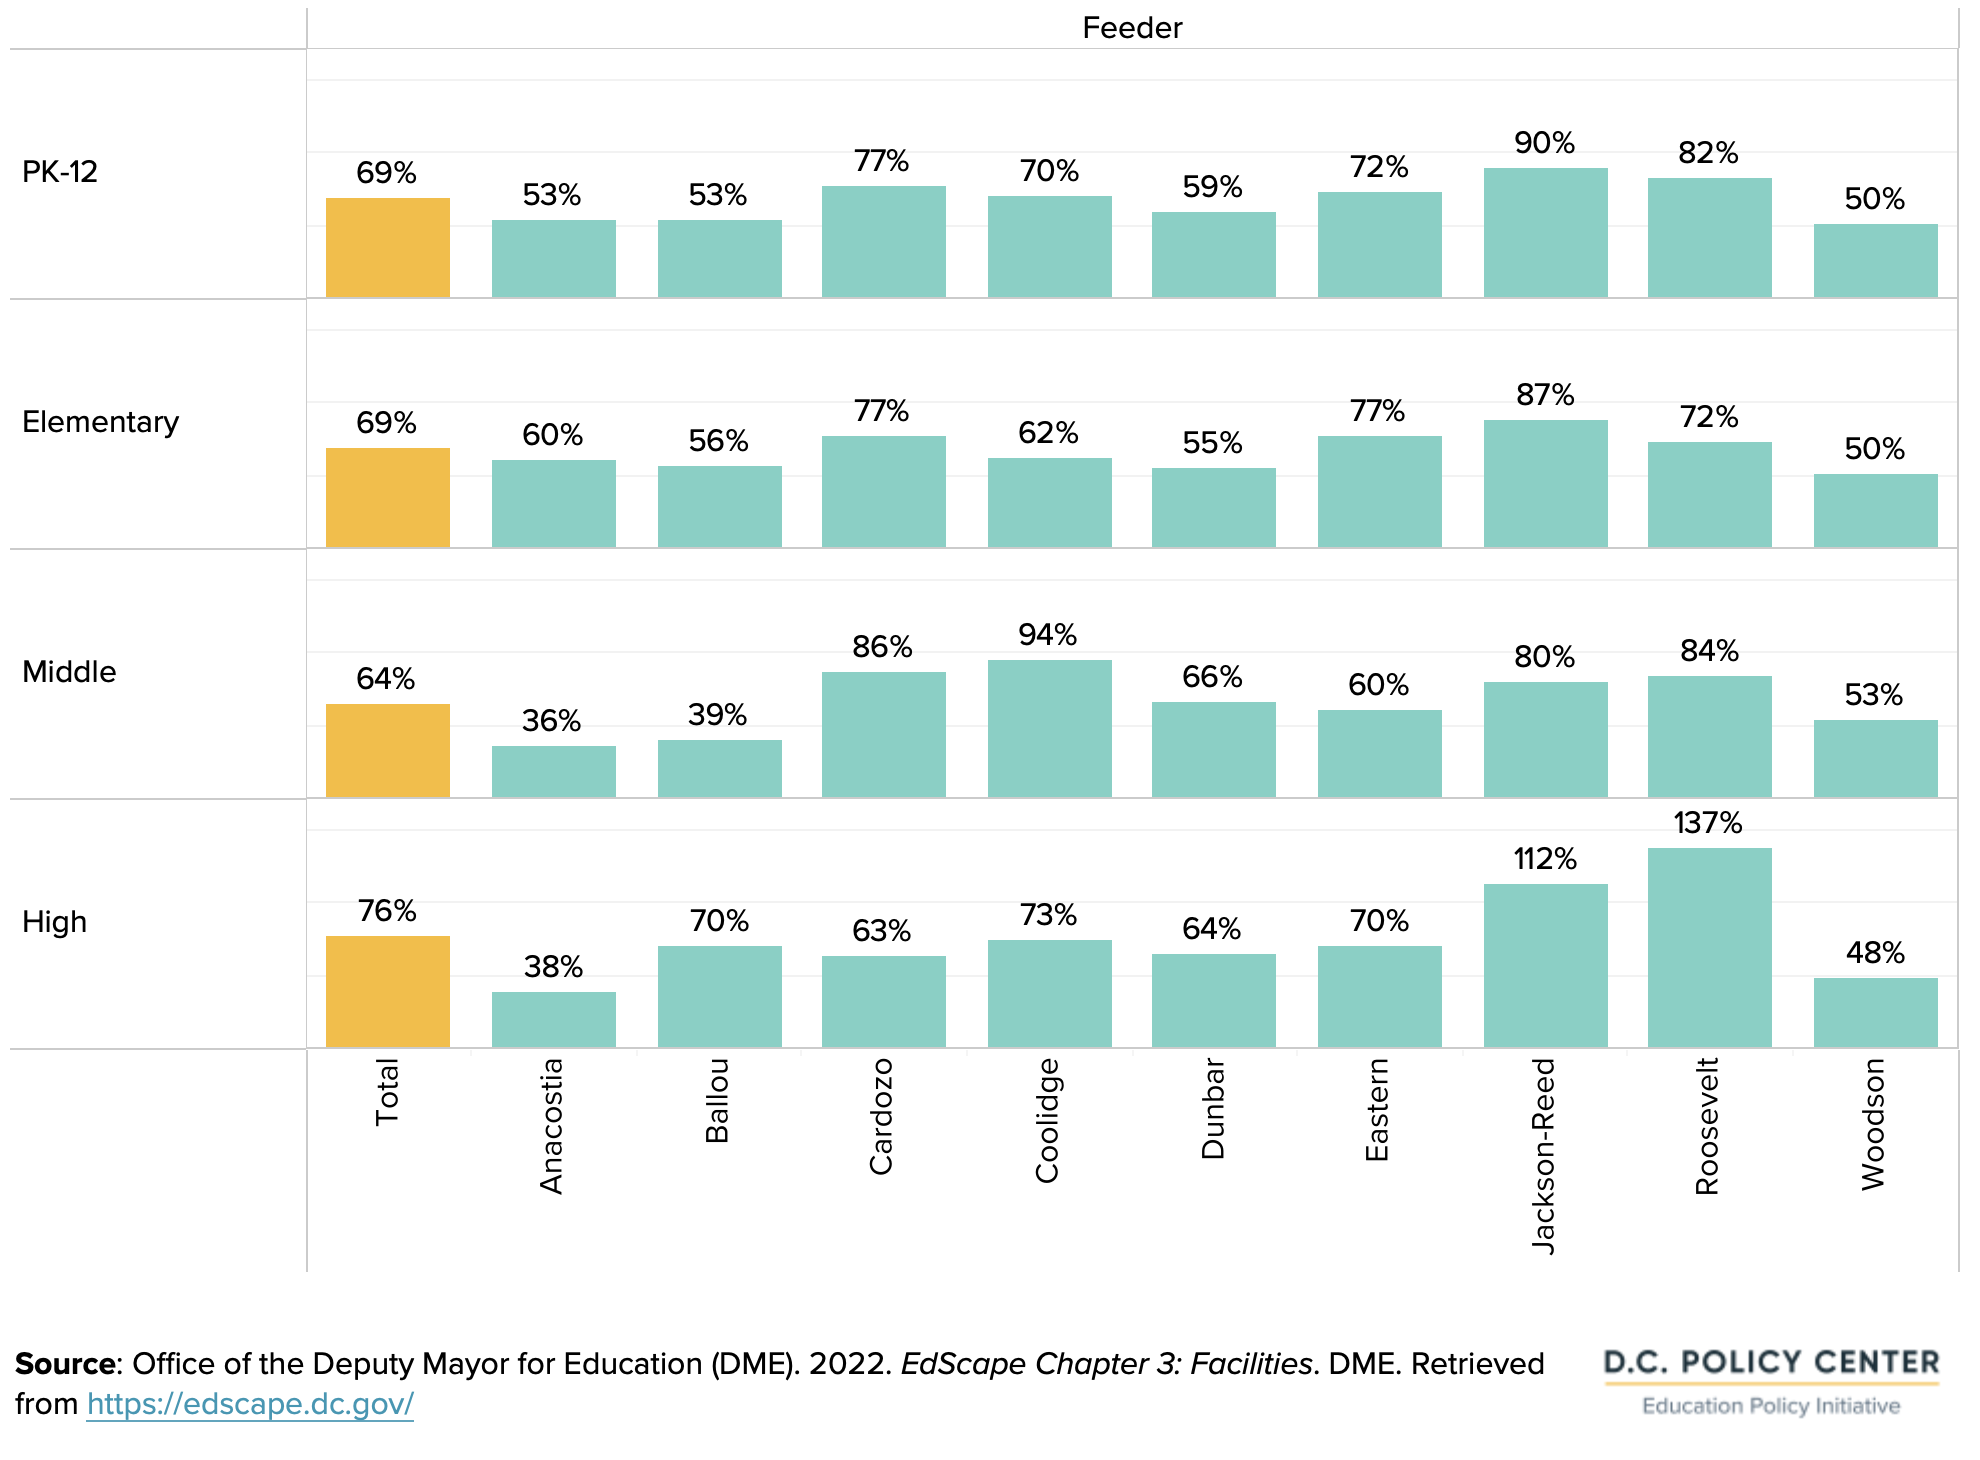
Overall, utilization rates for elementary schools are more consistent than for high schools. All feeder patterns have an average utilization rate for elementary schools that is within 19 percentage points of the citywide average. In contrast, feeder patterns at middle and high school grade bands have a wider range of average utilization, with utilization rates of up to 30 percentage points above or below the average.
Utilization rates are highest for schools within the Roosevelt and Jackson-Reed feeder patterns, and lowest for schools in the Woodson, Ballou, and Anacostia feeder patterns. Some feeder patterns (Eastern and Anacostia) see a sizeable decrease in facility utilization —19 percentage points or more — between elementary and middle school. The Coolidge feeder pattern has an increase of 33 percentage points between these grade bands, due to some new program offerings.
D.C. requires that schools with a facility utilization rate of less 50 percent, or 95 percent or higher, develop a plan to increase utilization or address overcrowding.22 In school year 2021-22, nine schools were over-utilized and 16 schools were under-utilized as measured by these thresholds. Most schools were not identified as having issues with utilization. This means that the boundary process may be most relevant to change utilization rates for these 25 schools that are flagged as over- or under-utilized.
Figure 22. Utilization rates and status for DCPS by-right schools, school year 2021-22
7. Conclusion
School boundaries assign students to by-right schools based on their address, and provide a determinate pathway through elementary, middle, and high school for students who choose their by-right schools. In D.C., 28 percent of students attend their by-right school, and this varies widely across the city with the highest boundary participation rates in the Jackson-Reed feeder pattern (79 percent compared to an average across feeder patterns of 34 percent). Assigning students to school based on their residence also has implications for diversity at the school level given racial and economic housing segregation in D.C., and facility utilization as neighborhoods and preferences for by-right schools shift.
This analysis has developed eight stylized facts about the District’s by-right schools.
- Fewer than half of D.C.’s public schools — 98 out of 249 — are by-right schools, with seats guaranteed for students who live in a boundary area.
- Most students in D.C. do not attend their by-right school: Instead, 72 percent of students in D.C. apply through the common lottery to attend a citywide DCPS school, another DCPS school as an out-of-boundary student, or a public charter school.
- Boundary participation varies greatly across the city: Of the city’s 9 feeder patterns, 1 (Jackson-Reed) has a boundary participation rate that is almost three times greater than the city average. In contrast, 4 other feeder patterns have boundary participation rates of less than 20 percent.
- Younger students are more likely to attend their by-right school: Elementary grades have the highest boundary participation rates, at 31 percent. High schools have the lowest at 20 percent.
- In general, by-right schools are not racially and ethnically representative of students across the city. This is, in part, because of neighborhood demographics: At 53 of D.C.’s 104 by-right schools, the share of Black students is at least five percentage points higher than the city average for the grade band.
- In the feeder pattern with the highest boundary participation, Black students are underrepresented and white students are over-represented: Jackson-Reed is unique in this discrepancy.
- By-right schools in D.C. are more socioeconomically representative than racially or ethnically representative: One of every three schools within 15 percentage points of the city average for at-risk students compared to one out of every five schools within 15 percentage points of the city average for Black students.
- Facility utilization rates vary across the city and by grade band. There are some pockets of high utilization even where boundary participation is low: Just 9 facilities are flagged as over-utilized and 16 facilities are flagged as under-utilized.
Boundary policies can be contentious, creating significant anxiety among families, who may be nervous about changes in their schools. But as this analysis shows, the immediate impacts of boundary changes will be geographically concentrated, especially in neighborhoods where boundary participation rates are very high, or student representation is low, or facility utilization is too high or too low. However, these do not mean that boundary and student assignment policies are irrelevant to other students. New policies may incentivize more students to attend their by-right school, especially the definition of by-right is modified by characteristics other than geographical proximity.
Appendix. Examples of other school districts’ experiences with shifting student assignments
New York City: Increasing school integration and diversity
The New York City Department of Education (NYC DOE) began a planning process to promote school integration and diversity within its more than 30 districts in 2017.23 The process centered on engaging individual districts within NYC to adjust admission criteria at their schools for students in certain groups, in order to increase diversity and better reflect diversity in individual neighborhoods and the city as a whole.24 The diversity plan had a two-pronged approach to getting community feedback: through a School Diversity Advisory Group25 and through a community stakeholder engagement process.26 DOE planned to be a technical advisor as each district created its plan.
The main policy initiative resulting from the plan is to increase diversity through changes to admission policies. Schools across different districts of the city choose to give admissions priorities to applicants from different populations to increase diversity within their schools. Populations-of-focus include applicants who are low-income, English learners, emerging multilingual learners, involved in the child welfare system, or living in temporary housing. Admissions weights and priorities are different for each school and plans are listed by individual school and grade band.27
In 2019, its first year of implementation, the number of schools which met their diversity goals increased after the policy change. Selective middle and high schools saw an increase in the number of offers sent to English learners and students eligible for reduced-price lunch.28 Notably, due to COVID-19, the city put a pause on using academic screens for middle and high schools including grades, test scores, and attendance records. This resulted in a large one-year increase in diversity at some of the city’s most selective high schools,29 showing the potential for innovative student assignment policies in achieving diversity at some schools.
Montgomery County, MD: A study without change
Montgomery County recently conducted a boundary study that examined equitable and optimal outcomes in facility use, student diversity within schools, student proximity to schools, and stability of student assignments.30 The process involved an analysis of existing conditions and community engagement, with a final report submitted to the Montgomery County Board of Education with the main findings.
Engagement activities included regional community meetings; targeted small group meetings; interviews; online participation; and virtual meetings. Consultants found it challenging to reach underrepresented groups and observed that underrepresented groups’ priorities may be different from those of highly-represented groups. The purpose of the boundary analysis process was sometime difficult for the public to understand. Some public meetings became contentious.
The final report did not have specific recommendations on boundary revisions, but instead explored which of five models would maximize the school district’s overall goals. Most models could improve school utilization. Diversity across all models either improved or experienced little change. The report noted that the participants they heard from often associated improving diversity in schools with increases in distance traveled to schools. Improving proximity was difficult to achieve while maintaining the other priority areas, as was assignment stability.31
After the final report release in May 2021, school board members expressed that they did not have immediate plans to look into boundary revisions,32 showing how challenging it can be to shift school boundaries.
New Orleans: Proximity preference
In New Orleans, almost all public school students attend public charter schools, but they have carried out a different kind of boundary revision process. To give students greater access to schools within a half-mile of their home, the Orleans Parish School Board (OPSB) adjusted its geographic priority for the citywide lottery system, or OneApp, where students and families rank their choices for schools throughout the city. The lottery then matches students to schools by weighing a combination of the families’ school rankings and students’ priority statuses.
Since the beginning of this system, students have received priority status for most schools based on whether they have a sibling attending the school, as well as geographic priority for students living in same zone as the school. Half of the open seats in the lottery for certain grades at any one school are reserved for students who fit this geographic priority, but with only seven zones throughout the city, the geographic priority was not seen as a guarantee of proximity.[33]33
OPSB received feedback from families who were interested in school options that were closer to their homes.34 In addition to distributing information to families about close-proximity school options, OPSB proposed adding an additional geographic priority for students residing less than a half mile from their ranked school. In this new policy, 25 percent of seats are reserved for students who live less than a half mile, in addition to 25 percent of seats reserved for students residing in the school’s geographic zone. After these priority seats are filled, students who did not receive a seat through this priority or who did not have a priority are entered into a lottery for remaining seats.
When considering this change, OPSB went through a round of engagement with school operators, the Superintendent’s Parent Advisory Council, and an online survey.35 OPSB decided to pass the half-mile priority. The policy went into effect beginning school year 2019-20. While only 3 percent of kindergarteners were admitted to high-demand schools through this priority, the effects of the policy are felt inequitably by race and income. In its first year of implementation, higher-income students and white students were found to have higher access to high-demand schools based on the half-mile preference when compared to their lower income and Black peers, respectively.36 This shows the importance of modeling new student assignment policies to ensure that goals around equity are met.
Acknowledgements
This report was prepared with generous support from Education Forward DC and the Walton Family Foundation. The report also benefited from comments provided by the Education Policy Initiative’s research advisors, including Matt Chingos, Jon Valant, and Arthur McKee. Their review in no way indicates an endorsement of this report, and all errors are the responsibility of the D.C. Policy Center authors.
Endnotes
- DC Advisory Committee on Student Assignment. Final recommendations on student assignment policies and DCPS school boundaries. D.C. Deputy Mayor for Education. Retrieved from https://dme.dc.gov/sites/default/files/dc/sites/dme/publication/attachments/Final%20Recommendations%20on%20Student%20Assignment%208-18-14%20with%20links%20(rev8-22-14).pdf.
- DC Advisory Committee on Student Assignment. Final recommendations on student assignment policies and DCPS school boundaries. D.C. Deputy Mayor for Education. Retrieved from https://dme.dc.gov/sites/default/files/dc/sites/dme/publication/attachments/Final%20Recommendations%20on%20Student%20Assignment%208-18-14%20with%20links%20(rev8-22-14).pdf.
- The boundary changes were proposed to start in 2015 and would phase in over the course of several years. The final report identified 42 recommendations categorized into the following four areas: (i) student assignment by-right based on DCPS attendance zones; (ii) adequate capacity in zoned DCPS schools; (iii) equitable access to high quality public school options; and (iv) education infrastructure planning.
- D.C. Act 24-470. Fiscal Year 2023 Budget Support Emergency Act of 2022. Subtitle J. School Attendance Zone Boundaries Update (§ 4091) “Attendance Zone Boundaries Emergency Amendment Act of 2022.” Retrieved from https://code.dccouncil.gov/us/dc/council/acts/24-470.
- Enrollment change was not available for Ida B. Wells Middle School and MacFarland Middle School as these are new schools.
- For reference, 73 percent of applicants to the common lottery received a match in 2022. For more information, visit https://www.myschooldc.org/resources/data.
- See District of Columbia Public Schools SY21-22 School Feeder Patterns for more information: https://dcps.dc.gov/sites/default/files/dc/sites/dcps/publication/attachments/SY2122-School-Feeder-Patterns_Feb-2021.pdf.
- In D.C., a school of right is a school where a student who lives in D.C. can enroll at any time and is determined by a family’s address. It may also be called an in-boundary school, or neighborhood school.
- Office of the Deputy Mayor for Education (DME). 2023. EdScape: Private School Enrollment. DME. Retrieved from https://edscape.dc.gov/page/pop-and-students-private-school-enrollment.
- Glazerman, S., & Dotter, D. (2016). Market Signals: Evidence on the Determinants and Consequences of School Choice from a Citywide Lottery. Mathematica Policy Research. Retrieved from https://www.mathematica-mpr.com/our-publications-and-findings/publications/market-signals-how-do-dc-parents-rank-schools-and-what-does-it-mean-for-policy.
- Boundary participation rates for the city are calculated by Office of the Deputy Mayor for Education (DME).
- The participation rates do not include private school students or other students who are in alternative education settings.
- Coffin, C. 2018. Schools in the Neighborhood. D.C. Policy Center. Retrieved from https://www.dcpolicycenter.org/publications/schools-in-the-neighborhood/.
- “At-risk” is a local statutory designation covering students receiving public benefits, experiencing homelessness, being in the foster care system, or being over-age in high school.
- Home Owners’ Loan Corporation (HOLC) redlining maps are missing for D.C.
- Shoenfeld, S. 2019. “Mapping Segregation in D.C.” D.C. Policy Center. Retrieved from https://www.dcpolicycenter.org/publications/mapping-segregation-fha/.
- Sayin, Y. 2018. Taking Stock of the District’s Housing Stock. D.C. Policy Center. Retrieved from https://www.dcpolicycenter.org/publications/taking-stock-full-report/.
- Office of the Deputy Mayor for Education (DME). 2022. “EdScape: Trends in Distance to School by Grade Band.” DME. Retrieved from https://edscape.dc.gov/page/enrollment-patterns-trends-distance-school-grade-band.
- Monarrez, T. and Chien, C. 2021. Dividing Lines: Racially Unequal School Boundaries in US Public School Systems. The Urban Institute: Center on Education Data and Policy. Retrieved from https://www.urban.org/research/publication/dividing-lines-racially-unequal-school-boundaries-us-public-school-systems.
- Office of the Deputy Mayor for Education (DME). 2021. 2021 Master Facilities Plan, Annual Supplement. DME. Retrieved from https://dme.dc.gov/sites/default/files/dc/sites/dme/publication/attachments/2021%20MFP%20Annual%20Supplement_FINAL.pdf.
- Raymond Elementary School and Smothers Elementary School are undergoing modernization and do not have enrollment for utilization data, and therefore are excluded from this analysis.
- Code of the District of Columbia. Section 38-2803: Multiyear Facilities Master Plan. Retrieved from https://code.dccouncil.gov/us/dc/council/code/sections/38-2803.
- Initial goals included: (1) increasing the number of students in a racially representative school by 50,000 in the next five years; (2) decrease the number of economically stratified schools by 10% in the next five years; and (3) increase the number of inclusive schools that serve English learners and Students with Disabilities.
- New York City Department of Education. 2022. School Diversity Advisory Group Recommendations. Retrieved from https://www.schools.nyc.gov/about-us/vision-and-mission/diversity-in-our-schools/school-diversity-advisory-group-recommendations.
- The School Diversity Advisory Group included representatives from city government, local and national experts on school diversity, parents, advocates, students, and community leaders. The group was charged with analyzing the diversity plan’s goals, policy plans, and making formal recommendations to the Mayor and Chancellor. Recommendations made in 2018 made few small changes to the original NYC DOE recommendations and are centered around the themes of goals, metrics, and accountability; race, diversity, and enrollment; resources; restorative justice and practices; and representation.
- The community stakeholder engagement process focused on working with school leaders, parents, community members, and elected leaders in each district of the city to create their own district-specific diversity plan.
- NYC Department of Education. 2022. Diversity in Admissions. Retrieved from https://www.schools.nyc.gov/enrollment/enrollment-help/meeting-student-needs/diversity-in-admissions.
- O’Connel-Domenech, A. 2021. Some schools show increased diversity first year after selective middle and high school application changes. AMNY. Retrieved from https://www.amny.com/news/some-schools-show-increased-diversity-first-year-after-selective-middle-and-high-school-application-changes/.
- Elsen-Rooney, M. 2022. New NYC high school admissions rules could slow pandemic-era diversity gains. Chalkbeat – NYC. Retrieved from https://ny.chalkbeat.org/2022/10/14/23405193/nyc-pandemic-diversity-admissions-banks-selective-schools.
- WXY. 2020. Montgomery County Public Schools. Districtwide Boundary Analysis – Interim Analysis. Retrieved from https://www.montgomeryschoolsmd.org/uploadedFiles/departments/publicinfo/Boundary_Analysis/interim-report/MCPS_InterimReport_Full.pdf.
- WXY. 2020. Montgomery County Public Schools – Districtwide Boundary Analysis. Retrieved from https://www.montgomeryschoolsmd.org/uploadedFiles/departments/publicinfo/Boundary_Analysis/BoundaryAnalysis_Final%20Report.pdf.
- Schotz, A. 2021. After final boundary report, school board members not committing to redistricting. Bethesda Magazine. Retrieved from https://bethesdamagazine.com/2021/05/14/after-final-boundary-report-school-board-members-not-committing-to-redistricting/.
- Gerry et al. 2020. White and higher income students are more likely to benefit from OneApp’s half-mile admissions policy. Education Research Alliance for New Orleans. Retrieved from https://www.documentcloud.org/documents/20421218-20201208-gerry-et-al-white-and-higher-income-students-are-more-likely-to-benefit-from-oneapps-half-mile-admissions-priority.
- Crockett, J. 2018. Orleans Parish School Board considers giving placement priority for schools in student’s neighborhood. WDSU. Retrieved from https://www.wdsu.com/article/orleans-parish-school-board-considers-giving-placement-priority-for-schools-in-students-neighborhood/23696155#.
- Gerry et al. 2020. White and higher income students are more likely to benefit from OneApp’s half-mile admissions policy. Education Research Alliance for New Orleans. Retrieved from https://www.documentcloud.org/documents/20421218-20201208-gerry-et-al-white-and-higher-income-students-are-more-likely-to-benefit-from-oneapps-half-mile-admissions-priority.
- Gerry et al. 2020. White and higher income students are more likely to benefit from OneApp’s half-mile admissions policy. Education Research Alliance for New Orleans. Retrieved from https://www.documentcloud.org/documents/20421218-20201208-gerry-et-al-white-and-higher-income-students-are-more-likely-to-benefit-from-oneapps-half-mile-admissions-priority.