Three-quarters of public school students in the District attend a school other than the in-boundary school in their neighborhood, where they have a right to attend. But boundary participation rates, or the percent of public school students who attend their in-boundary school, vary widely across the city and are extremely high in several adjoining neighborhoods. A D.C. Policy Center report, Schools in the Neighborhood: Can Neighborhood Characteristics Explain Enrollment at In-Boundary Schools?, examines the connections between neighborhood characteristics and boundary school enrollment rates among the District of Columbia’s public school students. The report finds that living in the feeder pattern for Wilson High School outweighs all other neighborhood aspects in explaining the differences in boundary participation rates across neighborhoods.
Explore the data behind Schools in the Neighborhood below. Download the data and read about the methodology here.
School participation by neighborhood and grade band
In school year 2016-17, 27 percent of D.C.’s public school students attended their in-boundary school where they have a right to attend based on where they live. The other 73 percent applied through a lottery to attend a school other than their in-boundary option, which breaks down across different options (aside from in-boundary) as follows: 46 percent of public school students attended a public charter school, 21 percent attended an out-of-boundary DCPS school, and the remaining 6 percent attended other DCPS schools[1] (Office of the Deputy Mayor for Education (DME), 2017).
View geographic patterns in school participation rates based on where students live in the map below. Click on a school boundary for more information. To move between views, select a grade band and school participation[2] option:
- Boundary participation rates show the percent of public school students living in each school’s boundary who attend the in-boundary school, from DME’s 2016-17 Public School Enrollments per DCPS Boundary dataset
- Out-of-boundary participation rates show the percent of public school students living in each school’s boundary who attend a DCPS school other than their in-boundary school, estimated using DME’s 2016-17 Public School Enrollments per DCPS Boundary dataset
- Public charter school participation rates show the percent of public school students living in each school’s boundary who attend a public charter school anywhere in the city, estimated using DME’s 2016-17 Public School Enrollments per DCPS Boundary dataset
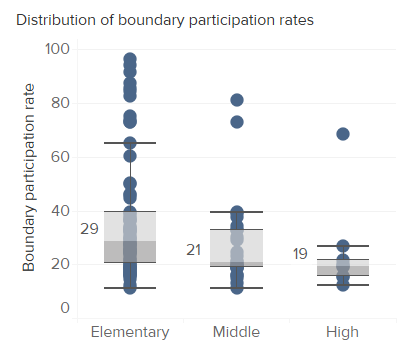
Elementary school students attend in-boundary schools at the highest rates, and middle school students are most likely to attend a public charter school. The share of students in public charter schools declines at the high school level, as DCPS high school options that require an application–alternatives not available at the middle school level—enroll 20 percent of all public school students. High proportions of enrollment at in-boundary schools is mostly confined to the western part of the city (within the Wilson HS boundary), and public charter school enrollment is higher toward the east. Enrollment at out-of-boundary schools is highest within school boundaries that are closest to school neighborhoods that have high boundary participation.
Neighborhood characteristics across the city
Living within the feeder pattern for Wilson HS outweighs all neighborhood aspects in explaining the differences in boundary participation rates across neighborhoods, but certain neighborhood demographics are also associated with school enrollment patterns. Controlling for other aspects, the elementary schools that draw the most students are likely to be located in neighborhoods that have proportionally smaller African American populations or African American populations that are growing. Outside the Wilson HS boundary, neighborhoods with higher poverty rates have relatively higher boundary participation rates.
See how neighborhood characteristics differ by elementary school boundary in the map below.
Elementary school neighborhoods that stand out
The Schools in the Neighborhood report highlights some elementary school neighborhoods that are different from the rest:
- Schools with the highest and lowest boundary participation
There are 19 elementary school neighborhoods (mostly located in the westernmost part of D.C.) that have high boundary participation rates above the 75th percentile for all elementary schools, which is 39.5 percent. The 18 elementary schools with the lowest boundary participation rates below the 25th percentile for all schools (20.6 percent) are located throughout the eastern part of the city.
- Schools that draw more or fewer students than expected
A handful of in-boundary elementary schools have higher or lower boundary participation rates than expected given the schools’ neighborhoods. The three schools that draw more than expected are located in changing neighborhoods. Powell ES and J.O. Wilson ES are located in racially diverse neighborhoods with declining African American populations. The third school, Orr ES, is located in a predominantly African American neighborhood and has a rapidly growing school-age population compared to adjacent neighborhoods. The six schools that have lower boundary participation rates than predicted appear to be in neighborhoods that have proportionally fewer children than average to begin with.
- Neighborhoods that look different from their schools
In most school boundary neighborhoods, schools have a larger share of African American students than the neighborhood population of all ages. Two clusters of neighborhoods have demographic make-ups that are largely different from the demographic make-up of their in-boundary school.
A cluster of schools in the north center of the city has a lower share of African American students when compared to the school’s neighborhood. This could mean that African American students less likely to choose their in-boundary schools, or that neighborhoods are changing generationally, and the school-age population is lower for African Americans in the neighborhood.
In a few schools in the center of the city, African American students are overrepresented compared to the school neighborhood population. In schools that have more African American students compared to their neighborhoods, more enrolled students live outside the boundary compared to other neighborhoods. This could mean that there is an inflow of African American students.
See where these schools are located in the map below.
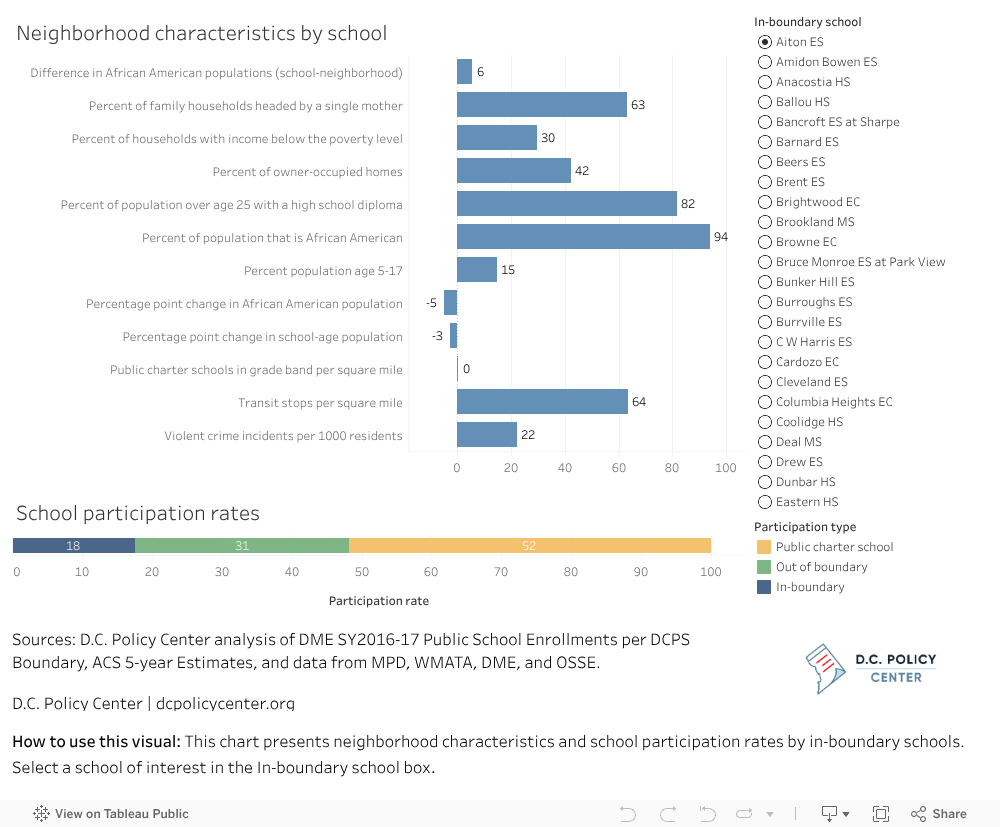
Neighborhood characteristics by school boundary
Each in-boundary school’s neighborhood is unique. Explore neighborhood characteristics and school participation rates for a particular school based on the percent of in-boundary participation by selecting a particular school in the graph below.
About the data
The dataset combines data from local sources with U.S. Census Bureau data to assemble a profile of neighborhood characteristics and school enrollment patterns for 109 school boundaries. Sources include the following datasets:
- The Office of the Deputy Mayor for Education (DME) dataset on where pre-kindergarten through grade 12 students lived and attended school in school year 2016-17, by school and boundary neighborhood
- DME’s list of school addresses for 2016-17 (school addresses changed to permanent locations for in-boundary schools that were in swing spaces while the sites underwent modernizations)
- Office of the State Superintendent (OSSE)’s Equity Reports with student demographics for school year 2016-17 Neighborhoods
- S. Census Bureau 2012-2016 American Community Survey (ACS) 5-Year Estimates at the Census Block Group level for indicators of neighborhood change (the change in and proportion of African American[3] and school-age populations) and economic opportunity (poverty rates,[4] the proportion of households headed by single mothers, the proportion of residents with a high school education, and home ownership rates)
- Open Data DC’s data on violent crime incidents (Metropolitan Police Department), number of Metrobus and Metrorail stations (Washington Metropolitan Area Transit Authority (WMATA)), and number of Circulator bus stops from the District Department of Transportation (DDOT))
[1] This includes six selective DCPS high schools that require an application for admission (Banneker Senior HS, Columbia Heights Education Campus, Duke Ellington School of the Arts, McKinley Technology High School, Phelps Architecture, Construction, and Engineering High School, and School Without Walls Senior High School), one citywide high school (Ron Brown College Preparatory HS, an all-male public high school), two citywide elementary schools, and a few other alternative schools.
[2] The source for boundary participation rates is the Office of the Deputy Mayor for Education’s dataset, SY2016-17 Public School Enrollments per DCPS Boundary. The D.C. Policy Center analyzed this data to estimate public charter school and out-of-boundary participation rates. See the methodology write-up for more information.
[3] We were not able to consider Hispanic/Latino or white population at the school boundary level due to small sample populations and high margins of error. We consider change in African American population to see if boundary participation is different for neighborhoods that are shifting.
[4] We did not consider median income because this metric was not possible to aggregate cleanly across several Census Block Groups.