Last December, Minneapolis did away with single-family zoning, permitting three-family homes in each lot, abolishing parking minimums, and allowing high-density buildings along transit corridors. In March, Seattle upzoned many of its neighborhoods, including eliminating single-family zoning in some areas. Then came Oregon, which, in late June, passed legislation to eliminate single-family zoning and instead allow by right two- to four-unit (and sometimes larger) buildings on lots that are presently zoned for single-family homes, depending on city size.
To be sure, the impacts of these changes will not be felt overnight. Over time, however, they will be transformative. More permissive zoning for large swaths of land currently dedicated to single-family housing can completely change neighborhoods, making them more inclusive, easier to afford, more cosmopolitan and culturally richer, and better equipped with amenities. Minneapolis lawmakers said that addressing segregation and racism was the key reason why they have banished the practice of single-family zoning. In Seattle, increasing housing prices provided the impetus for change. Oregon legislators were motivated by reducing environmental impacts and limiting sprawl.
The potential for transformative changes in well-established neighborhoods also creates a strong resistance. Residents sometimes object to new development because they are concerned about the built environment and local services. For example, they worry about increasing crime and traffic, or overcrowding at schools or public parks; they don’t want taller buildings to obstruct their views or block their sun. Others have architectural concerns, thinking that new development would not fit into the historic nature of a neighborhood or match the historic vision of a city. Homeowners may also worry that adding density to neighborhoods, especially in the form of rental units, could devalue their property. Residents worry that new development will raise rents and increase the pace of gentrification by attracting too many rich people—or change the neighborhood by attracting too many poor people. And while many residents express a strong general support for more affordable housing, these sentiments do not automatically translate into support for denser development where they live.
Residents have many means of expressing their opposition to increased density: through planning (for example, by appealing specific projects, design reviews, filing historic designation petitions, or influencing community planning processes); the legal system (for example, by appealing zoning change decisions or suing projects under various laws such as environmental laws or for causing harm); through the political system (by lobbying, ballot initiatives, supporting candidates who are against densification, etc.); and through other means (such as influencing public opinion by creating powerful stories, or coining negative labels, accusing developers with corruption, etc.)
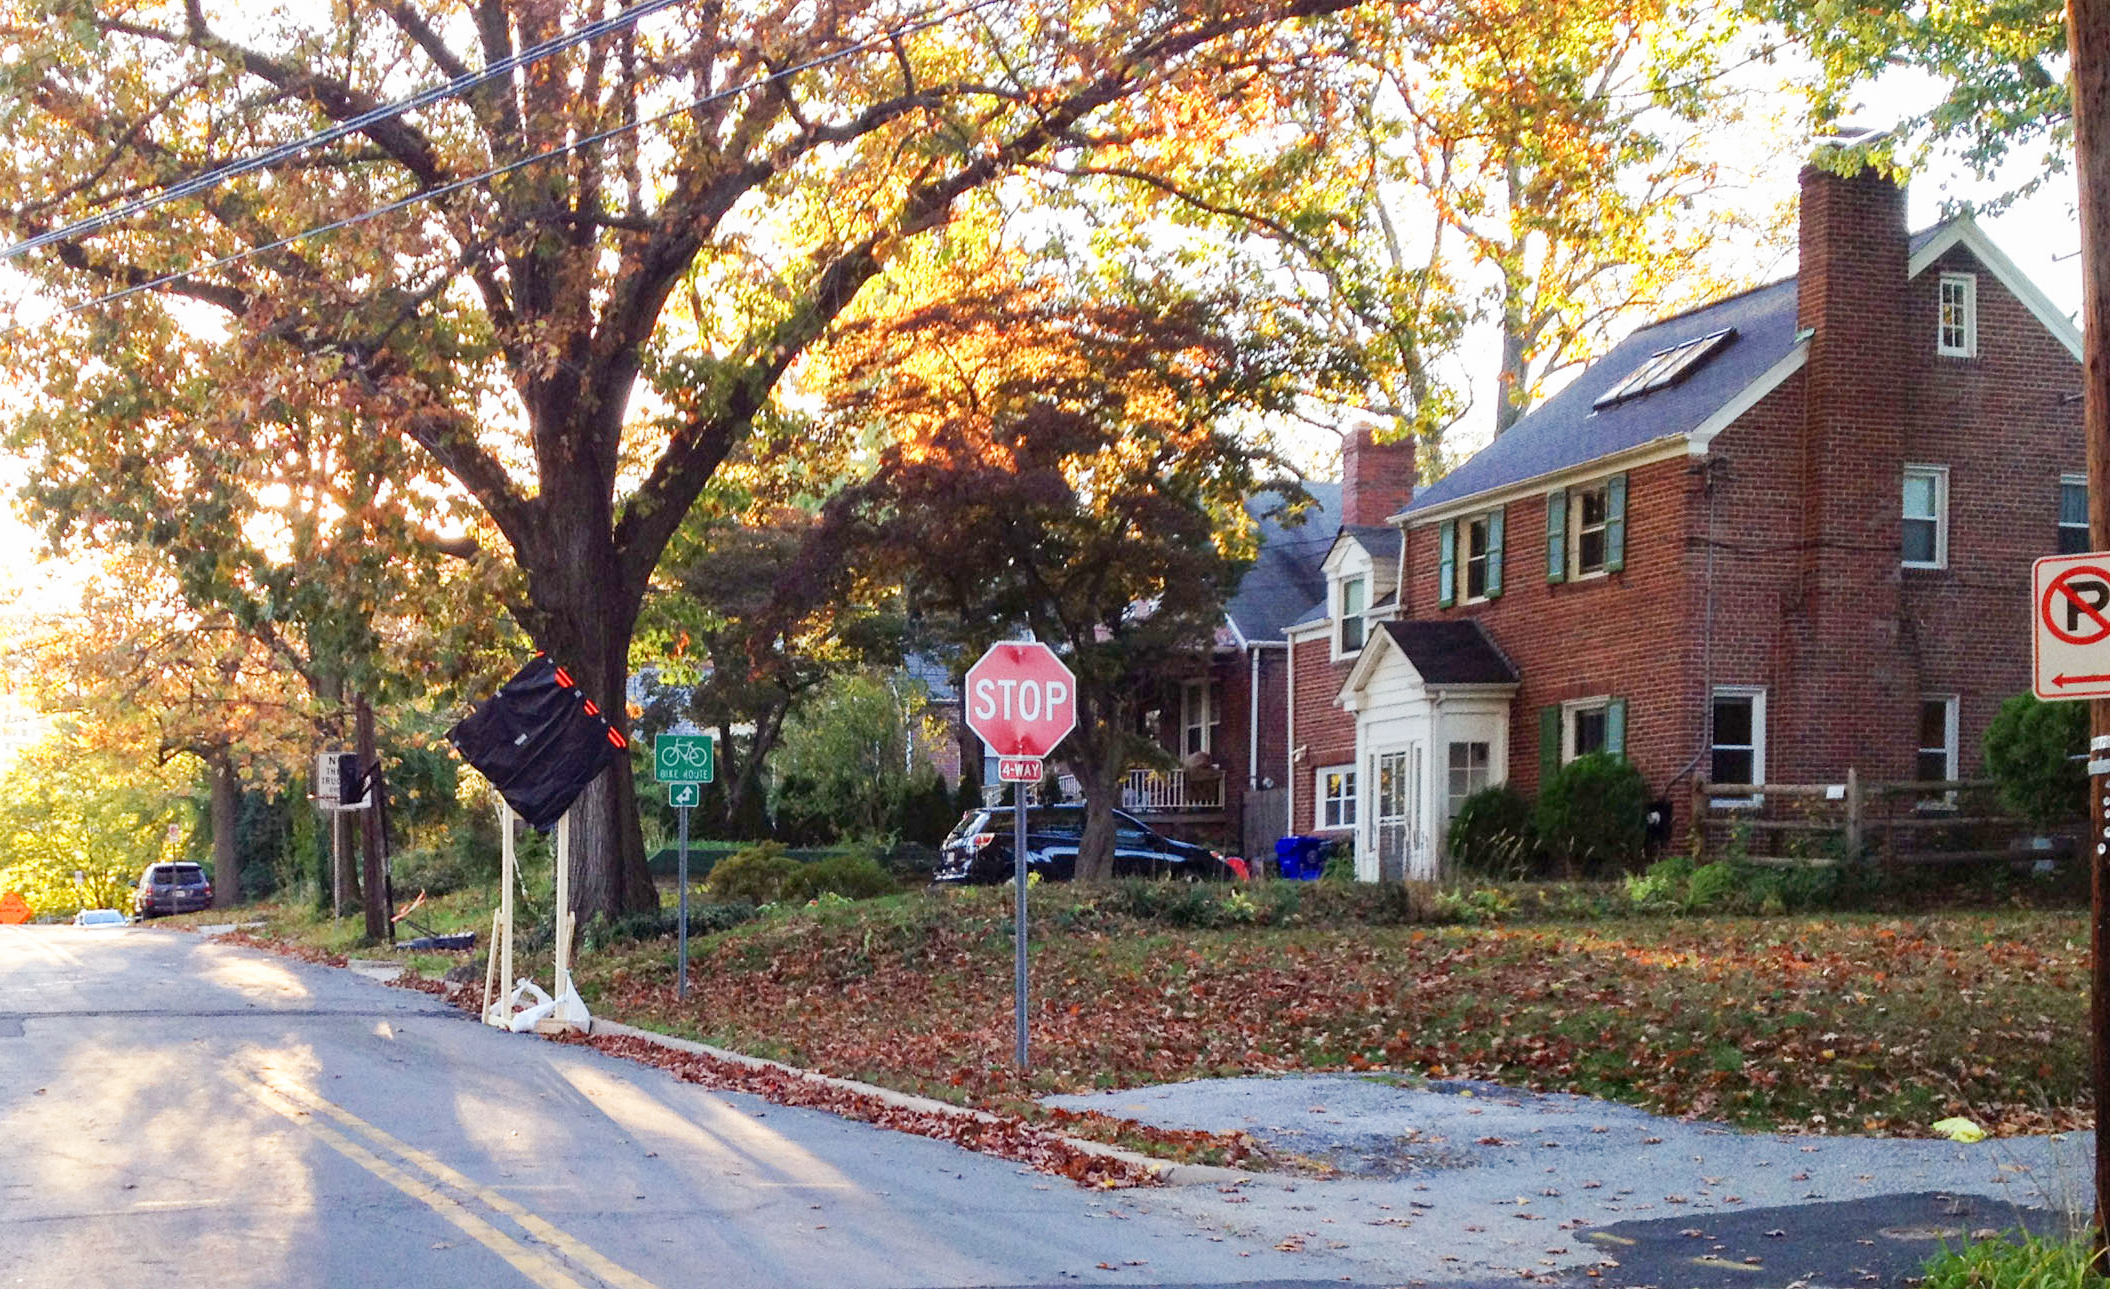
The District of Columbia has gone through transformational changes before, sometimes with good and sometimes with bad outcomes. Urban renewal in the 1950s wiped out all of Southwest’s buildings and displaced 4,500 families. More recent examples include NOMA, which was transformed into a mixed use, high density neighborhood from a wasteland of abandoned warehouses, parking lots, and vacant properties, but is still not particularly welcoming to families. The brutalist pier at the Southwest Waterfront is now the Wharf, breathing life into an underused space, but at the same time, fueling concerns for the future of public housing and low-rent buildings around it. The Navy Yard has been transformed from a defunct shipbuilding and munitions plant to a mixed-use community; Walter Reed from a defunct hospital to a new neighborhood. Proposed developments at McMillan Reservoir, St. Elizabeths, and Poplar Point could have such transformative effects.
So, with so much development already happening, does the District need to change single-family zoning? Yes, if the city wants to become more affordable and inclusive. Data show us that income distribution in the city and racial composition of its neighborhoods closely follow single-family zoning.
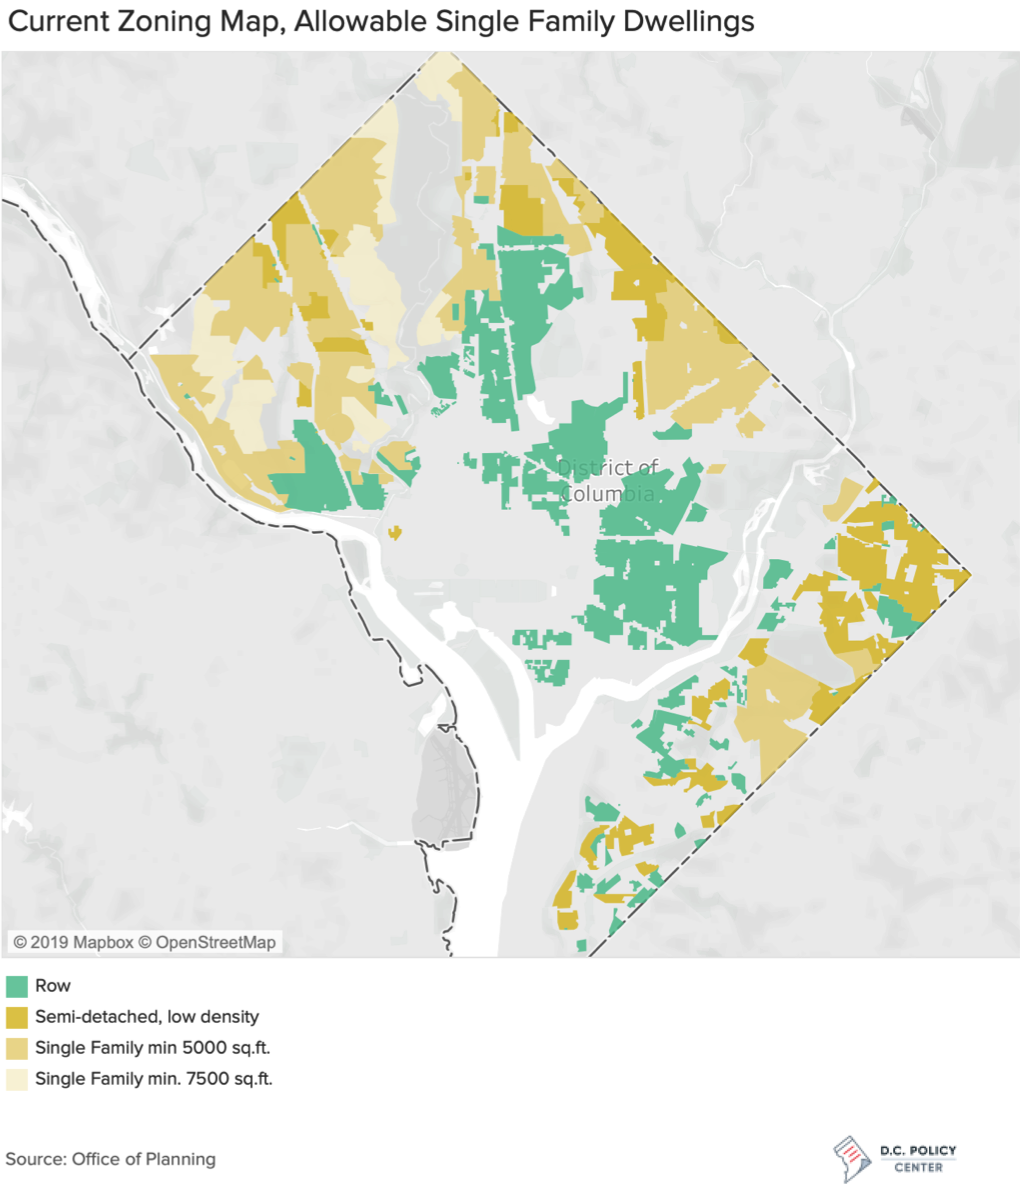
Single-family zoning occupies 75 percent of all tax lots in D.C., and 43 percent of all surface area not owned by the federal government.
Much of the buildable land in the District of Columbia is zoned for residential use, with mixed-use areas along transportation corridors and in special locations (St. Elizabeths, Hill East, Walter Reed, etc.) The map below shows areas zoned for single-family use only. Almost all neighborhoods west of the Rock Creek Park, neighborhoods bordering the park on the east side up to Takoma to the north, and larges section of Wards 4 and 5 are zoned for low-density single-family dwellings on lots that cannot be smaller than 7,500 square feet. Areas zoned for semi-detached homes are scattered across the city, but are especially prominent in Wards 7, 8, 5, and parts of Ward 3. Capitol Hill and neighborhoods surrounding downtown are zoned for denser rowhouses.
When combined together, the land with single-family units add up to 13.2 square miles, or about 20 percent of the District’s entire surface area, 28 percent of all tax lots (46.4 square miles), 48 percent of all lots not occupied by the federal government or held by the National Park Service (30.2 square miles),[1] and 74 percent of all tax lots with residential use including apartments, condos, and cooperatives (17.2 square miles).[2] Single-family units make up only 30 percent of the District’s housing stock, but occupy 80 percent of its residential buildings. Interestingly, while the District has undergone a massive transformation, single-family zoning looks pretty much the same (except for downtown) as it did almost a century ago, when zoning was first adopted in the District.
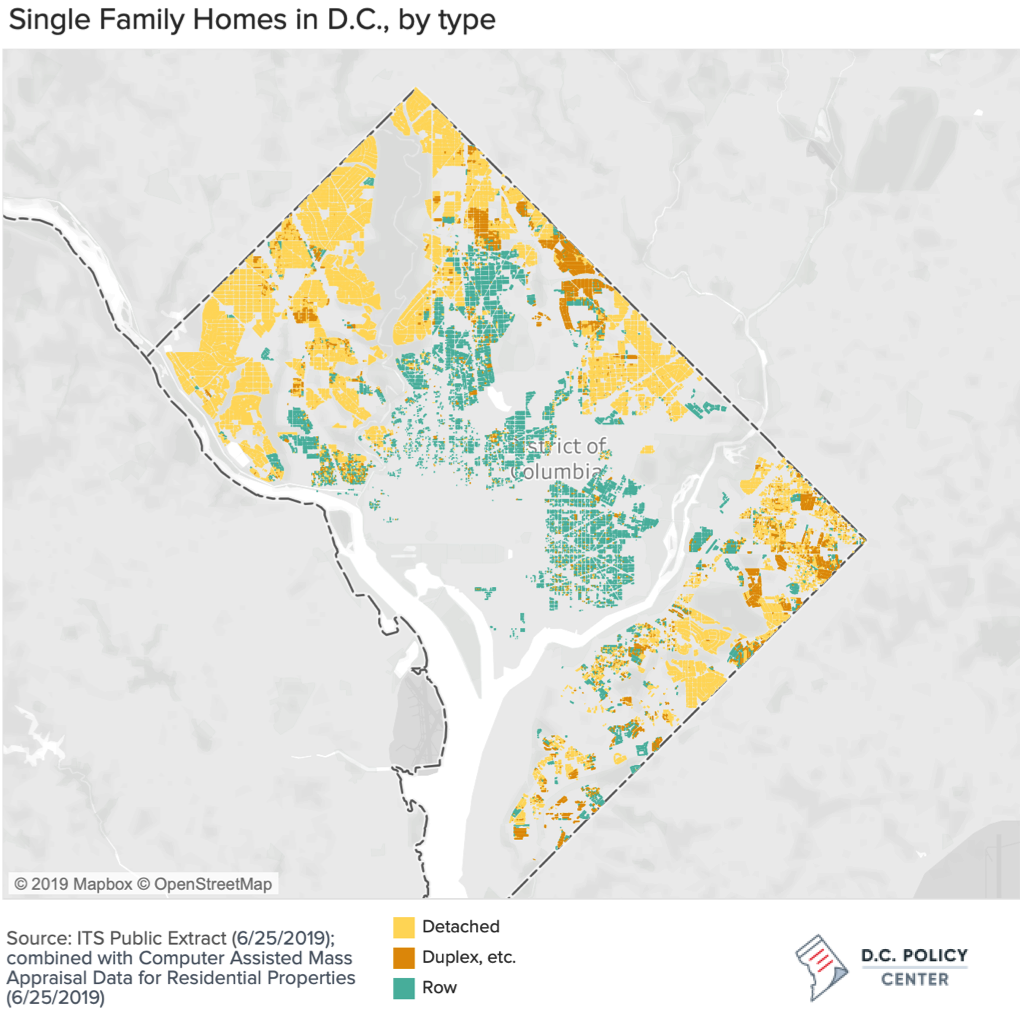
Not surprisingly, the map of single-family homes recorded in the District’s tax database (below) looks exactly like the zoning map.
Density, income, and race distributions across neighborhoods follow single-family zoning patterns.
Zoning shapes much of the demographic and economic characteristics of a neighborhood. Maps of density (both in terms of housing units and population), income, and race mimic the zoning map across much of the city.
The first-order impact of zoning is on how densely we can build housing in a neighborhood. On average there are 8,800 housing units on each square mile of D.C.[3] In tracts zoned for detached single-family units, housing density typically varies between 1,000 to 1,200 units per square mile. In neighborhoods with semi-detached zoning, this goes up to 4,000 to 6,000, and in those zoned for rowhouses—which pack housing units more efficiently—housing density can go up to 11,000 units per square mile. By contrast, in parts of the city where large multi-family buildings (with small units) are the norm, such as NOMA and parts of downtown, housing density is higher by an order of magnitude. Around NOMA, housing density can go as high as 40,000 units per square mile. In neighborhoods north of downtown along the 16th Street corridor, it is common to find 20,000 housing units per square mile.
Accordingly, population density varies across different parts of the city. The District’s population density is approximately 11,200 persons per square mile. In D.C. neighborhoods that are zoned for detached single-family homes, population density hovers around 3,000—similar to the population density of Manassas City. And in neighborhoods that are zoned for rowhouses, population density generally falls between 12,000 (similar to density levels in Seven Corners) and 29,000 (average density across New York City). Again, to compare, in areas with a high concentration of multi-family buildings, population density is typically over 30,000 persons per square mile and can be as high as 66,000 persons per square mile (similar to the densest parts of Paris, which does not have any skyscrapers).
Zoning is also strongly correlated with household incomes, since incomes determine where people can afford to live. Across the city, 23 percent of all households had incomes greater than $150,000 per year (five-year average ending in 2017, expressed in 2017 dollars), but this share can be as high as 60 percent in parts of the city zoned for detached single-family units and much lower in many parts of the city with a concentration multi-family housing. Home ownership is sticky, meaning it tends not to change quickly or frequently, since some households have purchased their homes before values increased rapidly in early 2000s. Yet D.C.’s income map still looks very similar to the zoning map (bottom left panel below).
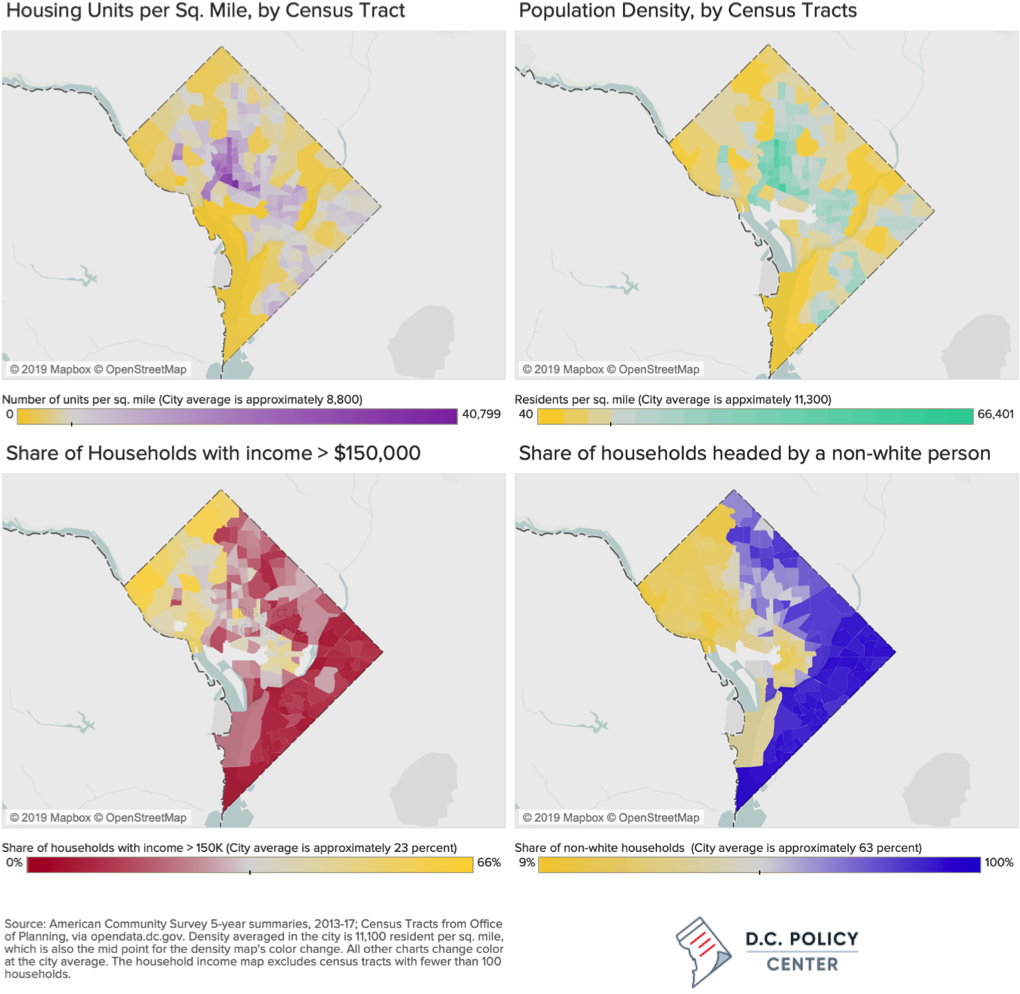
The city’s history is even more strongly expressed in the racial make-up of neighborhoods, but the imprint of zoning is still obvious in the racial map of the city (the bottom right panel). The share of non-white families is significantly lower in parts of the city zoned exclusively for single-family homes, especially west of the Anacostia River.
The District has over 94,000 single-family units, but how these units use land varies greatly across differently zoned areas.
Almost half the single-family units in the District of Columbia—45,800 units—are characterized as rowhouses by tax assessors; another 18 percent (16,650 units) are described as semi-detached (such as duplexes). Together, rowhouses and semi-detached units collectively make up 66 percent of all single-family housing stock in D.C., but occupy 37 percent of land that has single-family units. The 31,673 detached family units are spread over 8.2 square miles—62 percent of all land with single-family units and 18 percent of all taxable lots in the District. The spread of low-density single-family homes is what gives certain parts of the city a suburban feel.
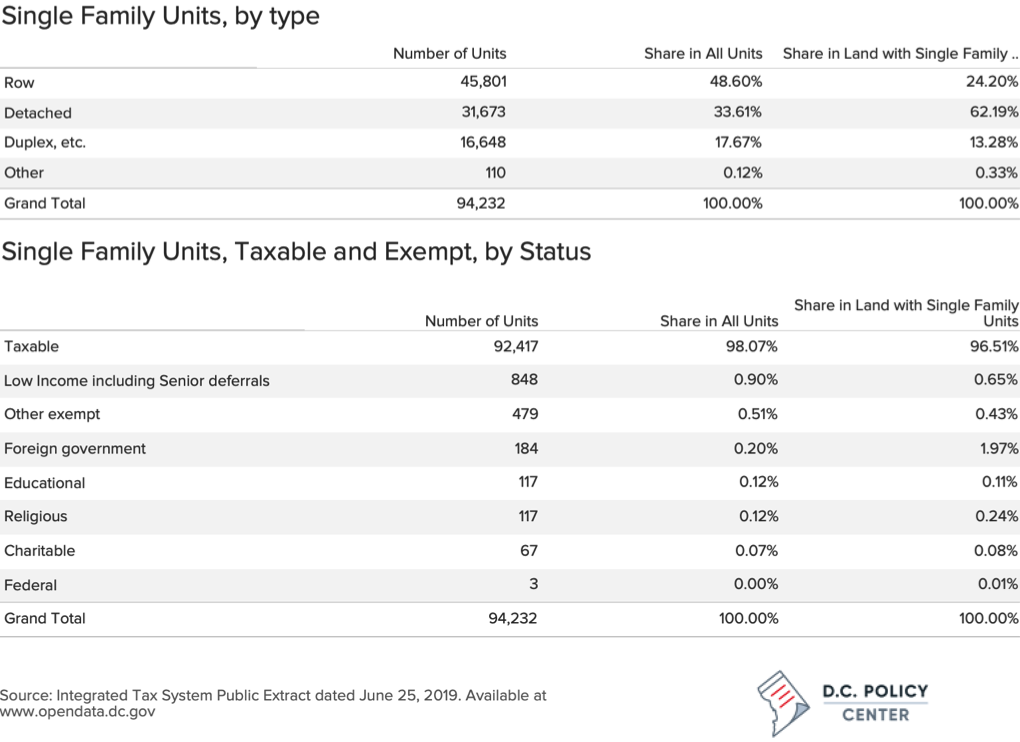
Of D.C.’s roughly 94,200 single-family units, the vast majority—approximately 93,500—are potentially available for residents to buy, sell, or rent, as shown in the table above. The remainder are set aside for special uses, practically removed from the market. These include residential units owned by religious, educational, or otherwise charitable organizations. Tax records show 780 such units, spread through the city, some of them occupying quite large swaths of land. And perhaps unique to the District of Columbia, there is a noticeable number of residential units owned by foreign governments, housing top diplomatic staff. There are 178 such properties, and they make up only 0.2 percent of the single-family housing stock in D.C., but nearly 2 percent of the land occupied by this stock. Some of these units are on lots encompassing over 300,000 square feet, and I found one that is on a lot of nearly 1 million square feet. To put this number in context, you could fit 130 single-family detached homes, 400 semi-detached homes, or over 600 rowhouses in this single lot.
Lot sizes vary greatly across different types of single-family lots. The median lot size for a rowhouse is 1,633 square feet, and 90 percent of rowhouses are built on lots that are smaller than 2,700 square feet. The median lot size for a detached single-family unit is 3.3 times that of a rowhouse (5,460 square feet), and the 90th percentile lot is 9,970 square feet, or nearly four times the 90th percentile lot for a rowhouse.
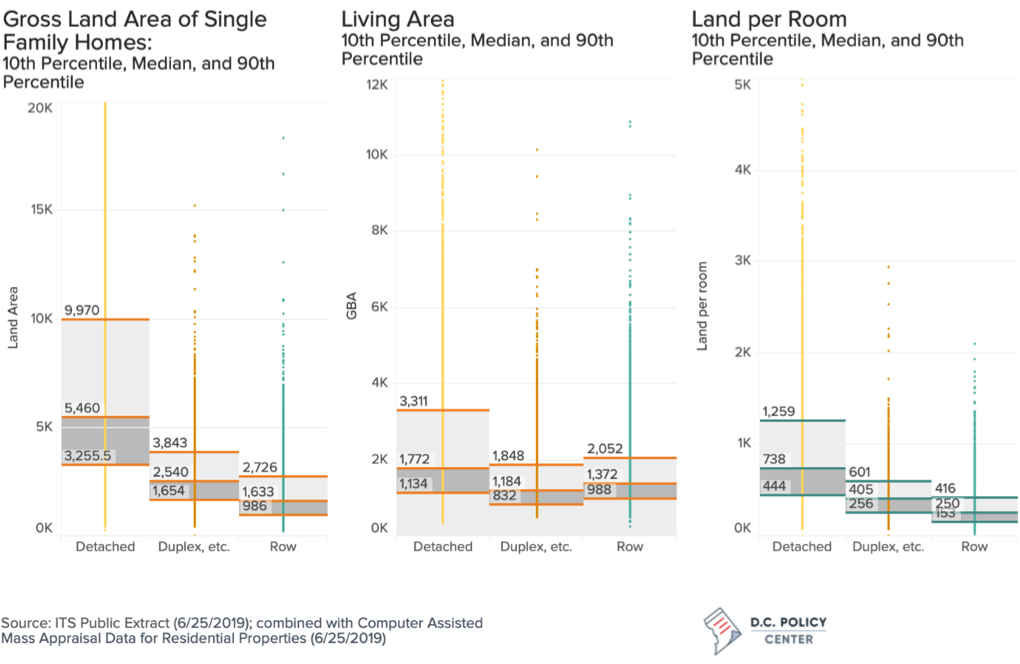
The distribution of living areas in a dwelling (excluding unfinished spaces, basements, porches, garages) is much tighter for detached single-family homes reflecting the smaller land sized combined with land use restrictions.[4] Rowhouses have smaller lots, but larger living areas than semi-detached houses. The median rowhouse has 1,372 square foot of living area, which is 10 percent larger than detached units, and only about 30 percent less than the gross building area of the median detached single-family unit.
Finally, comparing the number of rooms to the total land area shows that each room in the median rowhouse “uses” approximately 250 square feet of land. Semi-detached homes use 450 square feet of land per room and detached single-family homes use 738 square feet of land.
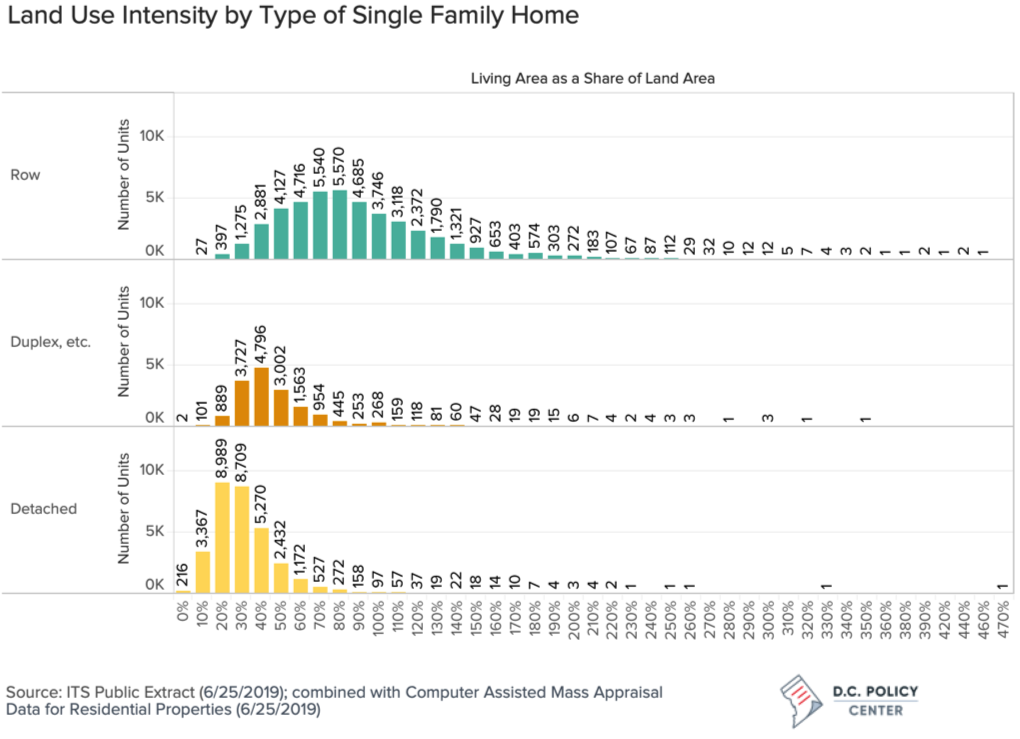
We can also measure the intensity by which a single-family dwelling uses land by comparing its living area to the land area. The median rowhouse has a living area that is approximately 80 percent of the land on which it is built, and more than 90 percent of rowhouses have a living area that is at least half the land size (as shown in the chart below). In contrast, the median detached dwelling has a living area that is only 33 percent of the land on which it is built, and nine out of ten detached single-family units’ living space accounts for less than half the land on which they are built.
Increasing housing supply in the District requires rethinking of single-family zoning.
Last May, Mayor Bowser announced plans for adding 36,000 new housing units over the next six years—roughly a 12 percent increase over the current housing stock. The key question is where and how these units would be built. The District has increased its housing stock considerably since 2006, but new units are generally built in areas outside of single-family zones. Continuing to build in these areas will do little to reverse the economic and racial segregation patterns in the city.
In terms of how, while subsidies from the Housing Production Trust Fund and other government supports can help build more housing, subsidized housing alone will not solve the affordability problem. The District already took a step towards densification by allowing accessory dwelling units (ADUs), which are secondary apartments built on single-family lots in backyards, over garages, and so forth. But adding new housing units through market forces—the most straightforward means of increasing the District’s overall housing stock—would require less restrictive zoning.
During its first vote for the Framing Element of the Comprehensive Plan on July 9, the Council asserted that community benefits packages associated with PUD-related zoning changes must prioritize affordable housing and racial equity. This may seem like important policy change, but on its own, it will have little impact on affordability or segregation. If creating affordable housing and reversing practices that amplify racial inequities are truly concerns for the city, legislators should focus on reforming the entire zoning code—and especially zoning for single-family units—and not base such important policy on ad hoc changes.
Finally, even small increases in allowable density in single-family zones could have significant impacts. Population density in single-family zones can be as low as a couple thousand people and barely a thousand housing units per square mile in neighborhoods zoned for detached single-family homes. In contrast, where zoning allows for tightly packed rowhouses, population density can go as high as 25,000 persons per square feet, with up to 11,000 units packed in a square mile, without offending the traditionalist eye.