Recently, many people were surprised that much of the “small business relief” in the federal CARES Act was received by large publicly owned companies. While later guidance from the U.S. Treasury clarified that these types of businesses were not the intended target of the program, and many national chains have returned their funds, the situation highlights how official definitions of what is considered a “small business” can vary by situation, and often diverge significantly from what residents, policymakers, and businesses themselves may consider to be “small.”
So what is considered a “small” business? There are a few different ways to think about that question. One of the most common—and straightforward—ways to define a small business is by the number of employees it has. The federal Small Business Administration (SBA) typically defines a “small business” as one with fewer than 500 employees, a broad definition that includes 99.9 percent of businesses in the U.S. The SBA also offers an industry-specific table of size standards for different types of businesses, which sometimes include even higher thresholds: For businesses dealing in furniture wholesale, those considered as small businesses have fewer than 100 employees, but for businesses that manufacture small electrical appliances, the maximum employment size to be considered a small business is 1,500 employees.
Another way to define a small business is by revenue, especially when looking at businesses within specific industries, generally those that are non-manufacturing, where the ratio of employees to revenue is particularly low (such as administrative and support services) or particularly high (such as agriculture). The SBA also has revenue thresholds that can be used to define “small businesses” within their industries, which can be relevant for which small businesses qualify for federal contracts. However, from a data perspective, obtaining up-to-date detailed data on firms by revenue is often more difficult than obtaining data on the number of employees. Overall, defining business size by the number of employees remains the more typical approach, especially when looking at businesses across industries.
The picture of the small business landscape in the District of Columbia varies significantly by how “small business” is defined, as well as which data source is used. These conflicting definitions and data sources can create a lot of uncertainty, and can make it difficult for policymakers to properly target supports and resources for small businesses. This article examines four different sources of data (Quarterly Census of Employment and Wages; Statistics of U.S. Businesses; Non-employer Statistics; and the National Establishments Time Series Database) that provide information about small businesses. Focusing on the number of employees, we will also parse out the data using three thresholds of businesses sizes (up to 500, 100, and 50 employees) to gain a better understanding of the small business landscape in D.C.
I. Bureau of Labor Statistics, Quarterly Census of Employment and Wages (QCEW)
About the data
The Quarterly Census of Employment and Wages (QCEW) program from the U.S. Bureau of Labor Statistics publishes quarterly data on employment, wages, and establishments by industry groups and business size. We are using 2019 first quarter data as it is the most recent dataset which provides this information at a firm size level. QCEW is administrative data, as it reflects the information reported by employers for the purposes of administering Unemployment Insurance Benefits. For this reason, it does not run into sampling error problems we find in data sources that rely on business surveys.
Limitations: The QCEW does not report on self-employed, railroad and certain farm, domestic and non-profit, and military workers, and only reports size information at an establishment level and not at a firm level. QCEW establishment estimates generally tend to be greater than the establishment counts we find in other sources.
Findings
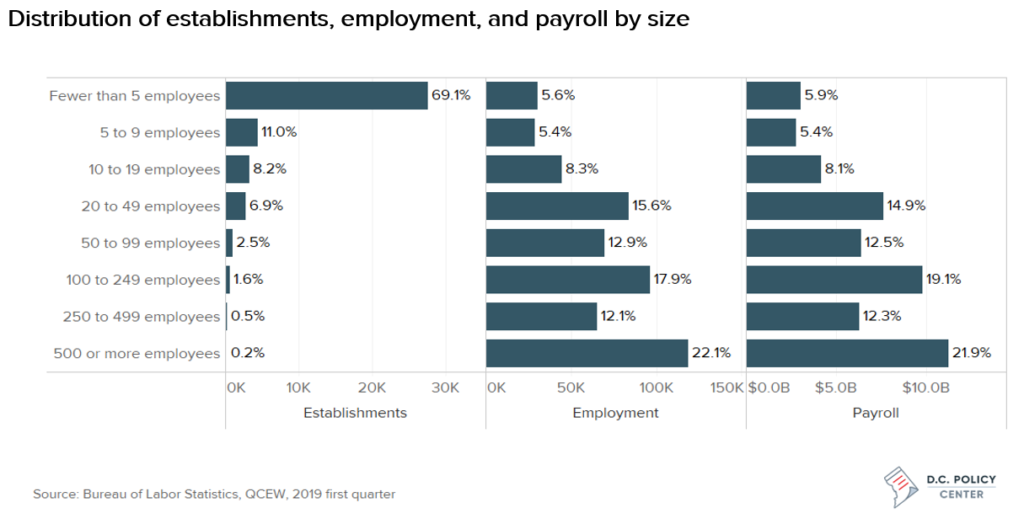
According to QCEW estimates, during the first quarter of 2019, there were 39,903 establishments in the District that reported their employment and wages information. These establishments collectively employed 537,813 workers and payed around $51 billion in annual wages. While very large businesses (those with at least 500 employees) employ the largest share (22.1 percent) of workers in D.C., most businesses (69.1 percent) have fewer than 5 employees.
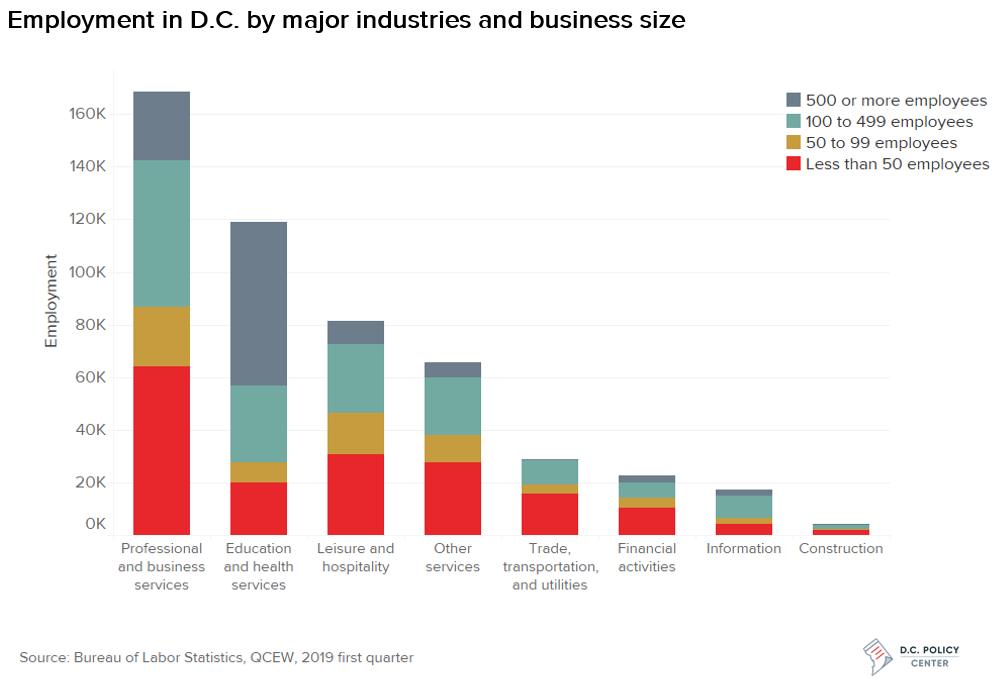
The top industry in D.C. by employment is Professional and Business Services, with 33.1 percent of the workforce, followed by Education and Health Services, which employs 23.4 percent of the workforce, respectively. Small businesses employment is concentrated in the Professional and Business Services and Leisure and Hospitality industries. Some 55.9 percent of those who work in professional and business services are employed at businesses with fewer than 100 employees, but this industry also reports a significant number of employees (30.6 percent) who work at businesses with an employment size between 100 and 499.
The smallest businesses—those with fewer than 50 workers—employ almost 60 percent of employees in retail trade, 47.4 percent of employees in accommodation and food services, and 42 percent of employees in arts and entertainment work.
Across the three separate size thresholds we have used, the share of small businesses in the District’s total establishments vary only slightly due to the large concentration of establishments with fewer than 5 employees, although the distribution by employment can change substantially. Here’s how the distribution of establishments and employment in D.C. vary when we use different definitions of what is considered a “small business”:
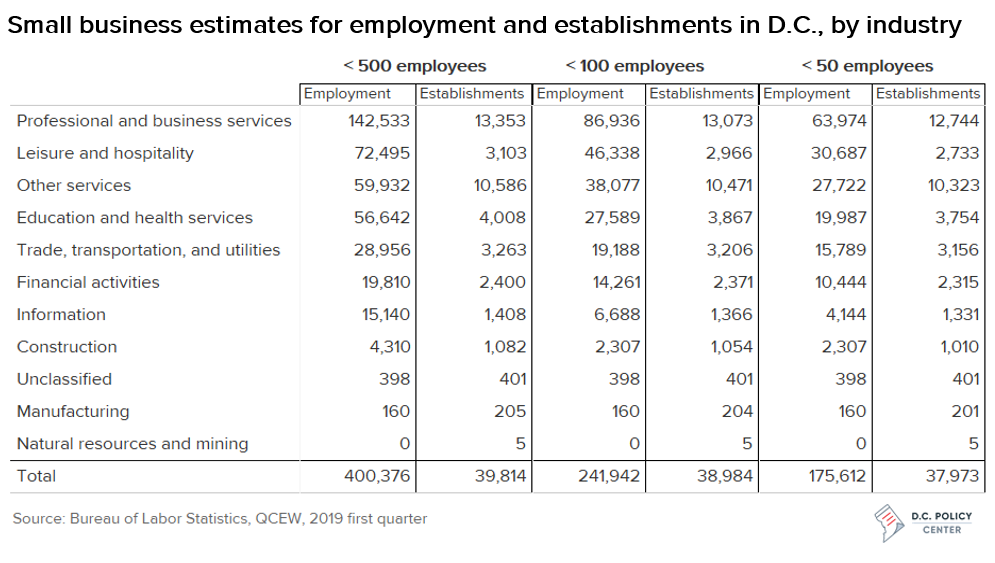
- Fewer than 500 employees: According to this measure, there are 39,809 establishments with fewer than 500 employees. Businesses of this size constitute 99.8 percent of the total number of establishments in the District, and employ 74.4 percent of the total workforce.
- Fewer than 100 employees: Limiting the size standard to establishments with fewer than 100 employees, there are 38,984 small businesses of this size in the District. While still accounting for 97.8 percent of all establishments, the employment share falls to 44.9 percent of the workforce. The employment variation is largely due to the Healthcare and Educational Service industries, which typically consist of establishments with an employment of over 100.
- Fewer than 50 employees: Further restricting the size threshold to an employment of less than 50, the total number of small business of this size in D.C. is 37,973. Businesses with fewer than 50 employees make up 95.2 percent of establishments in D.C., and employ about a third (32.7 percent) of workers.
II. Census: Statistics of U.S. Businesses (SUSB) and Non-employer Statistics (NES)
About the data
The U.S. Census Bureau’s Statistics of U.S. Businesses (SUSB) provides annual national and state level economic data on number of firms, establishments, and employees, by industry classification and employment size. The Census Bureau’s Non-Employer Statistics (NES) covers data for businesses that have no paid employees. The majority of non-employers are self-employed individuals running unincorporated businesses and constitute the largest share of all business establishments in the country. Since SUSB does not provide non-employer information, we are using the two datasets in conjunction, joining them by industry classifications. The most recent data available is for 2017.
Limitations: While there is not a great difference between SUSB and QCEW in terms of employment, the number of establishments reported in SUSB is below that of QCEW by 16,410, even though they have similar coverage. These differences are more prominent for establishments with fewer than 5 or over 500 employees.
Findings
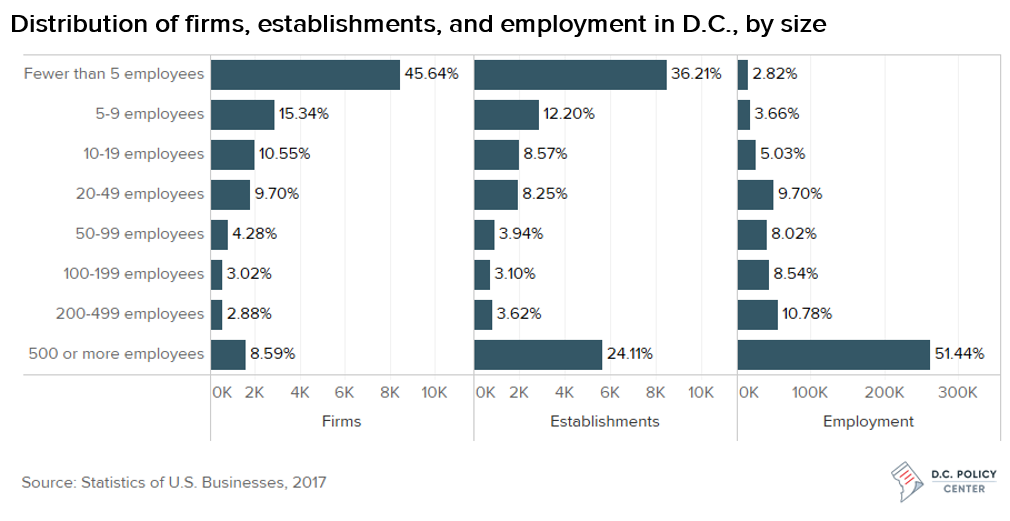
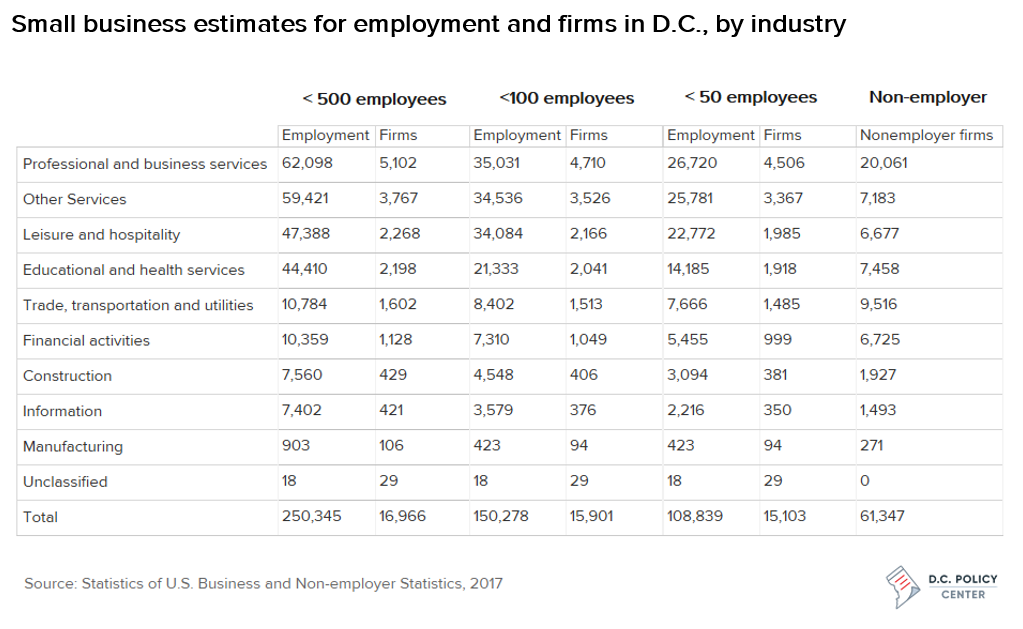
According to SUSB estimates, in 2017 the District had 527,004 workers, 18,675 firms, 23,582 establishments, and an additional 61,347 non-employer businesses. Although 45.6 percent of the District’s firms employed fewer than 5 employees, larger firms with an employment size over 500 employed 51.4 percent of the workforce.
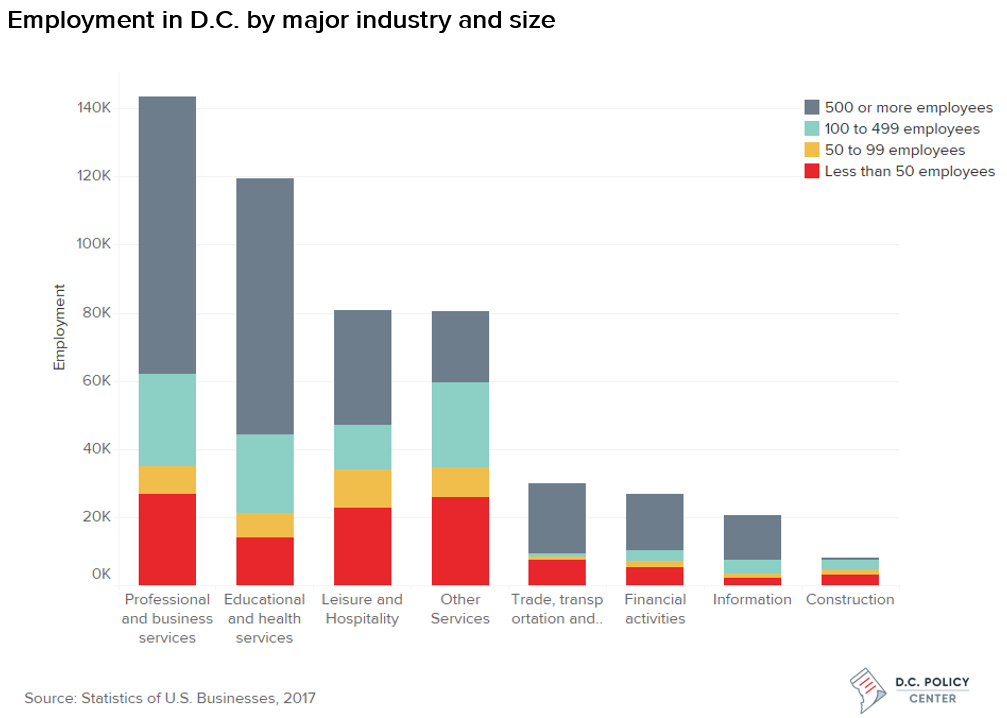
The employment by industry trend mirrors that of QCEW, with professional and business services and educational and health services being the top industries by employment. However, small businesses are typically concentrated in professional and business services, and other services (this sector includes repair and maintenance, personal services religious/civic/professional organizations, and private households). SUSB estimates show higher concentrations in larger establishments (employment over 500) across all major industries.
Due to the large number of smaller and non-employer businesses, the share of small businesses in the District’s totals vary only between 95.9 percent and 98.2 percent across the three size thresholds. The employment shares are more distinct – businesses with fewer than 500 employees account for 47.5 percent of the workforce, those with fewer than 100 employees account for 28.5 percent, and those with fewer than 50 employees account for only 20.7 percent.
The distribution of small businesses employment by industries also fluctuates among the three size standards. Within professional and business services, 24.4 percent work at establishments with fewer than 100 employees, while 18.8 percent of employees work at businesses with an employment size between 100 and 499. The education and health services, other services, and leisure and hospitality industries follow a similar pattern, which is mainly why these estimates differ largely between the three size thresholds.
III. National Establishment Time Series database (NETS)
About the data
The National Establishments Time Series (NETS) database is a time series constructed by stitching together proprietary data collected by the Dun & Bradstreet Corporation, a business data and analytics company. The NETS database provides establishment-level longitudinal microdata, which covers various business dynamics such as annual employment and sales, headquarter linkages, and related establishments. NETS also provides information on female and minority ownership, age of establishments, and location coordinates, which is the primary use of the data for this analysis. More information on the NETS database and how it compares to administrative data can be found here. The most recent year for which NETS is available is 2017.
Limitations: Dunn and Bradstreet data are self-reported. One characteristic to note is that NETS significantly overrepresents establishments with fewer than 5 employees relative to administrative data, and includes firms of national chains (for instance, Apple stores). For this analysis, we have corrected for as many of such instances as possible by hand, and have also excluded public administration, K-12 education, and universities.
Findings
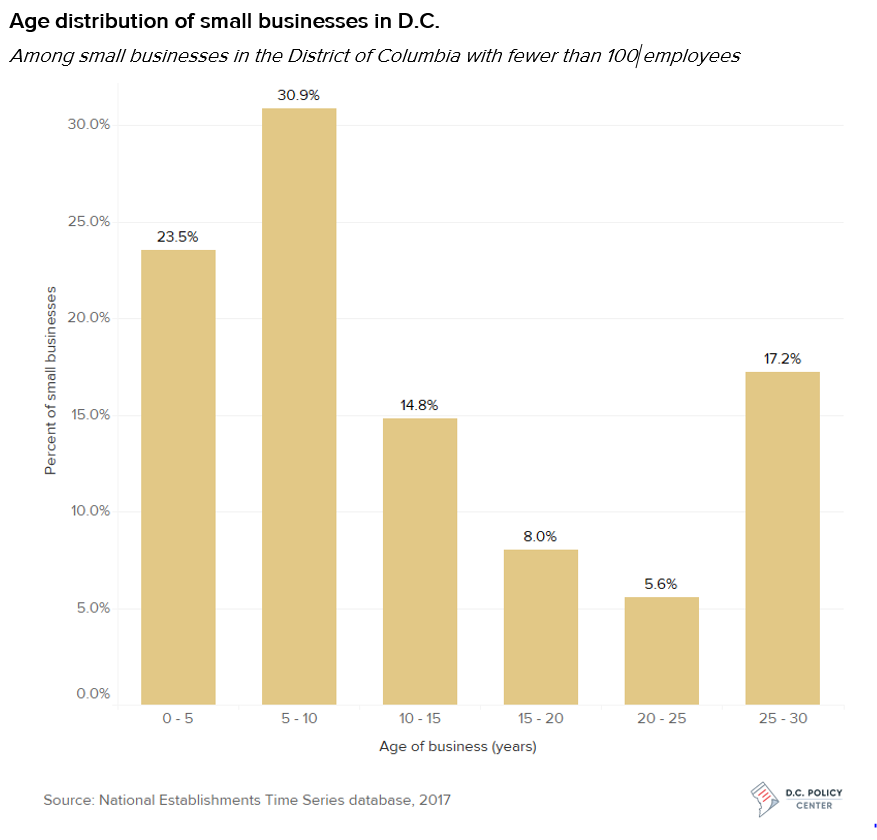
According to NETS data, the ownership structure, age, and the geographical distribution of small businesses in the Districts stays virtually unchanged across all three size standards. For purposes of the summaries in this section, we will define small businesses as those with fewer than 100 employees, and exclude, where possible, national chains, public administration, K-12 education, and universities.
Women-owned businesses account for around 11.5 percent of all small businesses in the District with fewer than employees, and minority-owned businesses account for only 9.9 percent. In terms of business age, more than 50 percent of current small businesses in the District have been active for 10 years or less, with the median age being 8 years, and the average age being around 12 years. However, most small business employment is from older firms, and small businesses over 25 years old account for around 30 percent of employment.
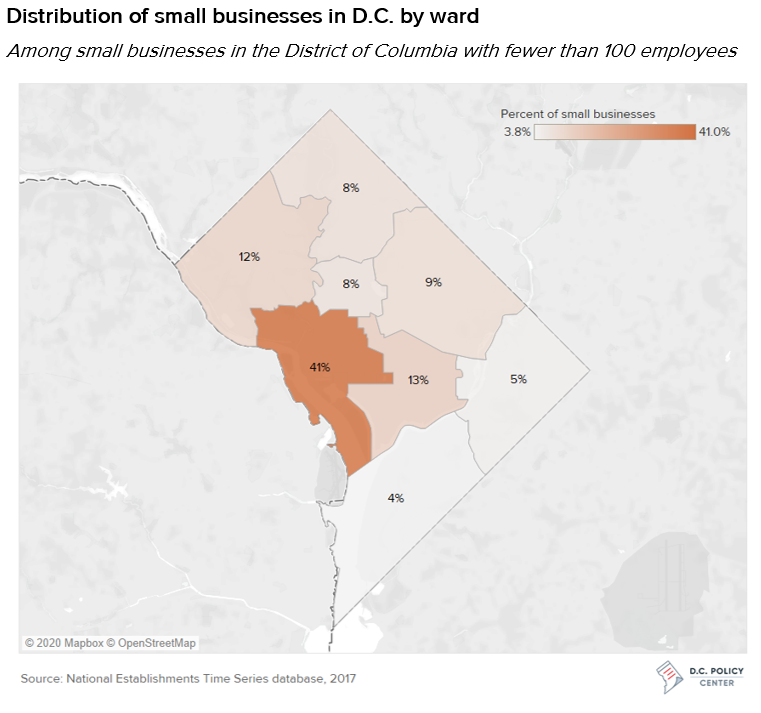
Geographically, most establishments in D.C.—of any size—are located in Wards 2, 6, and 3. Likewise, small businesses are most concentrated in Ward 2 (41 percent), followed by Ward 6 (13.4 percent), and Ward 3 (11.7 percent).
Sunaina Kathpalia is a Research Assistant at the D.C. Policy Center.