The District’s strategy for targeting industries, and the dollar value of incentives offered, is unique when compared to the tax incentive strategies of neighboring Baltimore, Maryland and Virginia Beach, Virginia, as well as other large cities around the country.
The District’s incentive-granting strategy relies primarily on local property tax abatements. Since D.C. is a local and state level government combined, its more frequent use of property tax abatements—which is a function of local tax authority—is not surprising. However, the paucity of other types of incentives in the District that are common elsewhere across the country warrants future study to determine the most effective incentive-granting strategy.
Further analysis reveals a lack of coherent targeting strategy in the ways the District uses tax incentives. Research suggests that tax incentives would be more efficient and effective if tax abatements more strategically targeted export-based industries—or sectors of the D.C. economy that primarily cater to tourists, commuters, and or sends products to those outside of the District.
Section 1. Introduction
Tax incentives have recently endured public scrutiny as a tool for economic growth. In 2017, Amazon announced its plans to open a second headquarters, invest $5 billion, and create 50,000 high-paying jobs at a location that can provide sufficient inducements. Larry Hogan, the governor of Maryland, touted Amazon HQ2 as “… the single greatest economic development opportunity in a generation.”
Across the country, 238 cities and localities including Maryland, Virginia, and the District of Columbia submitted bids offering billions in tax incentives. The District offered a standard tax incentive package, which was, at the time, offered to all high technology companies and could have been worth somewhere between $0.5 billion to $1 billion;[1] Maryland offered the largest incentive package in the nation amounting to $8.5 billion; the Commonwealth of Virginia offered $573 million in performance-based incentives.[2] All three jurisdictions qualified as finalists but ultimately, Amazon chose Virginia’s National Landing site.
Good Jobs First, a non-partisan organization that tracks state and local tax incentives (along with other subsidies), reports that Amazon and its subsidiaries have received nearly $3 billion in incentives for its warehouses, data centers, and film productions.
Tax incentives are very common
Because of its massive scale, the Amazon HQ2 bid is one of the most well-known examples of states using substantial tax incentives to lure relocating companies. But it is just one such instance among thousands.[3]
In the last two decades, incentive amounts paid have tripled, adding up to $50 billion in state budgets annually.[4] To compare, in 2018, all state and local government combined collected $56 billion in corporate income taxes.[5]
States, faced with large budget shortfalls, have come under tremendous pressure to create jobs and strengthen their economies and have turned to business incentives as a policy tool. Today, virtually every state has at least one type of tax-incentive program in place to influence firm expansion, relocation, and startup decisions. Yet, the effectiveness of incentives remains highly disputed. Critics question the government’s ability to pick the right winners and dismiss incentives as a wasteful redistribution of taxpayers’ money to large businesses. Those who favor incentives argue that targeting expansion and relocation of large firms is the best use of public resources. The justification is that large firms are not only the most productive and able to create high-paying jobs, but that over time, they also generate higher tax revenues for local governments.
One major analysis on incentives in the United States, conducted in 2012 by the Pew Center on the States, finds that at least half of states included in the study have introduced incentives without conducting rigorous program evaluations for accountability. Thirteen states (characterized as “Leading the way” in the report) were using program evaluations to measure the effectiveness of state business incentives. Twelve states (“Mixed results”) had mixed results and the other 25 states, including Washington, D.C., (“Trailing behind”) lacked evaluation criteria to measure scope or quality of incentives. However, according the study, “No state regularly and rigorously tests whether [their incentives] are working and ensures lawmakers consider this information when deciding whether to use them, how much to spend, and who should get them.”
Until recently, rigorous program evaluations were sparse among researchers and state agencies due to lack of available data and methodological issues, despite being necessary to inform lawmakers and improve policy choices. While Pew Charitable Trusts notes in a follow up study that 27 states and the District of Columbia have made progress in gathering evidence on the outcomes of tax incentives, additional research and evaluation can strengthen policy decisions. When properly reviewed and the key results integrated into policy deliberations, tax incentives can be an effective engine of job growth in the short-term, but more importantly, of economic growth in the long-term.
States – even those that share a border – have adopted vastly different incentive-granting strategies.
Some of key differences include what type of incentives are offered, how much are offered, and what sectors are targeted. In this sense, incentives provide a useful context for understanding a state’s economic development strategy. Often researchers will analyze outcomes of competing business incentives at inter-state borders to determine whether the use of incentives is beneficial, or if instead they lead to wasteful competition as companies pit one jurisdiction against another to maximize their “relocation” benefits at the expense of taxpayers. The textbook example of wasteful competition is the border war between Kansas and Missouri, which resulted in approximately 10,000 jobs moving between two states at an incentive cost of $330 million, for a net gain to Kansas of only 1,200 jobs.
But is this a universal story? And is this the case in our region? Are incentives purely creating handouts to companies without generating the hoped-for positive employment and economic benefits? To assess this, I study the Washington D.C. metropolitan area and describe how three adjacent jurisdictions took three different economic development incentives strategies. Specifically, I evaluate tax incentives in the District and compare them to the incentives offered in adjacent jurisdictions in Maryland and Virginia; specifically, Maryland’s largest city, Baltimore, and Virginia’s largest city, Virginia Beach, as well as the national average. I compare and contrast incentives offered by type, amount, and sector.
The main findings from this analysis are the following:
- The District’s incentive-granting strategy relies primarily on property tax abatements. By comparison, Baltimore relies on job creation tax credits and research & development tax credits. Virginia relies on job creation tax credits and customized job training subsidies. The remarkable similarity in industry-targeting of job creation tax credit policies in Maryland and Virginia provide suggestive evidence of competitive behavior.
- In the District, taxes and tax incentives are positively correlated, meaning that industries with high tax rates get high tax incentives. By contrast, in Baltimore and Virginia Beach, taxes and tax incentives are negatively correlated, meaning that industries with low tax rates get high tax incentives. This suggests that unlike in the District, these two cities use tax rates and tax incentives together to make strategically important industries more appealing to businesses.
- The District offers some of the nation’s highest tax incentives when measured as a share of the industry value-added. For example, the District’s industry with highest incentives receives tax incentives that are nearly 10 times higher than industries with highest tax incentives in Baltimore or Virginia Beach. Its tax rates are similar to the national average. Therefore, tax incentive recipients benefit from tax rates below national averages.
- The District appears to lack a coherent incentive-granting strategy. Many non-export based industries are given some of the highest tax incentives while some export-based industries are given some of the lowest tax incentives.
Section 2: What are tax incentives for economic development?
Incentives are “tax breaks, cash grants, loans, or services” that target individual firms or industries with the objective of promoting job growth. Timothy Bartik, economist at W.E. Upjohn Institute and the foremost expert on the topic, classifies incentives into five broad types: property tax abatements, investment tax credits, job creation tax credits, R&D tax credits, and customized job training subsidies.
The primary objective of incentives is to promote local investment and hiring. Following the Great Recession, states have become hard-pressed to create jobs, protect jobs, and reduce unemployment rates. Many have turned to tax incentives to accomplish these goals. These pressures are only amplified by the pandemic-induced economic recession.
The primary target of incentives is the relocation and expansion of large firms.[1] Incentives target large firms for their ability to both create many high-paying jobs and make significant capital investments.
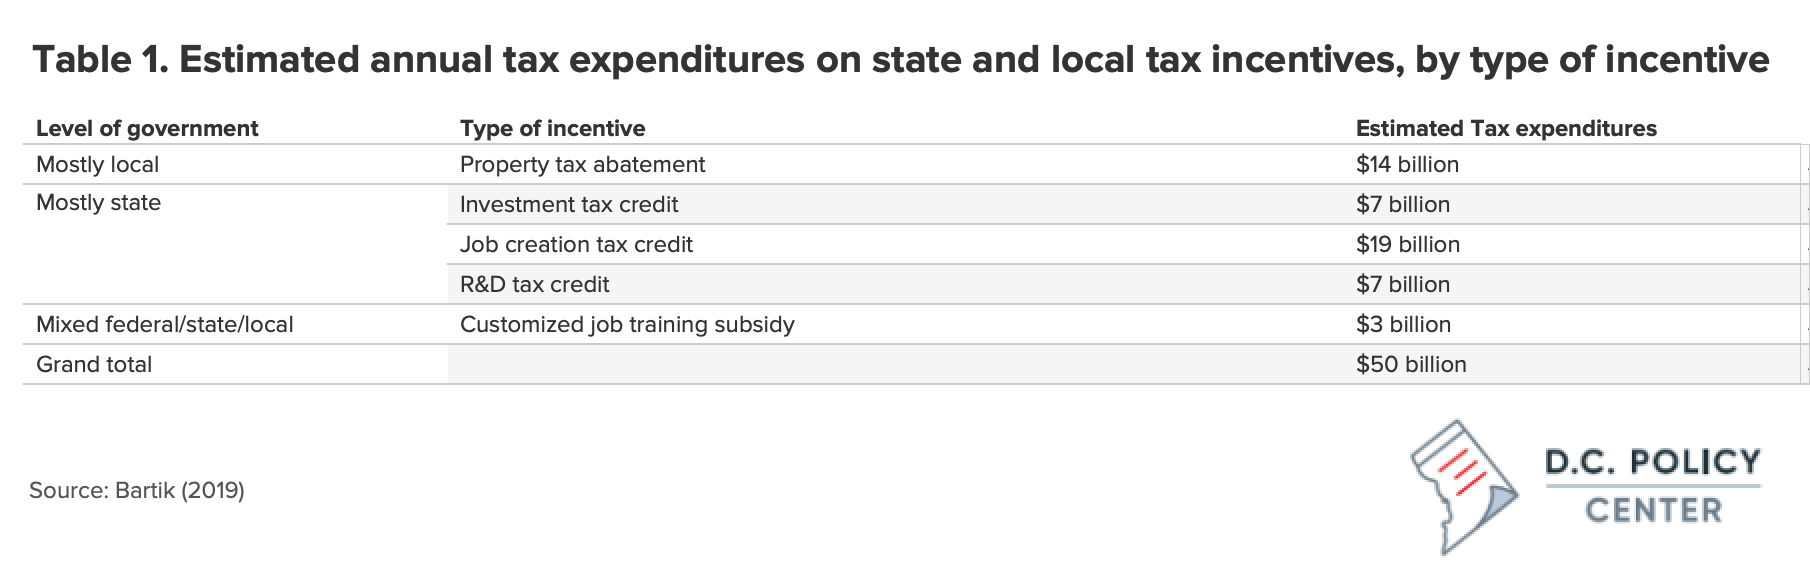
Business incentives offered by state and local governments are substantial at around $50 billion annually for export-based industries (See Table 1). This amounts to about 1.4 percent of all industry value-added—how much that industry contributes to the GDP—and about 30 percent of the average state and local tax liability to businesses (Bartik 2017). These numbers are also comparable to state corporate income tax revenue, which was $45 billion in 2013.
Who gets tax incentives?
Incentives go to firms in virtually every industry both large and small, profitable and unprofitable, domestic and foreign. The largest incentive deals nationally are found in the manufacturing sector, oil and coal conglomerates, technology and entertainment companies, and banks and retail chains. Research suggests that states can get the best “return on investment” by targeting export-based industries. This is because export-based industries have the highest employment multiplier effect.[2]
What is an Employment Multiplier effect?
The employment multiplier is one type of measure used to determine the impact a particular industry will have on the local economy upon its arrival or departure. It estimates the total jobs generated as a result of one job in that industry. According to Upjohn Institute’s estimates, high-tech sectors is believed to have highest multipliers, as high as 2.9. That is, for each new high-tech job in a city, 2.9 additional jobs are created (e.g., lawyers, teachers, nurses, waiters, hairdressers).
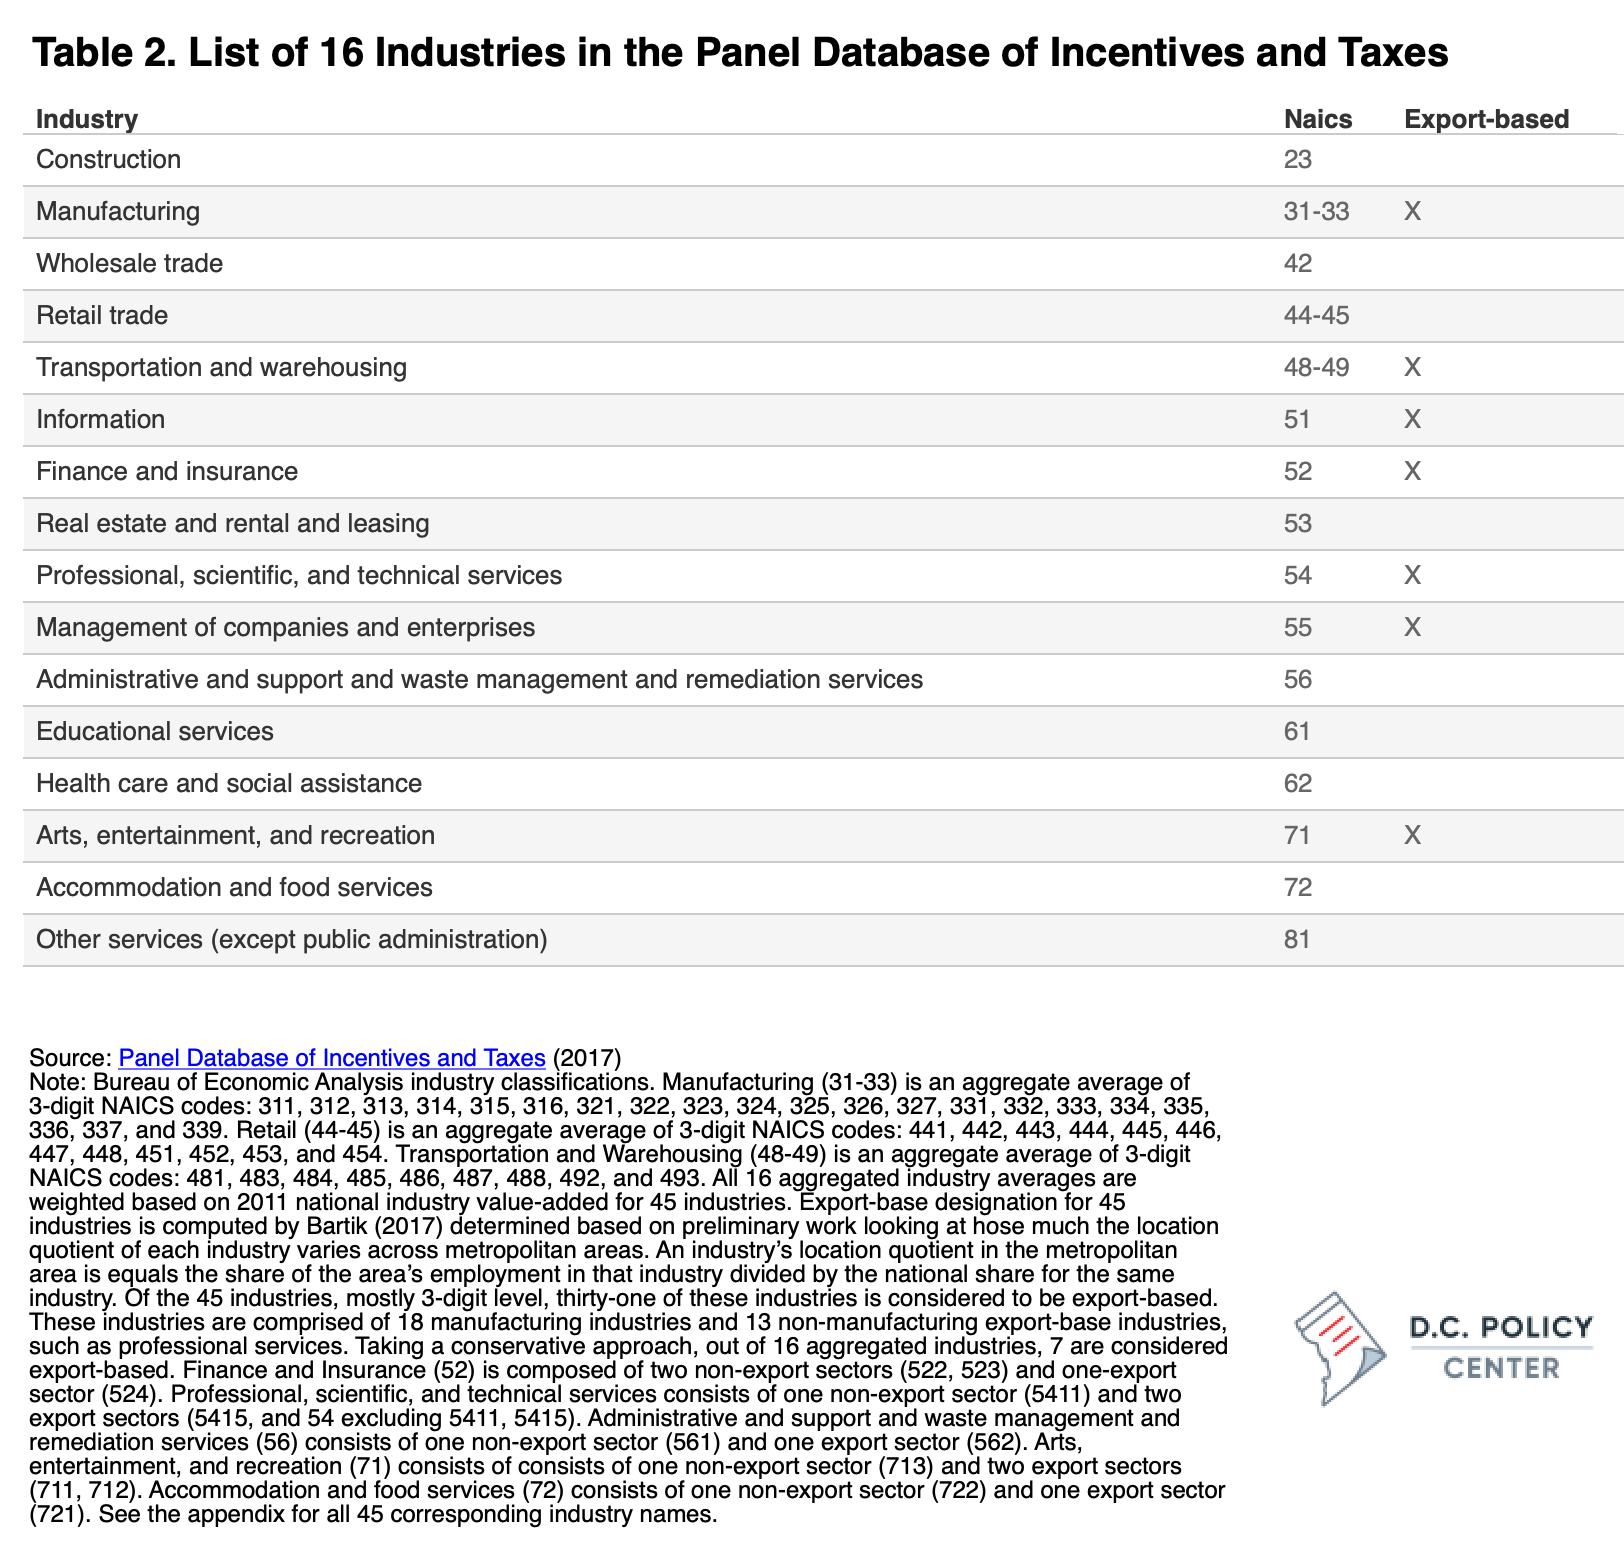
When studying tax incentives, economists like to distinguish between export-based industries and non-export industries. An export-based industry refers to a sector in which goods and services produced locally are “exported” (not necessarily to other countries but other areas) and consumed outside the local economy. For example, publishing (which falls under the “Information” classification) is generally considered export-based: almost all the work that goes towards producing Washington Post happens in D.C., but readership is spread across nation. In contrast, real estate is generally considered non-export-based since almost all the work done by realtors is consumed by D.C. residents. (See Table 2).
Research suggests that targeting export-based industries is the most effective incentive-granting strategy. These industries are more likely to create many jobs in the local economy. Giving incentives to non-export industries is likely to displace jobs at existing local non-export industries. Consider that a large retailer, like Walmart, offers to invest in the local economy and hire workers in return for state business incentives. Walmart is in the retail industry, which is a non-export sector with low multiplier effect. If Walmart enters the local market and creates 500 jobs but wipes out 600 jobs in local grocery businesses – the result will be a net decline in 100 jobs, a displacement effect. Given that tax incentives are large, it is likely that the retailer’s long-run tax contribution to the state will be less than the total tax contribution of all mom-and-pop shops, leading to a decline in the total tax revenue for the state.
The next section introduces the database used for the analysis. We use the database to identify which of District’s industries receive property tax abatements as well as the value of the assessment. Next, we compare District’s state and local business incentives with other jurisdictions.
About the data
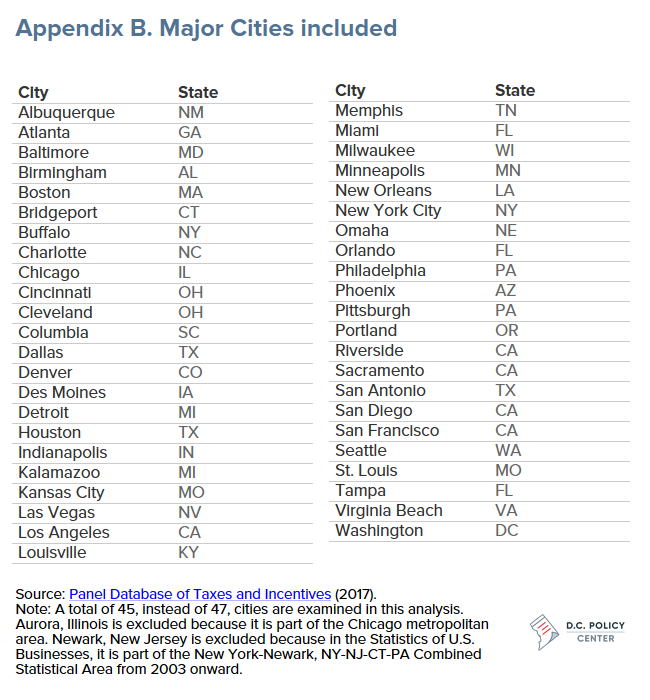
The Panel Database of Incentives and Taxes (PDIT) estimates marginal business taxes and business incentives for 47 cities in 33 states across 45 industries for a 26 year span, between 1990 and 2015 (See Appendix B for the full list of cities). The 33 states compose more than 90 percent of U.S labor compensation.[3] This constitutes the most comprehensive database on incentives and taxes to date, including all five major types of incentives: property tax abatements, customized job training subsidies, investment tax credits, job creation tax credits, and research and development tax credits.
State and local taxes and incentives are calculated for each year of the assumed 20 years of operation of the new facility, using:
- Balance sheet information
- Information on state and local tax rates
- Information on how incentives are determined based on firm characteristics
The PDIT database computes present the value of taxes and incentives as a percentage of the present value of the new facility’s value-added over the same 20 years using a discount rate of 12 percent.[4] The database does not aim to include all incentives but rather include the incentives that are commonly used by medium to medium-large export-base firms. The database does not include incentives rarely used or those that only apply to a few very large firms.
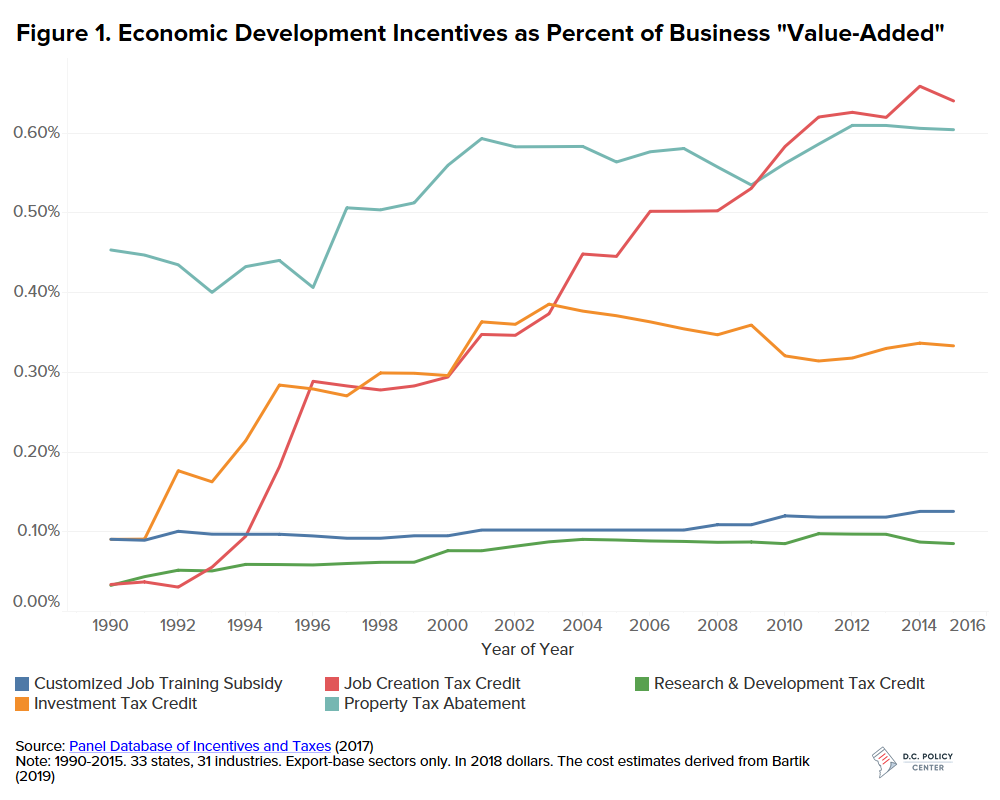
Figure 1 shows that, for unweighted averages between 1990 and 2015, job creation tax credits and property tax abatements receive the highest amount of incentives as a percent of “value-added”.[5] In 2015, tax incentives for new or expanding businesses in export-industries had a present value that averaged 1.42 percent of business-value added, which is about 30 percent of average state and local business taxes.
State and local business incentives offset a substantial percentage of taxes for businesses, although this amount represents only a small amount of total business expenses. For an average firm that receives incentives, tax incentives offset about 30 percent of the overall state and local business taxes that the firm would be obligated to pay otherwise – a substantial amount. However, in terms of the size of business activity, average business incentives subsidize only 3 percent of the firm’s wages for 20 years or on average about 5 percent of the value of a business’ productive activity (which is referred to as “value-added”).[6] Another way to think about it is in terms of overall state and local budgets. Tax incentives comprise only about 3 to 5 percent of total state and local annual tax revenue of $ 1.1 trillion (for 2019).
Section 3. The usefulness of tax incentives in D.C. is limited by the make-up of its sectors
The District takes a very different approach to state business incentives when compared to neighboring jurisdictions in Maryland and Virginia.
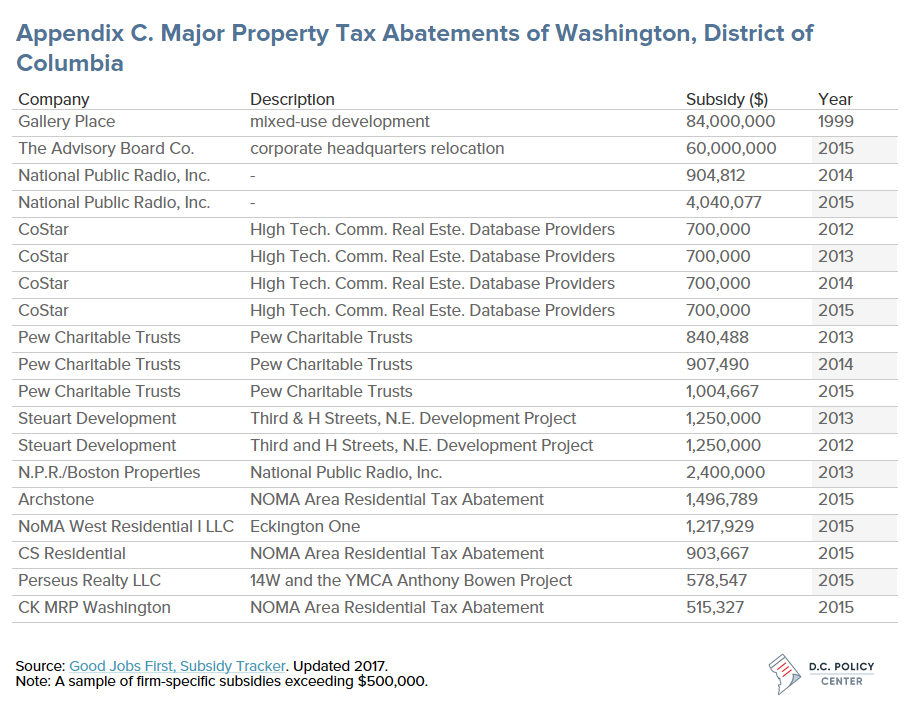
The District offers a different mix of tax incentives than Baltimore or Virginia Beach. The District’s incentive-granting strategy relies primarily on local property tax abatements. According to the Subsidy Tracker, the recipients of the District’s largest property tax abatements were Gallery Place ($84 million) for mixed-use development in 1999, and the Advisory Board Co. ($60 million) for its corporate headquarter relocation in 2015 (See Appendix C for a selected list of abatements). By contrast, at the city level, neither Baltimore nor Virginia Beach have major property tax abatements. [1]
At the state level, Maryland’s tax incentives principally depend on job creation tax credits and research & development tax credits. Virginia’s tax incentives principally rely on job creation tax credits and customized job training subsidies. Interestingly, job creation tax credits in Maryland and Virginia are remarkably similar in industries they target. The similarity in industry-targeting of job creation tax credit policies in Maryland and Virginia provide suggestive evidence of competitive behavior.
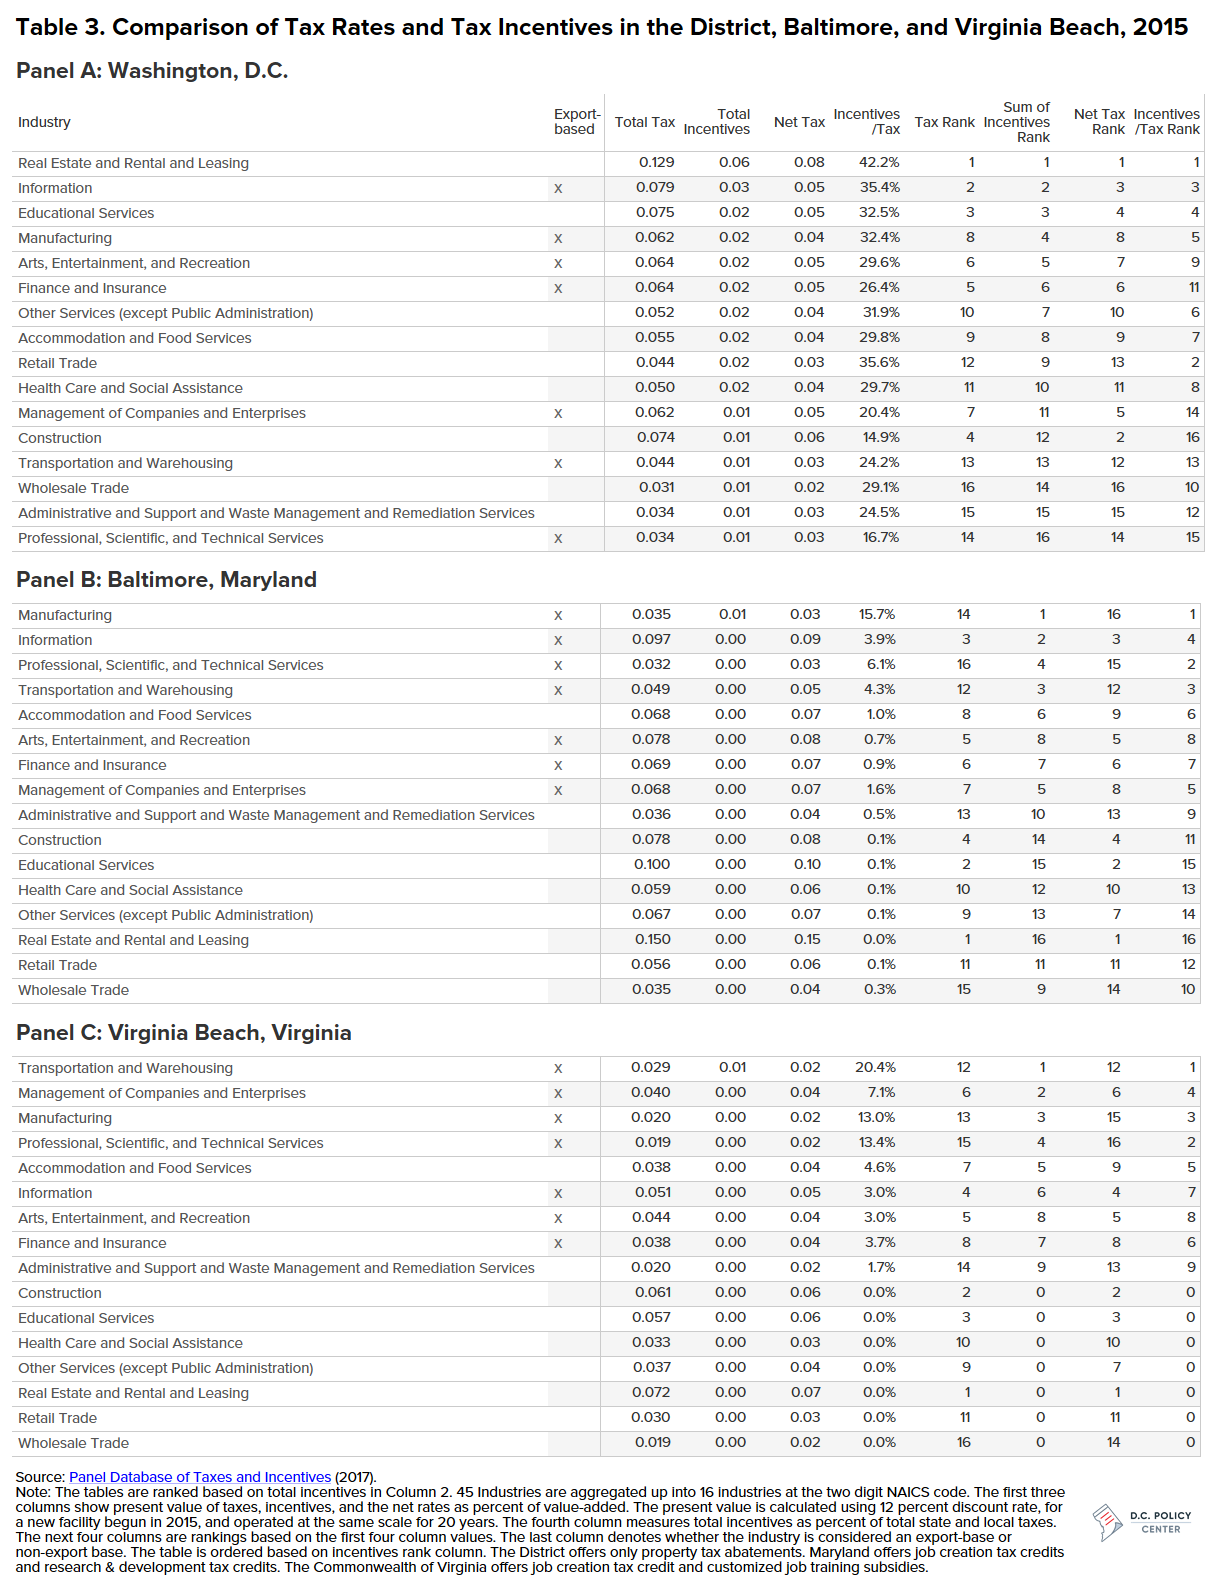
The District’s highest tax incentives correspond to high tax rates, diverging from strategies in Baltimore and Virginia Beach. In the District, the industries with the highest tax rates receive the highest tax incentives. By contrast, in Baltimore and Virginia Beach, many industries with low tax rates receive some of the highest tax incentives. These patterns suggest that Baltimore and Virginia Beach are more selective in what industries they target. Consider, for instance, that Virginia offers tax incentives only in nine out of sixteen industries. Clearly, the objective is to incentivize business activity in certain industries over others. By contrast, the District offers tax incentives across all sixteen industries.
The District offers much higher tax incentives than Baltimore or Virginia Beach. The second column in Table 3, below, quantifies the tax incentives in terms of percent of present-value of value-added. The District’s highest tax incentives are ten times larger than the largest tax incentives in Baltimore or Virginia Beach. In addition, the District’s lowest tax incentive in “Professional, Scientific, and Technical Services” is as large as the highest tax incentive in Baltimore or Virginia Beach.
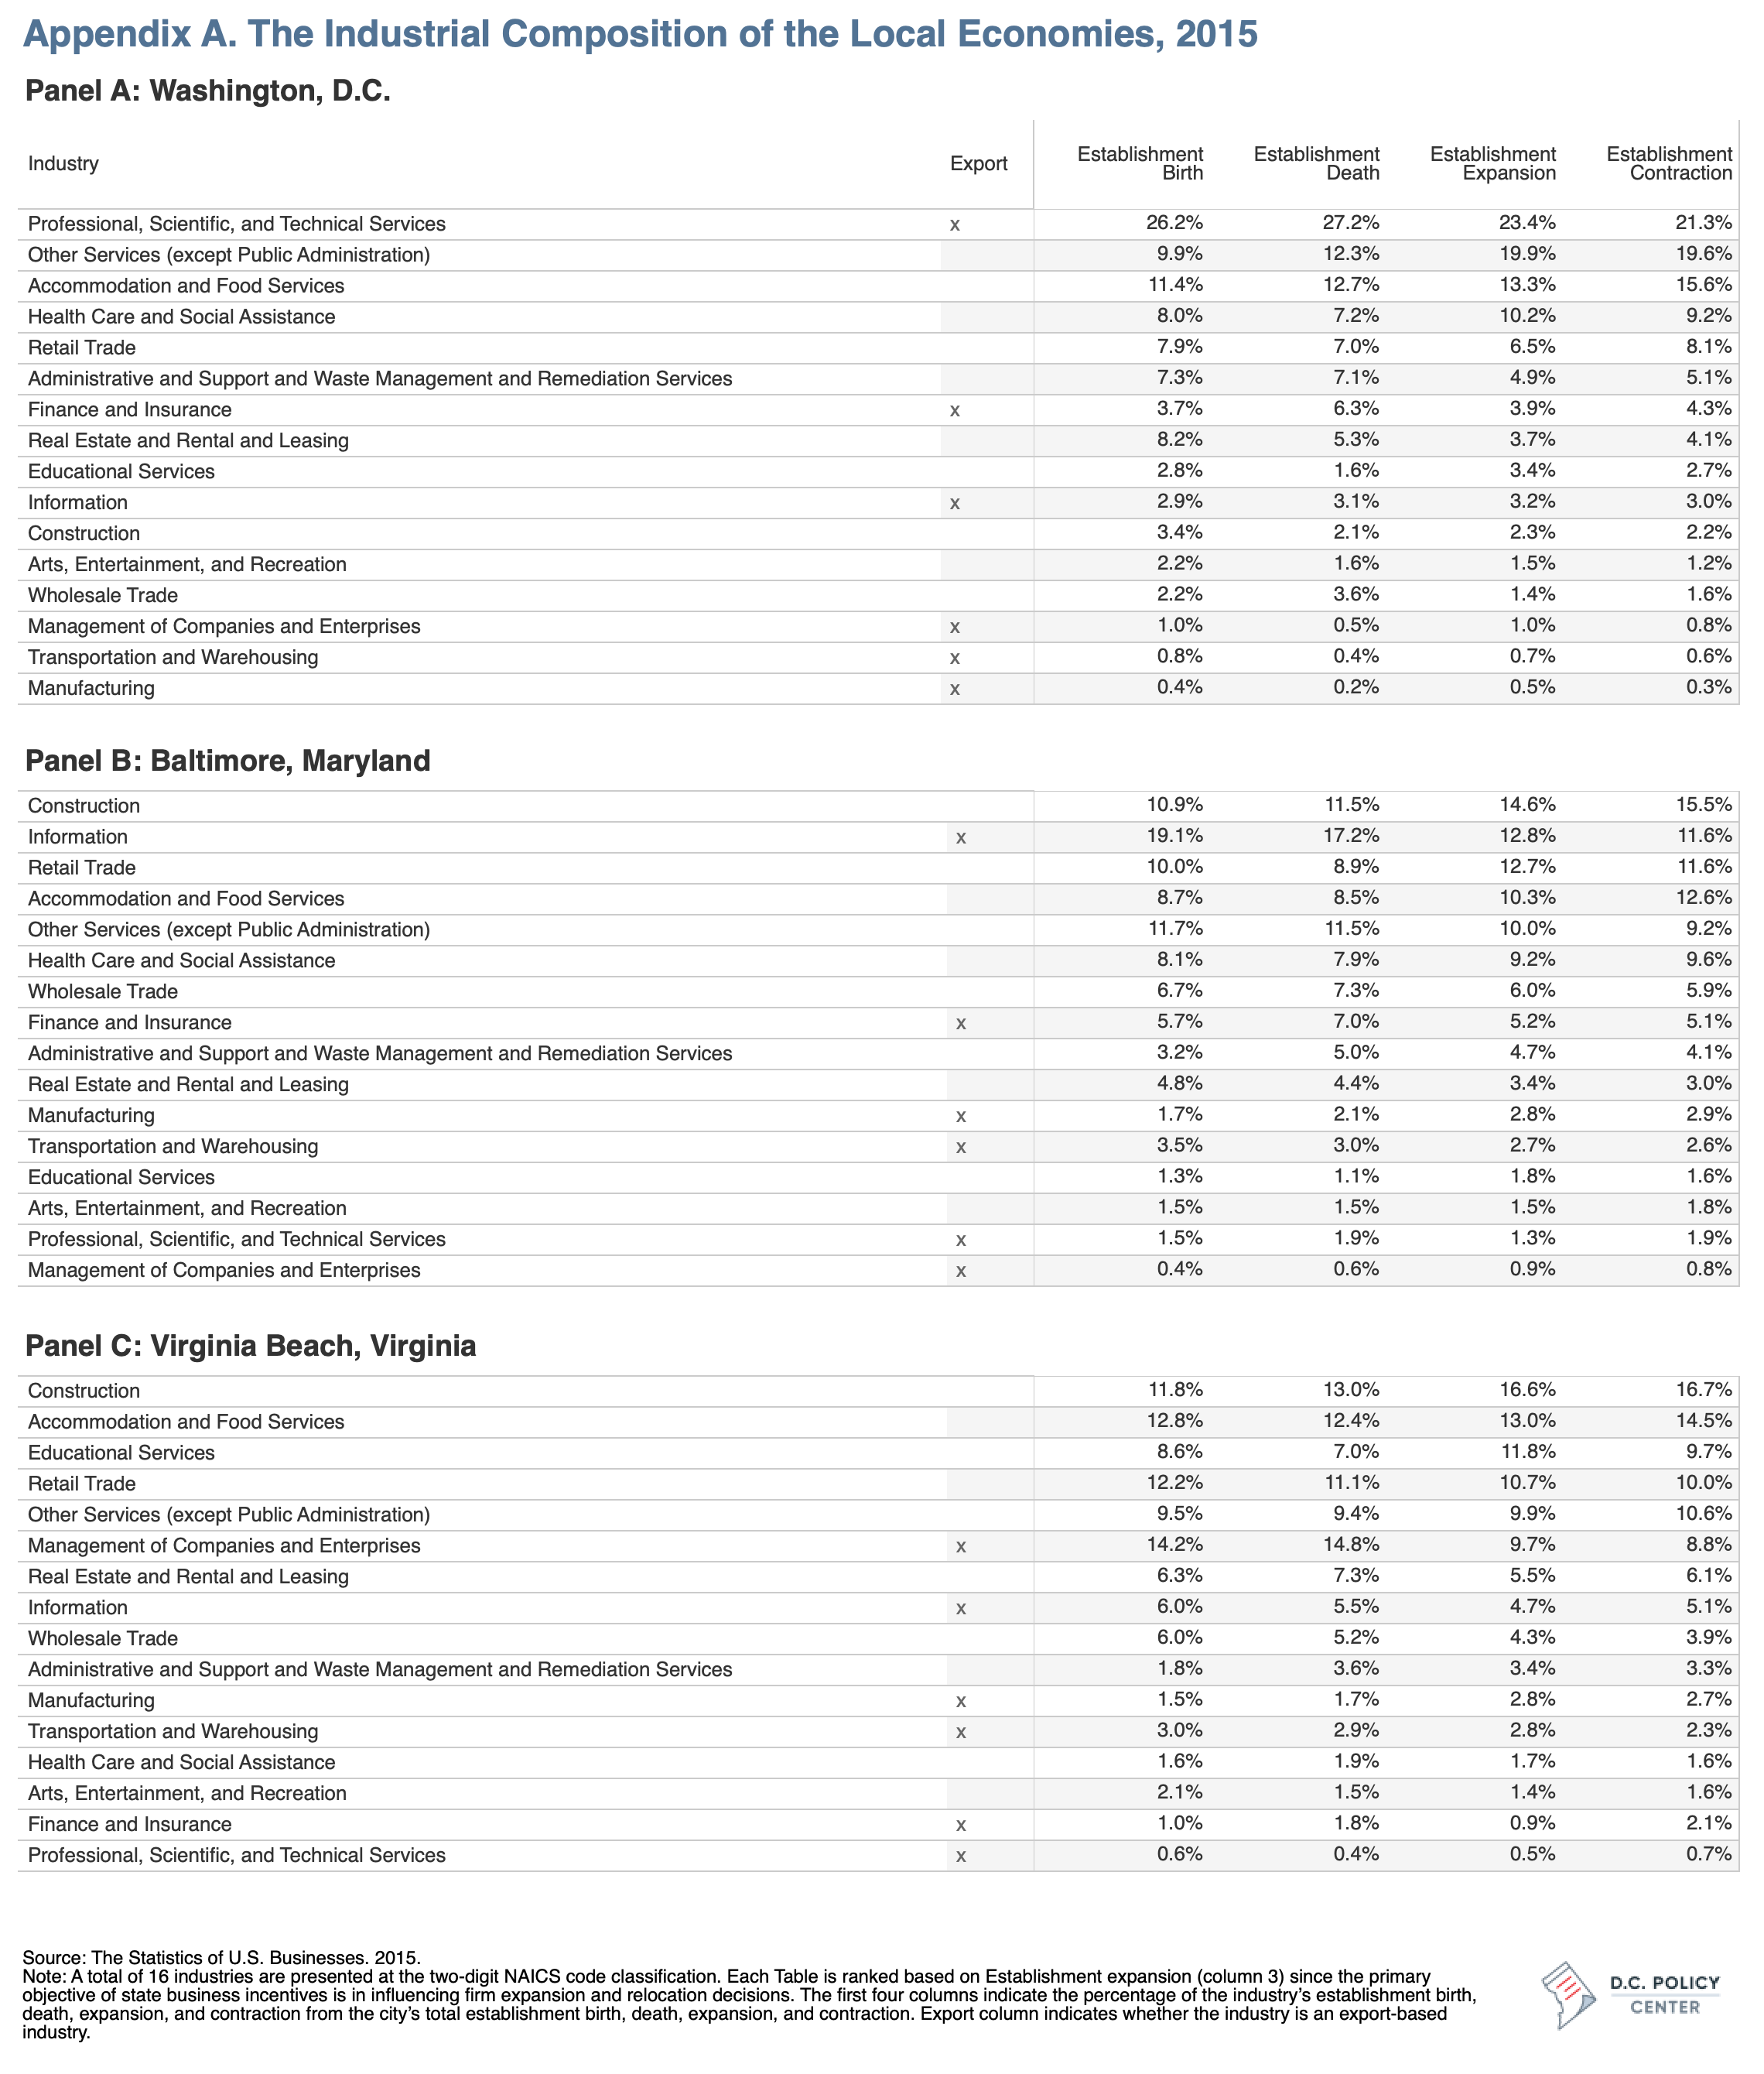
The District offers tax incentives to all industries while Baltimore and Virginia Beach employ a more targeted incentive strategy. As discussed earlier, research suggests that state and local policymakers ought to target export-based industries, which not only have highest job multipliers but also are less likely to result in job displacement. Notice that two of District’s top five industries receiving tax incentives are non-export base industries, while several of export-based industries (“Management of Companies and Enterprises”; “Transportation and Warehousing”; and “Professional, Scientific, and Technical Services”) rank low. By contrast, all of Baltimore’s top five industries and four of Virginia Beach’s top five industries are all export-based industries (See Table 3).
D.C. tax incentives tend to target non-export base industries
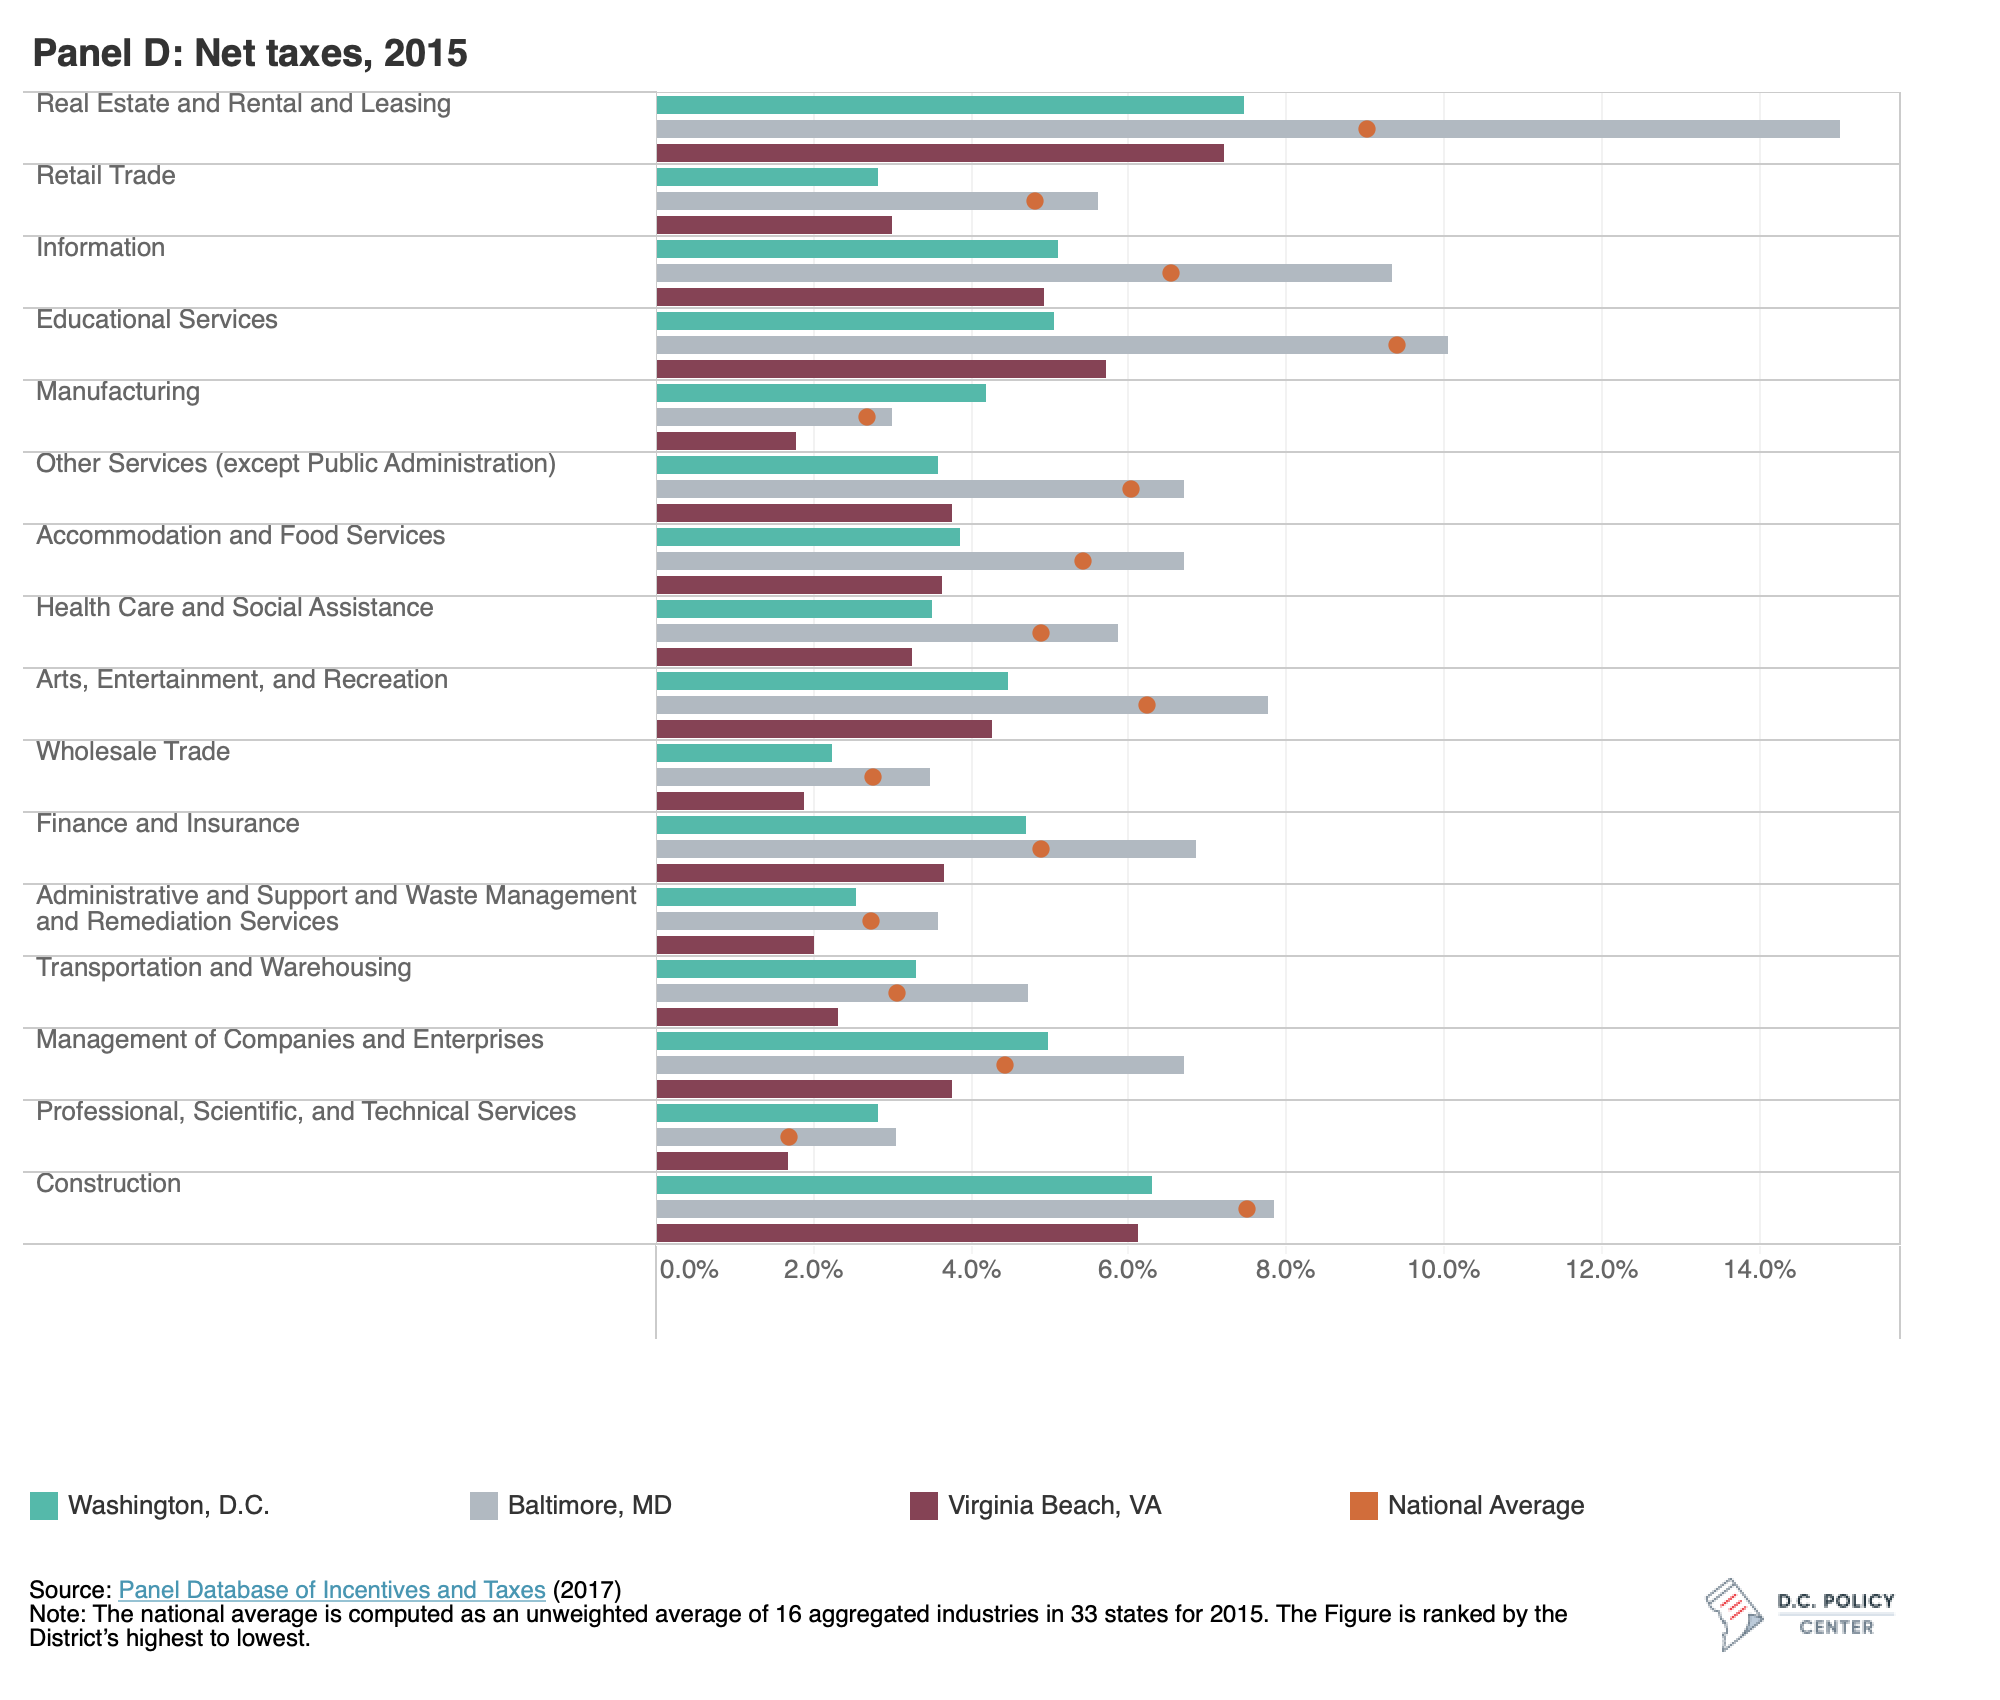
Figure 3 compares taxes and tax incentives of the District, Baltimore, and Virginia Beach to the national averages based on 2015 data. Panel A displays tax incentives as percent of total state and local taxes (total incentives / total tax * 100). Panel B displays total taxes, and Panel C, total incentives. Panel D displays the difference between total tax and total incentives (total tax – total incentives).
The District offers high tax incentives to some non-export based industries and offers low tax incentives to some export-based industries. The District’s most generous tax incentives are in “Real Estate and Rental and Leasing,” a non-export based industry; on average, recipient of tax incentives in this industry will get a 40 percent discount on the tax liabilities compared to others (See Panel A). Although the industry has comparable tax rates to the national average and slightly lower tax rates than Baltimore, once accounting for generous tax incentives, the difference widens, such that a recipient of tax incentives pays lower taxes than the national average and the non-recipient pays higher taxes than the national average (Panel B is the tax liability of the non-recipient and Panel D is the tax liability of the recipient). The District’s unusual targeting of this industry is perhaps reflective of the federal government’s presence.
Another unusually targeted industry is the “Retail Trade,” also a non-export based industry. This is, at least in part, reflecting the District’s “Supermarket Tax Incentives.” Through the Supermarket Tax Exemption Act of 2000, the District waives certain taxes and fees to grocery stores that locate in specific neighborhoods in order to encourage local development and investment in areas lacking access to groceries.
What is most unusual about the District’s incentive-granting strategy is the absence of targeting in “Professional, Scientific, and Technical Services,” an export-based industry. Nearly a quarter of the District’s establishment expansion is found in this industry (See Appendix A for the industry breakdown of each local economy). More so than Baltimore or Virginia Beach, the District already has agglomeration economies in this industry and could better harness this advantage.
The District’s targeting of “Real Estate and Rental and Leasing” and “Retail Trade,” and the lack of targeting in “Professional, Scientific, and Technical Services” suggests a need for rigorous program evaluation to inform lawmakers and improve policy choices. There are many questions that arise, such as: Are the District’s generous tax incentives justified or should they be reduced across the board? Should the District discontinue tax incentives in certain industries and increase incentives in others? Should the District adopt a mix of tax incentives rather than relying so heavily on property tax abatements? The only way to answer these questions is through continued program evaluation.
Figure 3. Comparison of Taxes and Tax Incentives to the National Average, 2015
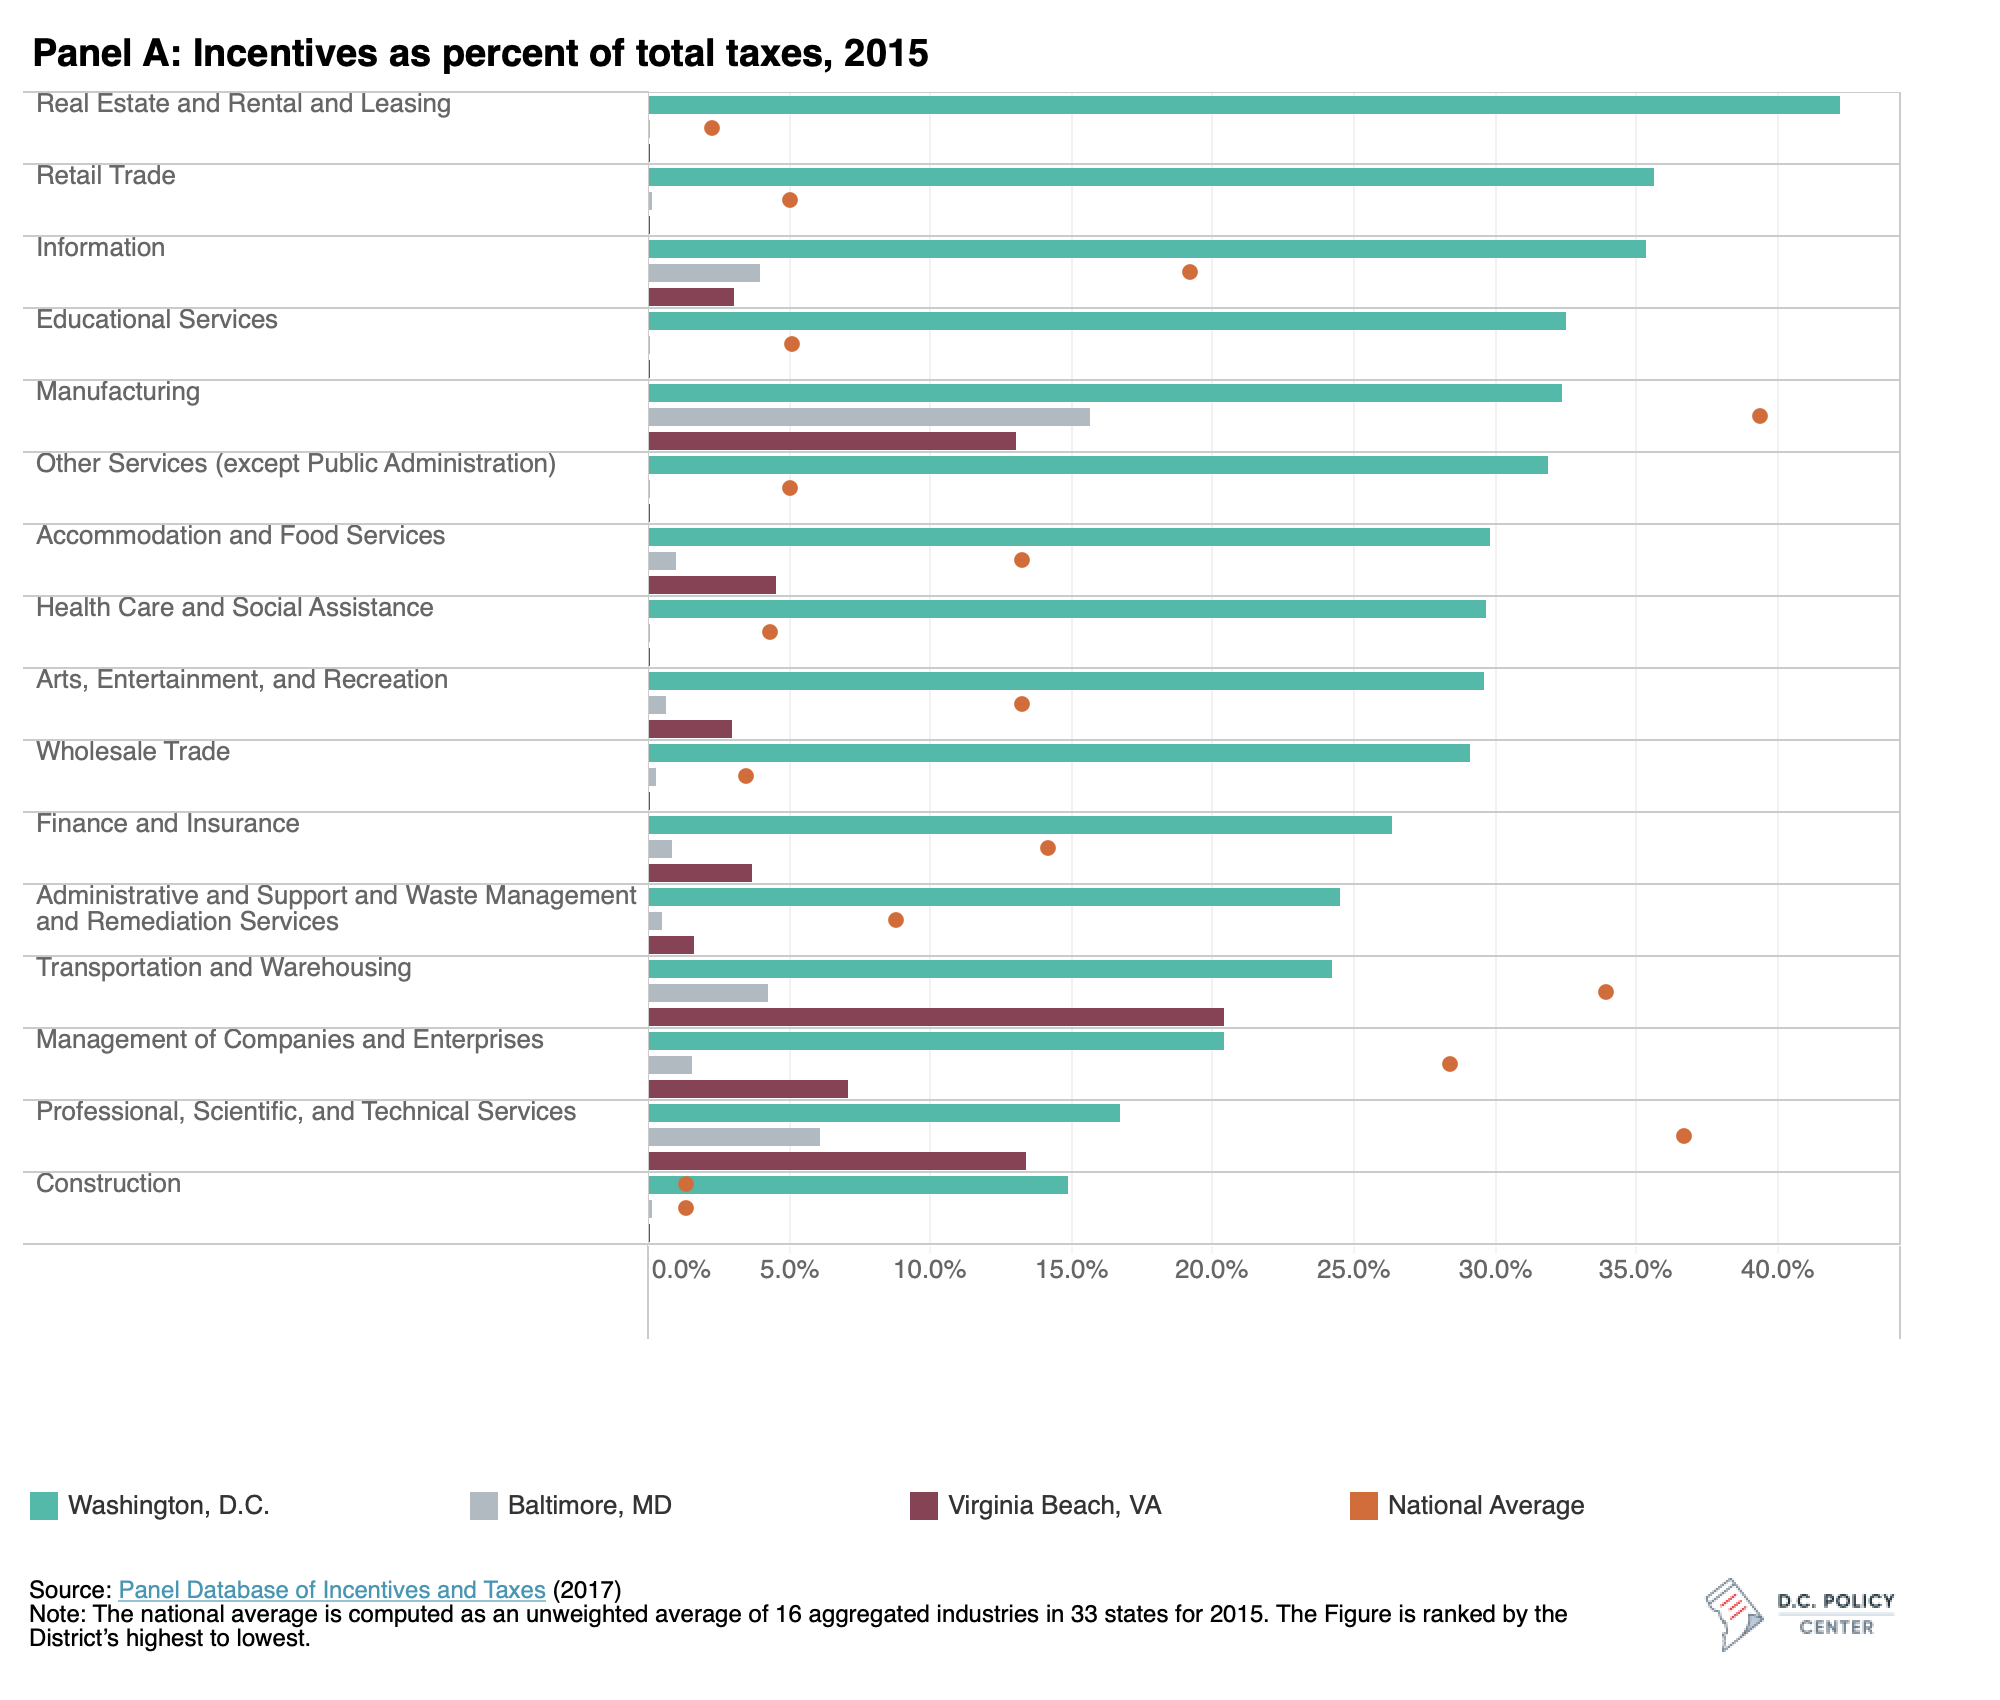
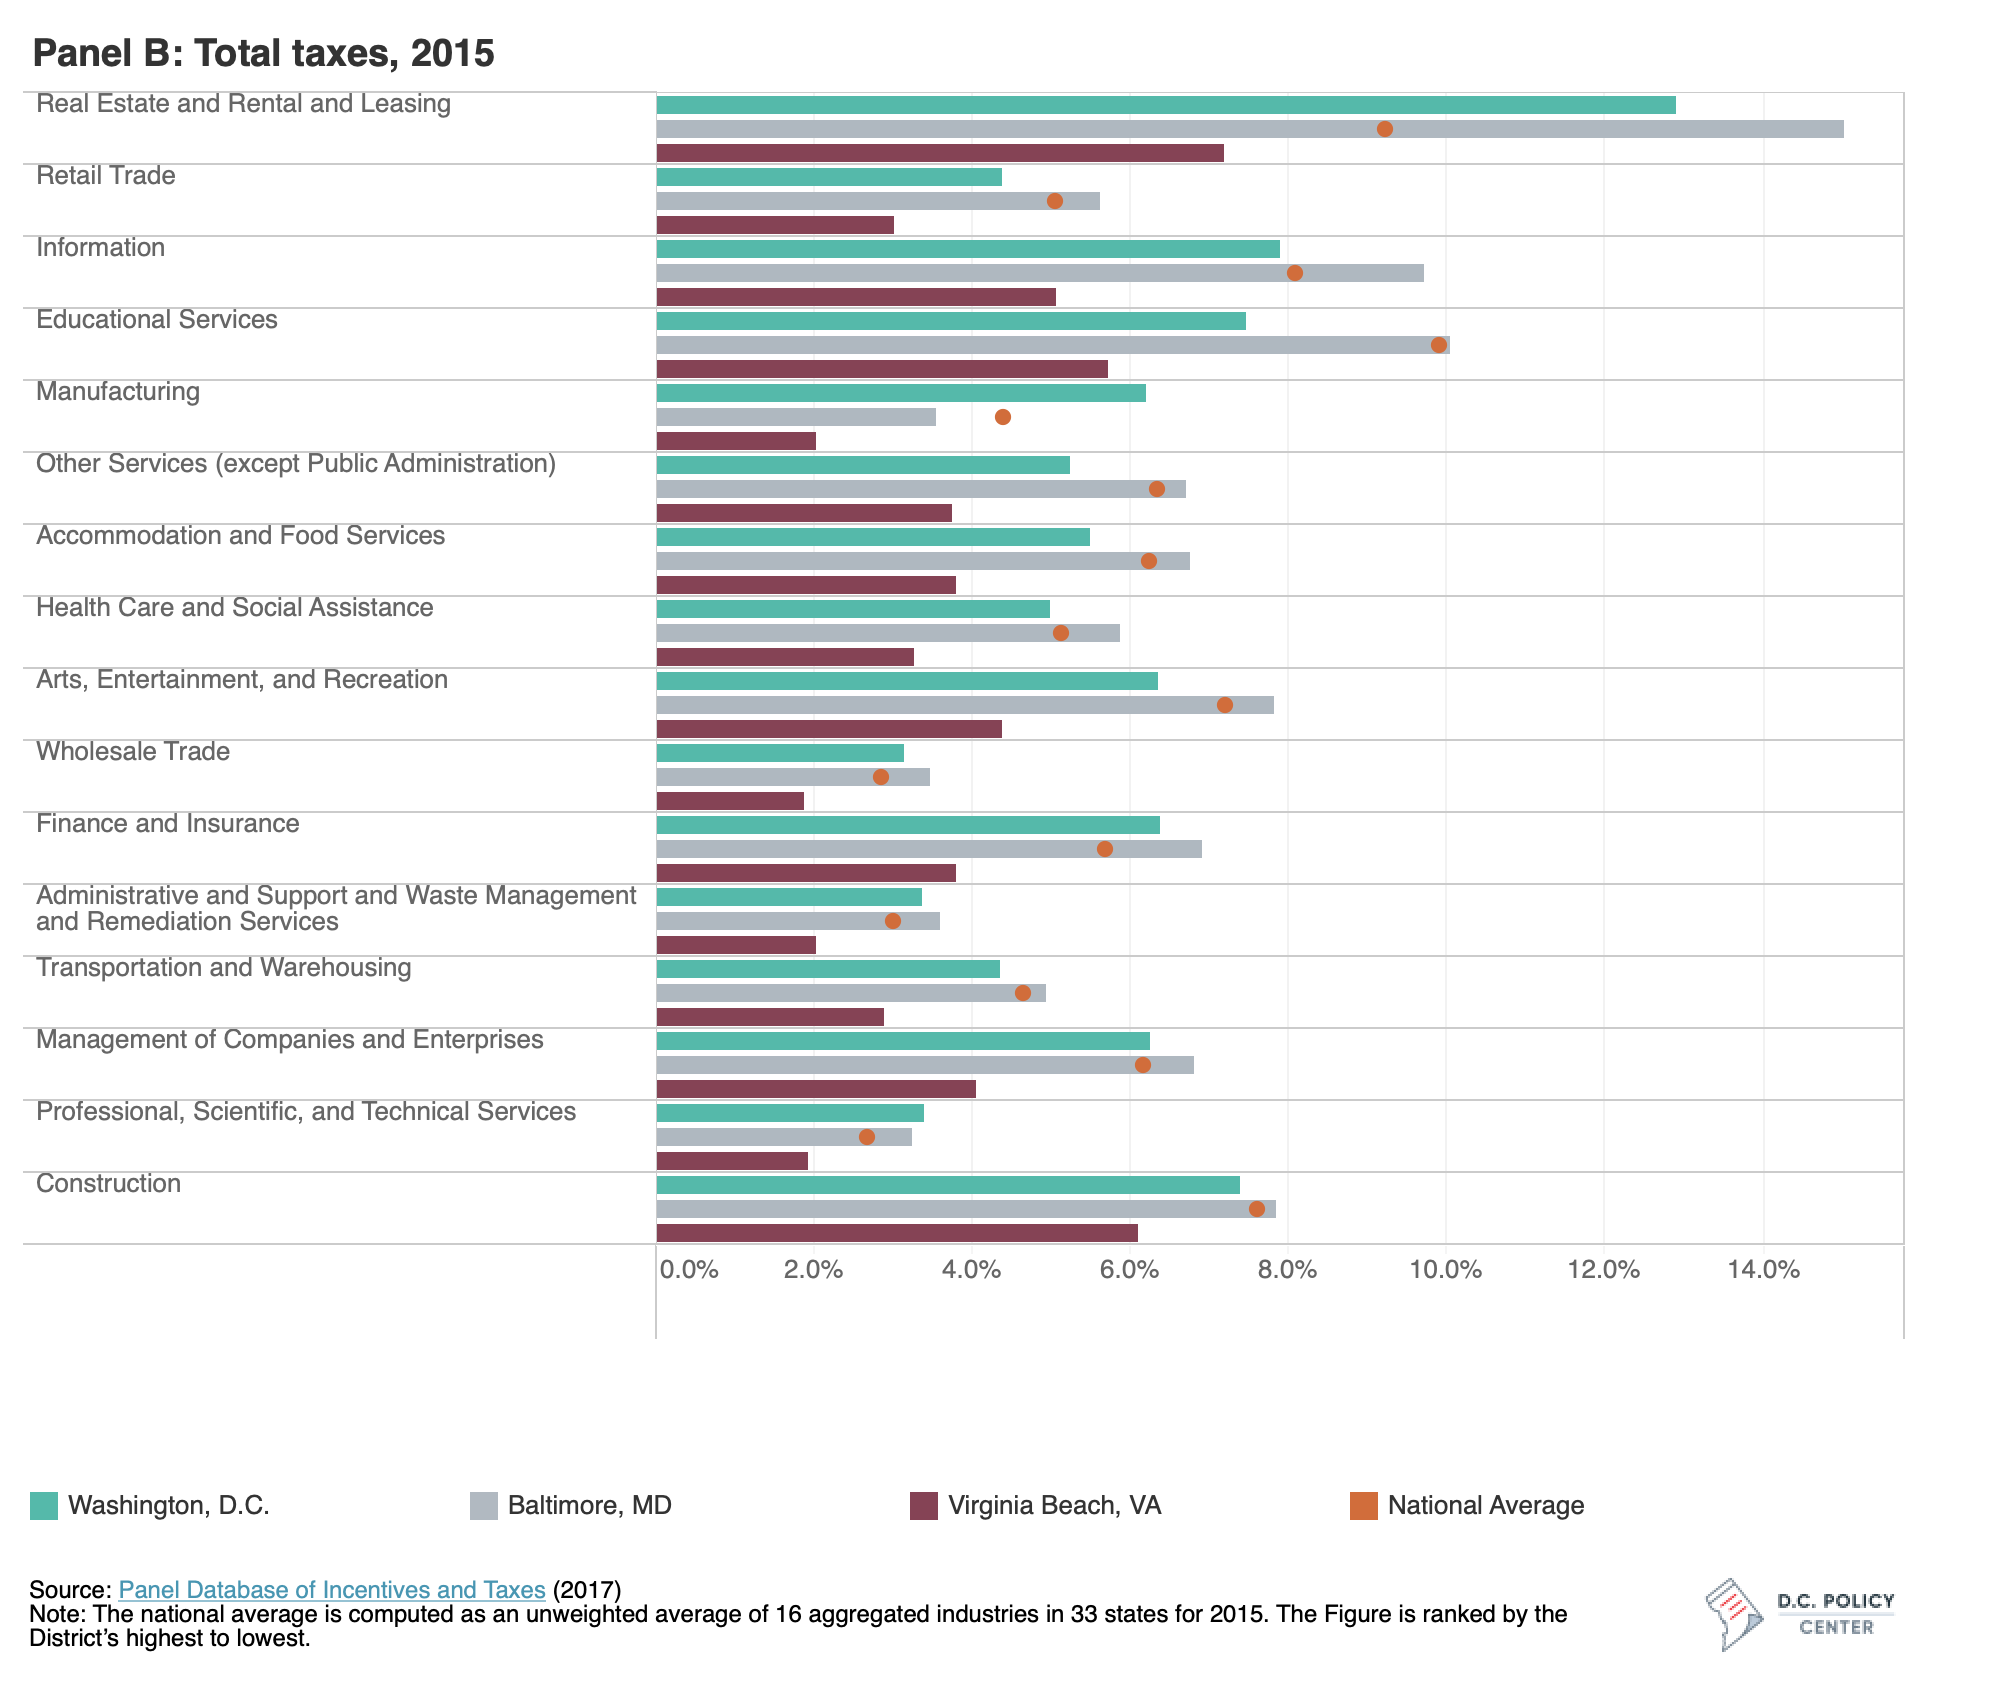
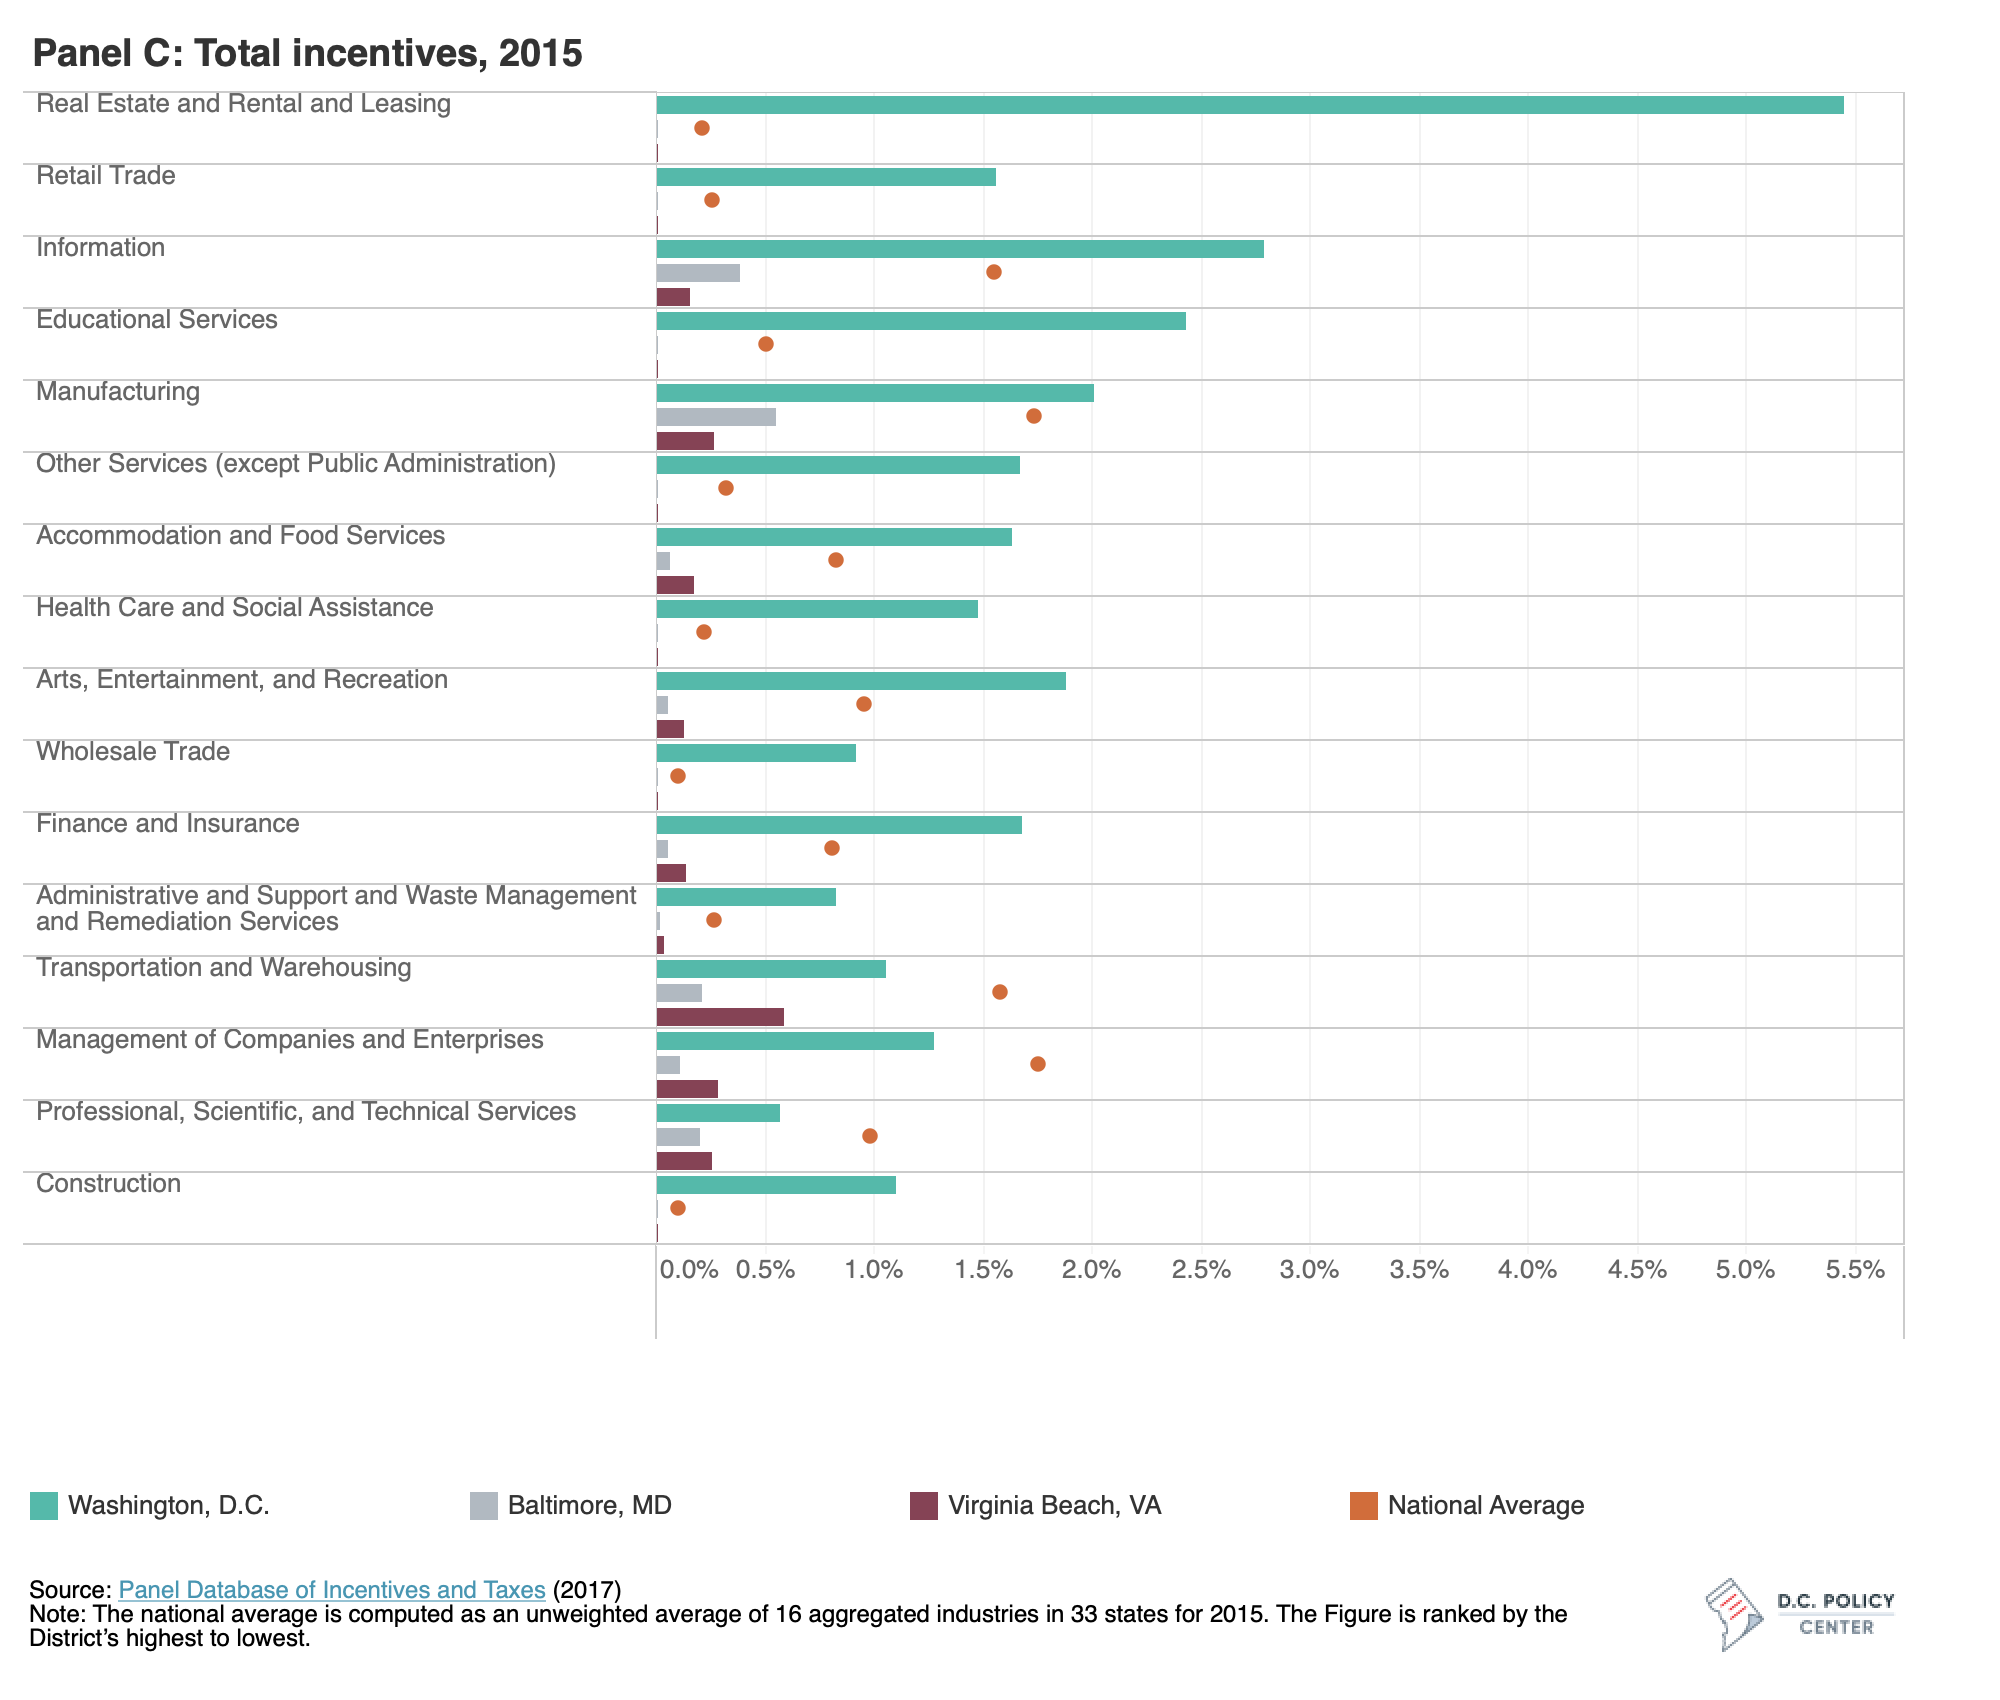
The District’s tax incentives are exceptionally high compared to the national average, while its tax rates are just around the national average. The District has higher tax incentives than the national average in 12 of 16 industries; by contrast, incentives in Baltimore and Virginia Beach are low compared to the national averages (See Panel A and C). The District’s tax rates are just around the national average, with the exception of “Real Estate and Rental and Leasing” (See Panel B). As a result, the difference in tax obligation for the District’s tax incentive recipients and non-recipients is large. In theory, if these tax incentives are effective in targeting productive firms and promoting productive behavior, the policy impact will be large. However, if they are ineffective in targeting and incentivizing productive behavior, this policy can generate adverse effects.
According to the aforementioned 2012 study conducted by Pew Center on the States, the District, along with 25 other states, did little to nothing to evaluate the effectiveness of tax incentives. In fact, a 2011 study, conducted by Good Jobs First, investigated how well state subsidy programs delivered on jobs and ranked the District last, behind 50 states. Unlike other states, the District did not have requirements on how long new jobs should last, what benefits should be provided, or how close wages should be to market-rate. WAMU’s five-part special investigation in 2013 found evidence of political favoritism in the District’s tax incentive granting. Elected officials received more than $2.5 million in campaign cash from groups receiving the subsidies; in return, those officials approved $1.7 billion in tax breaks and discounted land deals between 2000 and 2010.
Since then, the District has made significant progress. The Pew Charitable Trusts’ 2017 national assessment of evaluation practices, the most recent study of its kind, finds an overall improvement in states’ evaluation of incentives. The District also enacted tax incentive evaluation law in 2014, authorizing Office of the Chief Financial Officer to periodically review incentives every five years.
Upcoming analyses
This study’s aim was to conduct a rigorous analysis of the District’s incentives and propose actionable policy recommendations. This study finds that when compared to Baltimore, Maryland and Virginia Beach, Virginia, the District’s tax incentive strategy could be more targeted. The most immediate way to improve the District’s tax incentive strategy is to target export-based industries.
The Washington DC Economic Partnership has laid out the District’s six key industries (hospitality, professional services, data science & analytics, tech, retail, and security technology). In the light of the findings of this study, do all six industries merit targeting, or should some industries be given greater priority? Retail, for example, is a non-export industry that poses risks of job displacement. My research suggests that targeting export-based industries is as important as recognizing one’s local comparative advantage, and as such, is an important factor to the District’s competitiveness. A well-targeted incentive strategy aligns the incentives to local comparative advantages. Professional services and technology industries are some of the most prominent export-based industries, but is the District’s economy able to produce certain goods and services in that particular industry at a lower opportunity cost to those of other localities? Future analysis will examine the District and surrounding jurisdictions to determine if they are giving incentives and resources to industries in which they have a comparative advantage. Additionally, future analyses will explain what the District’s local comparative advantage is and whether tax incentives are well-aligned with its local comparative advantage.
Appendix