When exploring average teacher salary, we wondered: How do D.C.’s teacher salaries compare to geographically close locations and nationally? We aim to answer that question using the National Teacher and Principal Survey, a nationwide survey sample of questionnaires that provide specific information regarding the experiences of teachers and principals.
Teacher pay in the District of Columbia is reported to be among the highest in the country1 and higher than most neighboring jurisdictions, including Virginia, Maryland, and Pennsylvania.
Teacher salary has been a pressing topic for legislators, policymakers, and arguably the most important stakeholder: teachers. Yet, teachers’ salaries do not get as much attention when discussing schools and pay as school principals’ salaries.
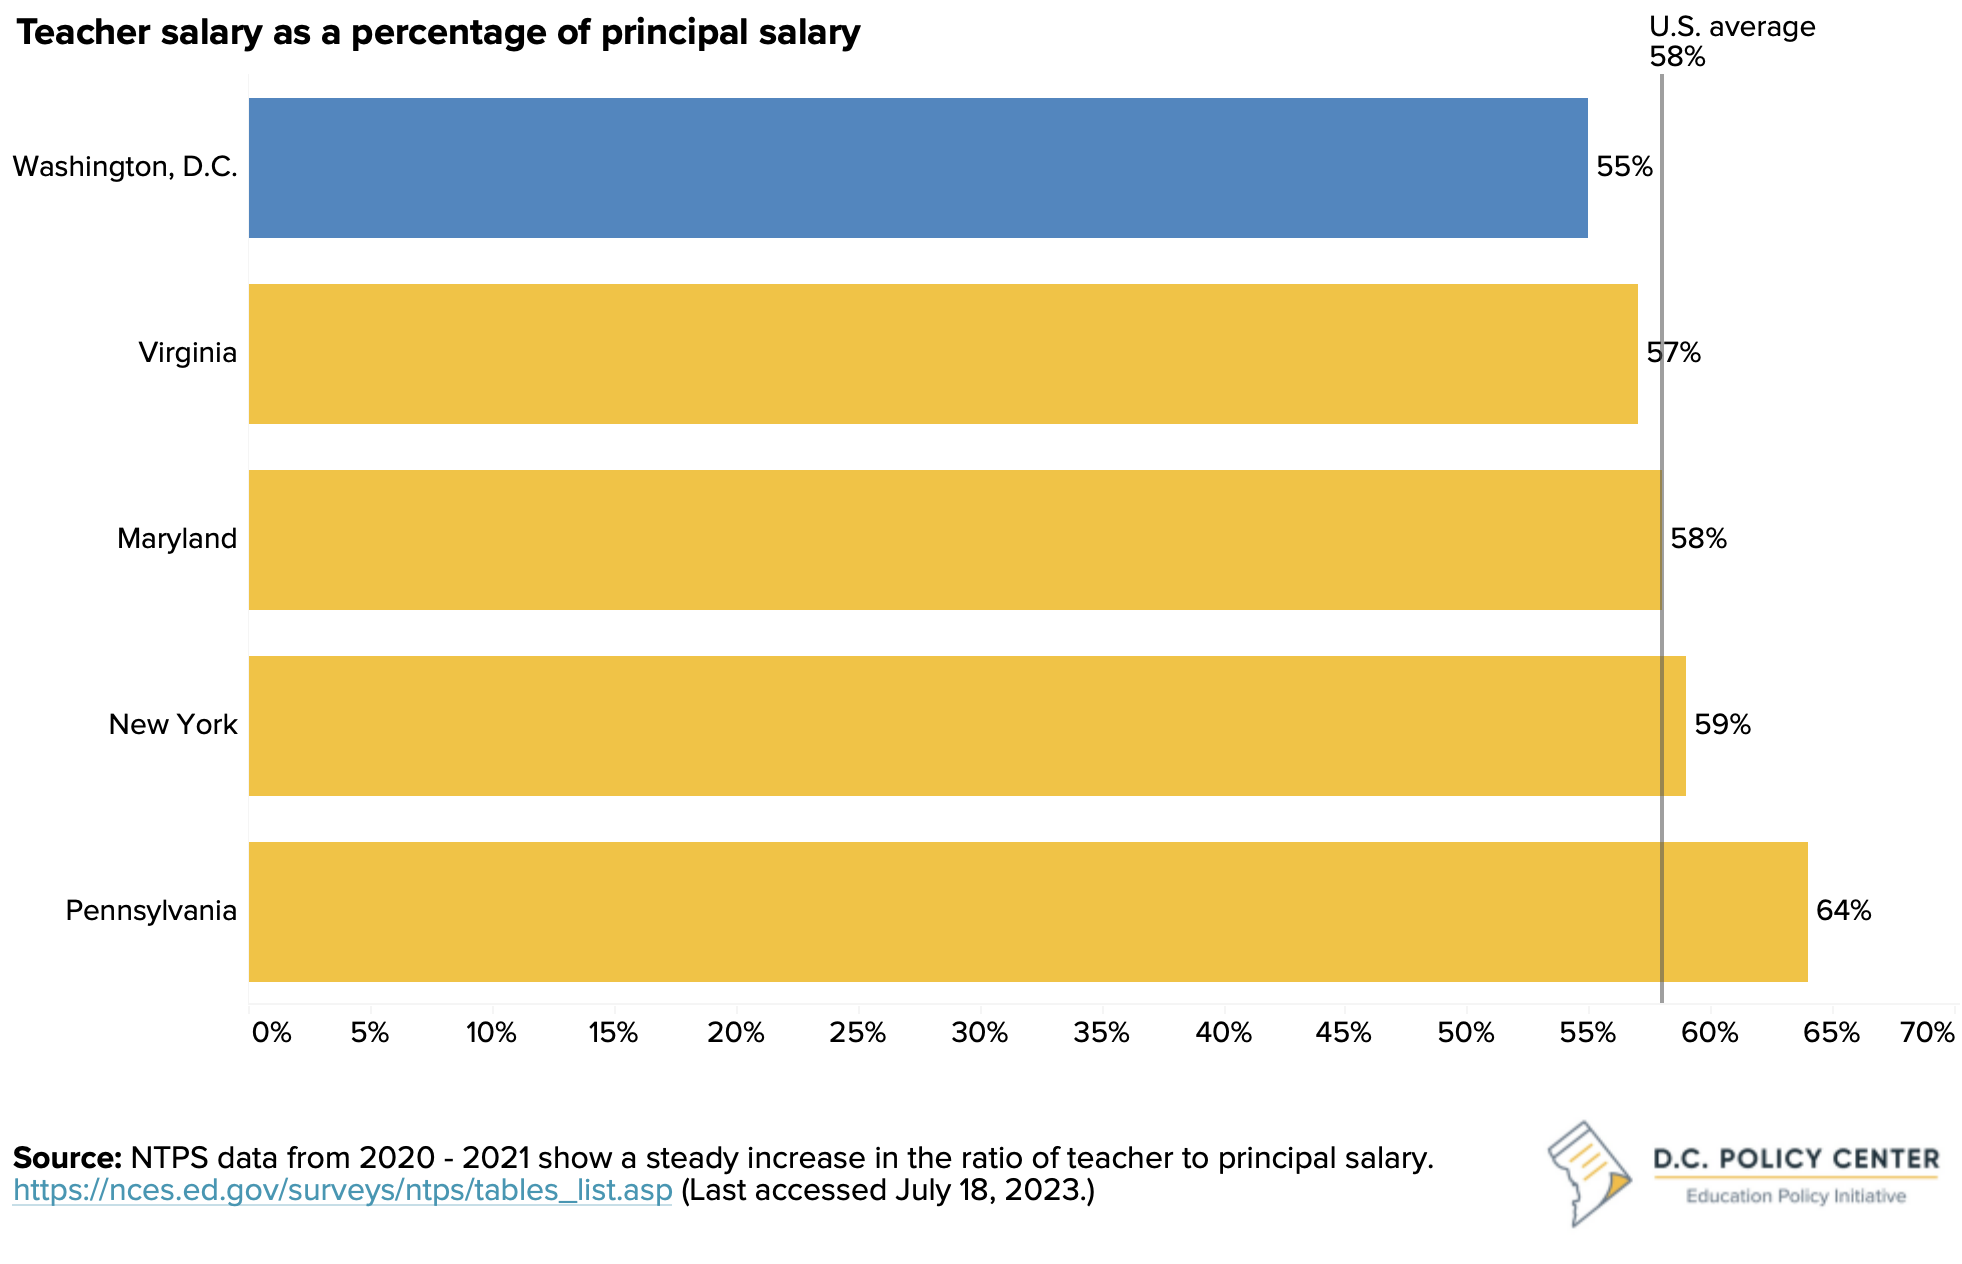
One way to look at this issue is to compare principals’ salaries to teachers’ salaries. We find that teacher salaries in D.C., although higher than most neighbors and the national average, are proportional to principal salaries.
Salaries are often determined by a variety of factors: experience, qualifications, education, cost of living, and more.
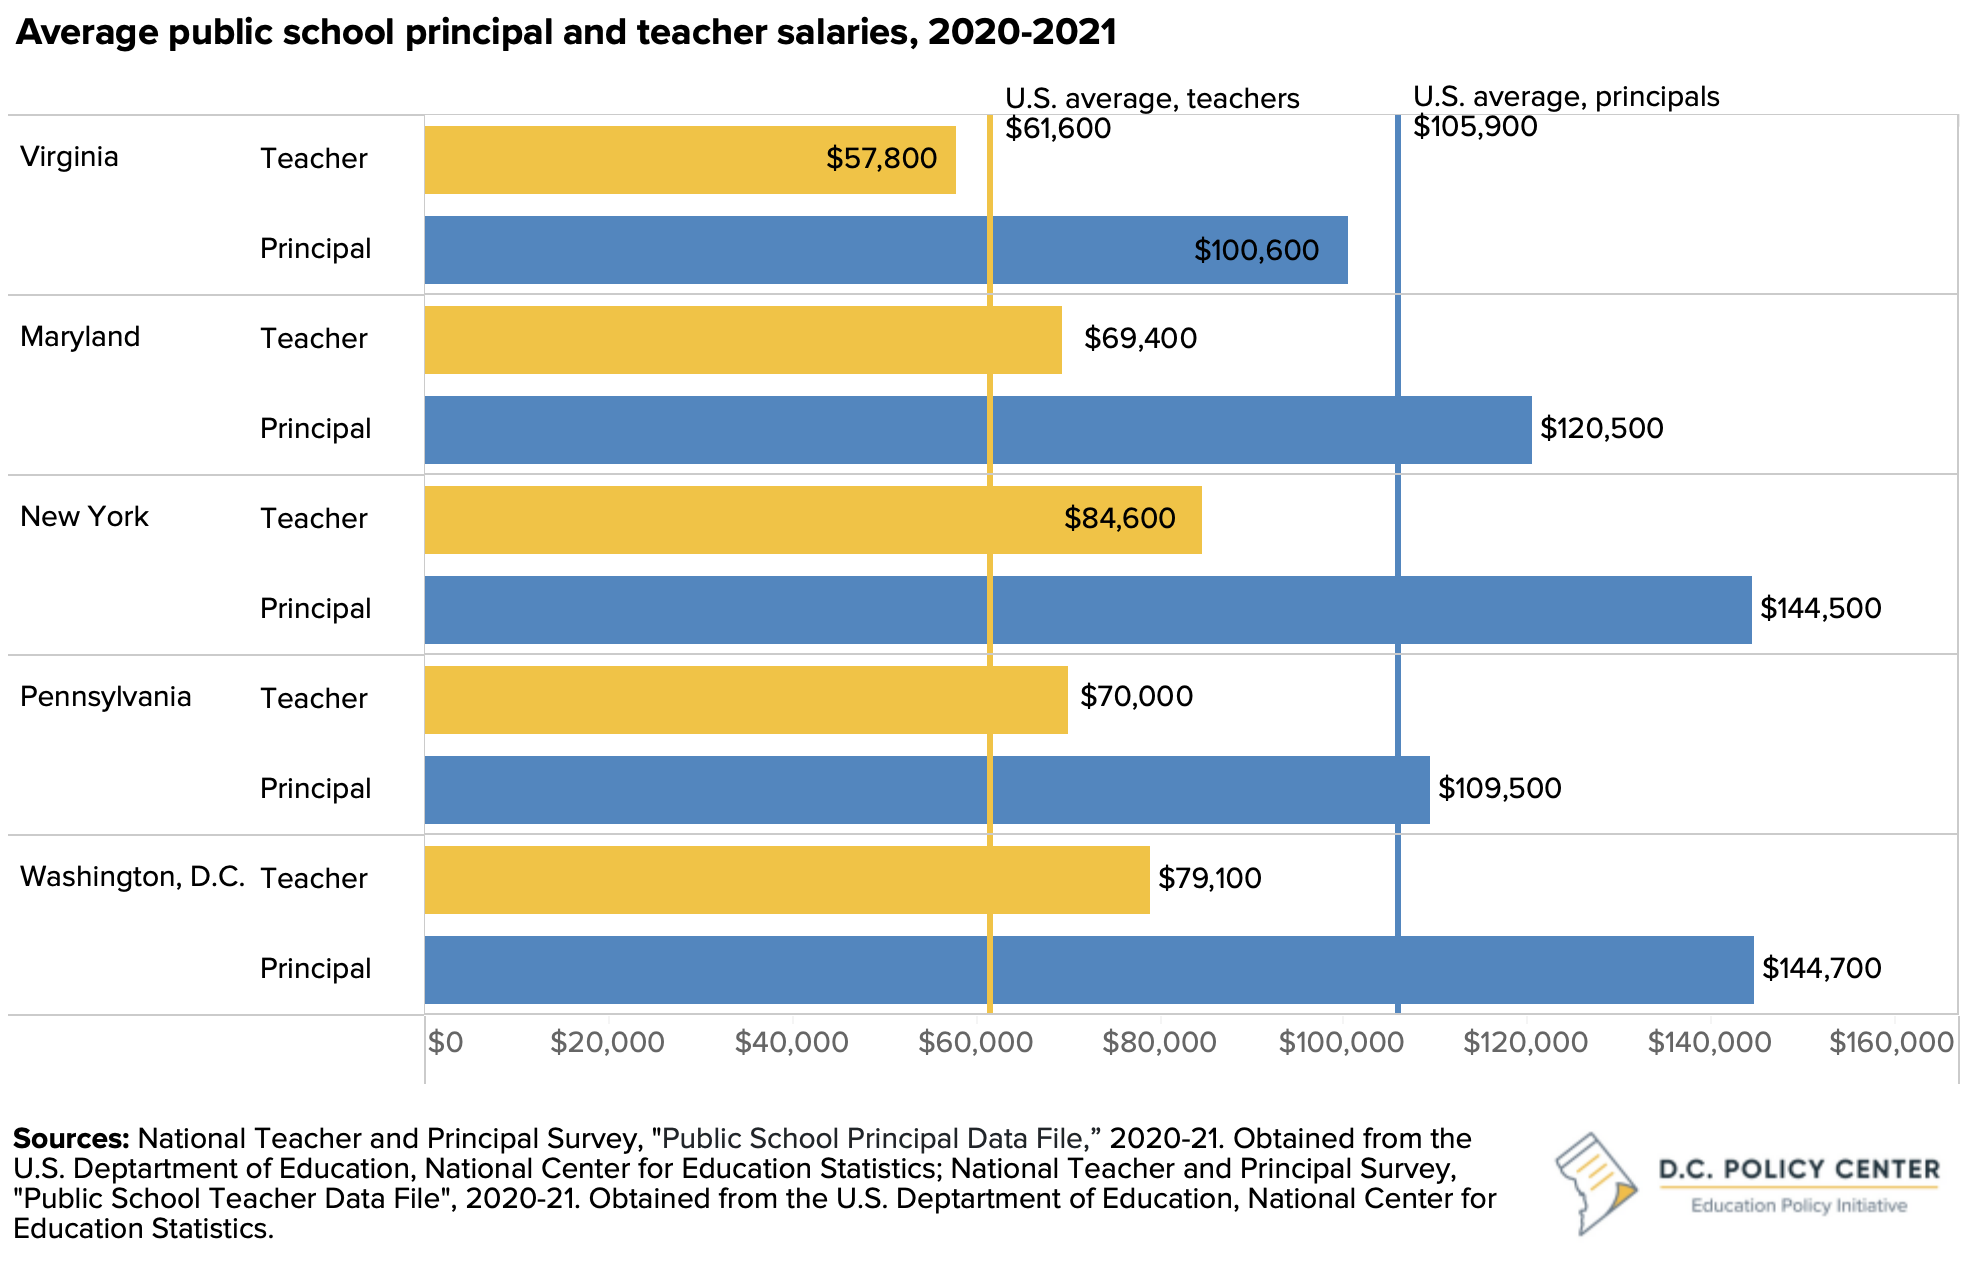
We found the District of Columbia pays on average public and public charter principals $144,7002, and teachers are paid $79,8003. To put it further into perspective, teachers are paid 55% of what principals earn in D.C. compared to the national average of 58% and close geographical locations, Maryland and Virginia.
The National Teacher and Principal Survey (NTPS) also reveals that in 2020-2021, K-12 public school principals made on average $105,000 in the U.S.4 These data are inclusive of both public school and public charter school principals. Teachers, on average, were paid $61,6005.
While it’s clear that the District of Columbia pays both principals and teachers higher-than-average salaries, the ratio is lower than the national average and surrounding states including Maryland, Virginia, and Pennsylvania.
Endnotes
- District of Columbia Public Schools. (2019). Washington Teacher’s Union ET-15 Salary Schedule.
- U.S. Department of Education, National Center for Education Statistics. (2020). Principal’s Average annual salary: 2020-2021.
- U.S. Department of Education, National Center for Education Statistics. (2021). Teacher’s annual average salary: 2020-2021
- U.S. Department of Education, National Center for Education Statistics. (2020). Principal’s Average annual salary: 2020-2021.
- U.S. Department of Education, National Center for Education Statistics. (2021). Teacher’s annual average salary: 2020-2021.