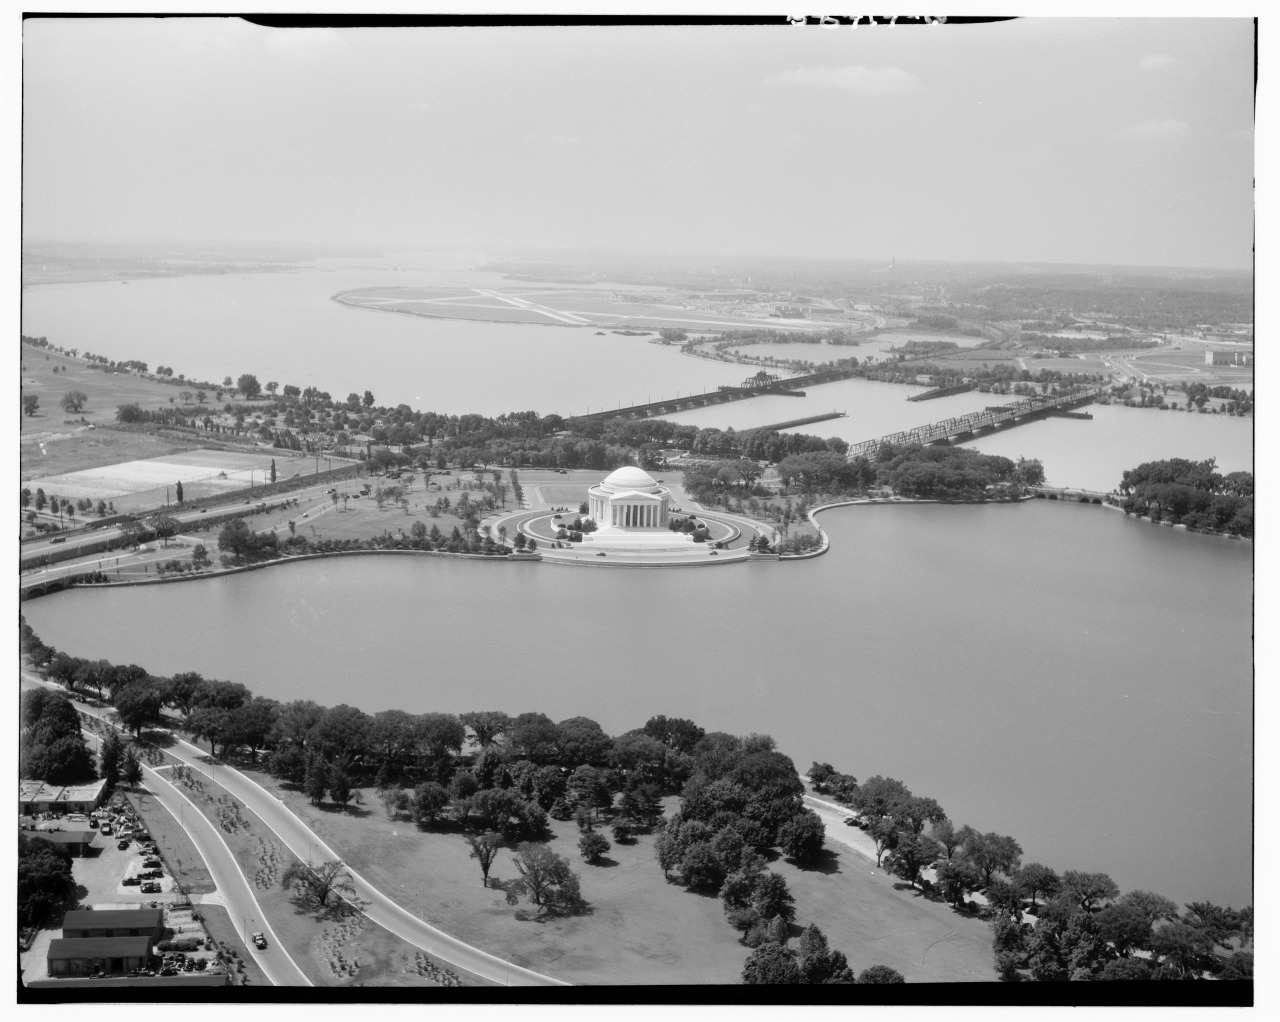
Bird’s-eye view of DC metro area then and now
My father took me on my first airplane ride in 1950. It was on a DC-3 that took off from Washington National for a half-hour sightseeing flight over Washington, DC. (That’s a measure of how uncommon air travel was almost 70 years ago.)
Our plane flew over all the Nation’s Capital’s iconic sights, including (for this newly-minted Washington Senators fan) Griffith Stadium, then circled the area. There didn’t seem to be much else visible from the air outside of the District. In Montgomery and Prince Georges Counties, houses and strip shopping centers hugged Western and Eastern Avenues–Bethesda, Silver Spring, College Park, Hyattsville, and Bladensburg.
Crossing the Potomac again, built-up areas covered all of Falls Church, Arlington, and Alexandria (where we lived in Parkfairfax next to Shirley Highway). However, little was to be seen in surrounding Fairfax County except for a strip of development along US 1 leading to Fort Belvoir. I looked fruitlessly for Bailey’s Crossroads Airport, a little, dirt and gravel airport that on weekends my father would drive us to see. (We called it “Pilot Small’s Airport” after Lois Lenski’s popular children’s book.)
Fly into the Washington area today and you are likely to land at Washington Dulles International Airport, in eastern Loudoun County, 31 miles and an hour’s drive (if you’re lucky) from the US Capitol.
If you update my 1950 flyover of the Washington area, you’ll see continuous residential and commercial development covering eastern Loudoun County to Leesburg and all of northern Fairfax County.
In Montgomery County, Potomac and North Potomac now link Glen Echo to Bethesda, while intensive development proceeds northward up Rockville Pike all the way into southern Frederick County.
In Prince Georges County, intensive development extends out to Bowie, Upper Marlboro, and Fort Washington. Re-crossing the Potomac, all of southern Fairfax County is now built up, as is most of Prince William County with tendrils stretching out to Warrenton in Fauquier County and to Stafford County Courthouse.
Most poignantly, Pilot Small’s Airport closed in 1970 to become the site of the massive Skyline Center high-rise office, apartment, and retail complex.
Using Census Bureau data to measure urban sprawl
How can one measure such sprawl? The U.S. Census Bureau offers one method: an urbanized area. An urbanized area (UA) is formed of contiguous census blocks with a density of at least 1,000 persons per square mile, or at least 500 persons per square mile if the census block contains a mix of residential and nonresidential uses (parks, schools, commercial, retail or industrial uses). In short, any urbanized census block is likely to look “developed” from our bird’s-eye view.
In 1950, the Census Bureau-defined Washington DC-MD-VA UA held 1,287,333 residents within 178.4 square miles. Though only one-third (61.4 sq. mi.) of the UA’s urbanized land, Washington, DC itself (802,178) was almost two-thirds of the UA’s population.
In 2010[1], the Washington DC-MD-VA UA contained 4,586,770 residents within 1,321.7 sq. mi. The District (601,723) was only about one-eighth of the urbanized population and less than five percent of the urbanized land.
Whip out your calculator and you’ll find that urbanized population grew 256 percent but urbanized land ballooned 641 percent–two and a half times as fast. That land growth-to-population growth ratio (2.50) is the best measure that I’ve come up with for comparing the degree of urban sprawl among multiple UAs across six decades.
How does the Washington UA compare with other UAs?
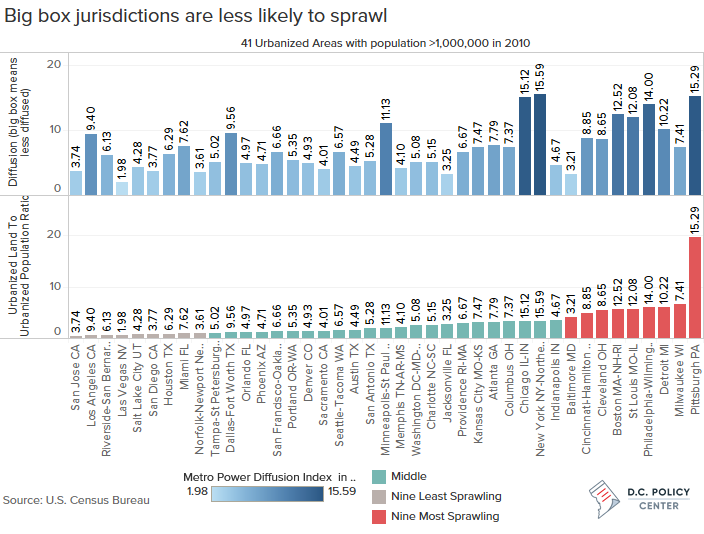
The chart below lists the 41 UAs with over 1,000,000 residents. In its land growth-to-population growth ratio, the Washington UA falls about in the middle. (You can download the full data set here)
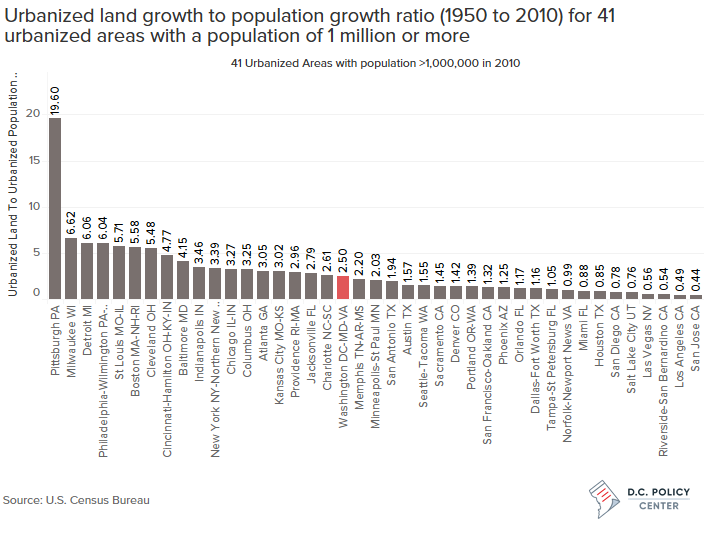
Compare the nine least sprawling UAs (ratios less than 1.00) with the nine most sprawling UAs (ratios more than 4.00).
“Wait a minute,” you may say. “I’ve flown into San Jose (or Los Angeles or Las Vegas). I look down and say “Wow, what sprawl!”
That’s only because in an arid or semi-arid zone you can see everything that’s been built. If you could strip away all the tree cover of places like the Detroit area or the Milwaukee area or the Pittsburgh area, you’d see that since 1950 much more land has been consumed for far fewer people there than has happened in the San Jose area or Los Angeles area or Las Vegas area.
So, if you’ll believe my statistical evidence (rather than “your lyin’ eyes”) of “least sprawling” and “most sprawling,” you’ll notice from the table some characteristics whose relevance I have confirmed through statistical analysis.
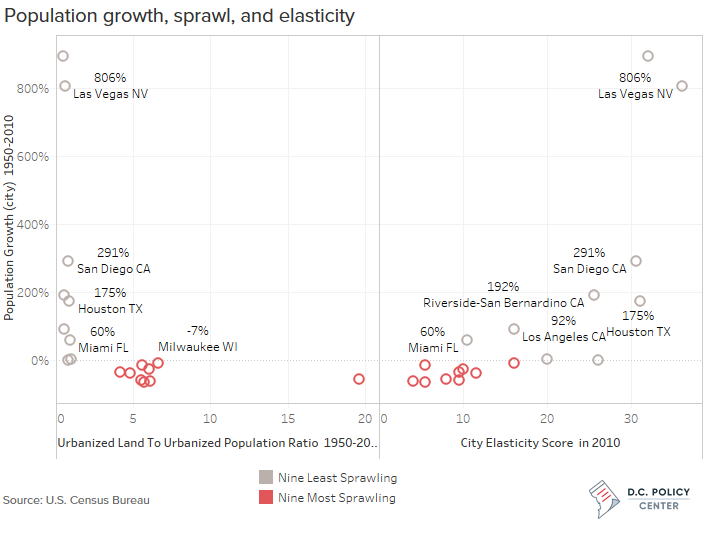
- The nine least sprawling UAs have had to accommodate great population growth. Typically, their populations have expanded seven-fold (694 percent). Population growth has been slow (57 percent) in the nine most sprawling UAs.
- For central cities, the ability to expand their boundaries (as reflected in their “elasticity score”) and strong population growth go hand in hand. Collectively, “elastic” central cities (see the appended note for description) in the least sprawling UAs almost quadrupled population. All annexed new land. By contrast, of the central cities in the most sprawling UAs, all except Milwaukee were trapped within their pre-1950 city limits; in the Age of Sprawl such “inelastic” cities lost residents (on average, they lost 39 percent). Even as inelastic city neighborhoods hollow out, census block populations never fall so low than they become non-urbanized. Such cities are spreading fewer residents over the same amount of city land.
Elastic cities captured urbanized population growth; inelastic cities’ population loss merely contributed to suburban growth.
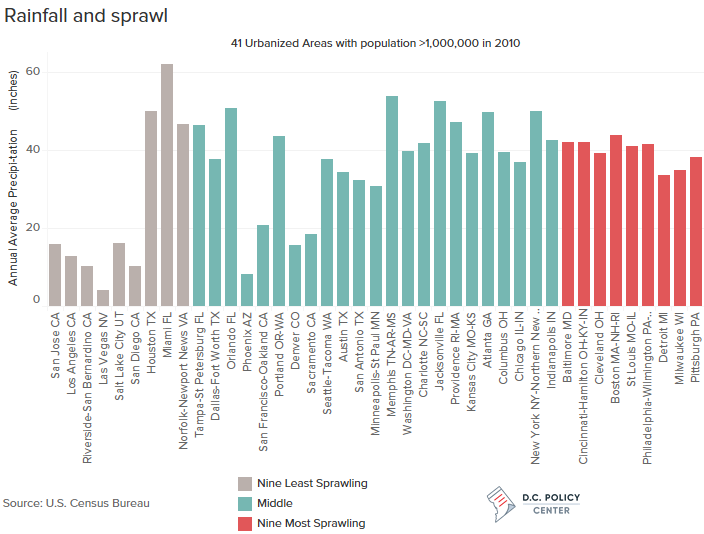
- Rainfall counts. The six least sprawling UAs are all located in arid or semi-arid regions, averaging from 4 inches annual rainfall (Las Vegas) to 16 inches (San Jose and Salt Lake City). New homes typically can be built only as part of subdivisions hooked into municipal water systems–and built to city-prescribed densities.
- Regional governance structure also counts. The twenty least sprawling UAs are all in “Big Box” states with large, elastic central cities, relatively few incorporated suburbs, and county governments having power over unincorporated land. “Big Box” cities and counties can pick and choose where new development will – and won’t – occur if they want to.In contrast, the eight most sprawling UAs are in “little boxes” states. Small cities, villages and towns or townships proliferate everywhere. Absent state mandates, multi-municipal growth management is impossible; every “little box” is consumed by the chase for tax rateables—that is, any means of growing its real property tax base—to be fussy about new development.
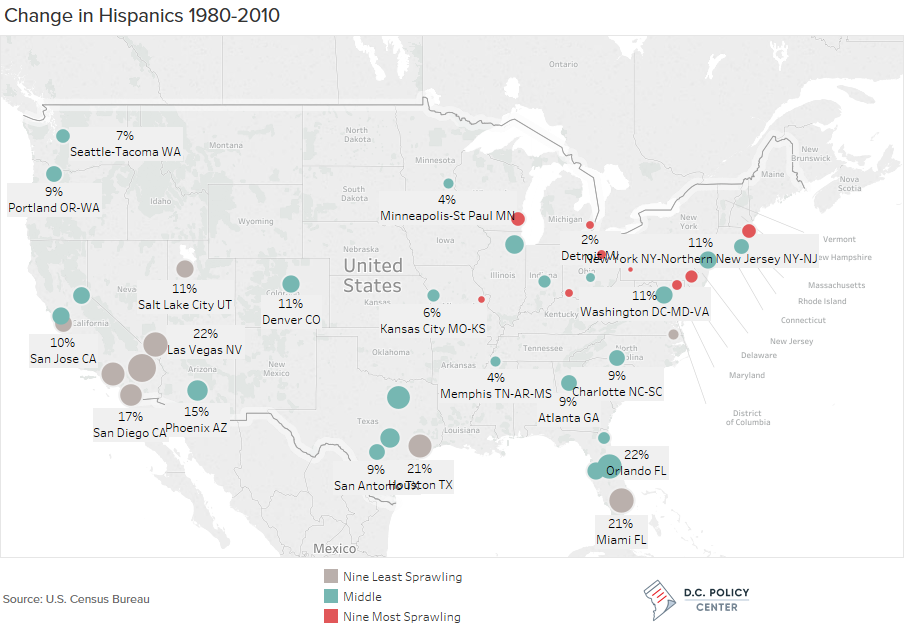
- Finally, the tremendous growth of the Hispanic population has changed growth patterns. Looking again at our extremes, the metro areas containing the nine least sprawling UAs collectively saw the Hispanic population grow from 13 percent of their metro population in 1980 to 30 percent in 2010. The metro areas of the nine most sprawling UAs collectively saw their Hispanic population inch upward from 2 percent to 5 percent.
So where did the Washington DC-MD-VA UA stand on this checklist?
- Substantial population growth (256 percent);
- A not crippling loss of its constitutionally inelastic central city’s population (minus 25 percent by nose count but offset by a 19 percent increase to total households);
- A level of annual precipitation (40 inches) that could engender a lot of large lot, private well-based, residential development, but which is constrained by:
- A “Big Box” governmental structure. Significant planning and zoning power within the UA is effectively controlled by the District, Montgomery County, Prince Georges County (less effectively than its neighbor), Fairfax County, Prince William County, Loudoun County, Arlington County, and Alexandria. That may seem like a lot to local observers but it’s a far cry from the 130 municipal governments that carve up Pittsburgh’s Allegheny County alone;
- A substantial and growing Hispanic population (3 percent to 14 percent in three decades) that tends to concentrate in core communities (e.g. Arlington County) rather than exurban locations (e.g. Stafford County); and,
Finally, there is Metro, whose impact on concentrating jobs and housing within the District and Metro-served suburban nodes has been substantial.
Notes
In Cities without Suburbs (1993) I developed the concept of a central city’s elasticity. In the Age of Sprawl, I consider a city with a lot of vacant or underutilized land, or one which could expand its boundaries through annexation to take in new, largely undeveloped land as “elastic.” A city already largely built up or locked within existing city limits, I characterize as “inelastic.”
The elasticity score combines the effect of a city’s density (population per square mile) in 1950 and the degree to which it expanded its city limits between 1950 and 2010. A city with a low density back in 1950 (compared to others in my list of 163), and which since then has been able to increase its jurisdictional territory would be considered elastic (with the latter metric getting three times the weight in my composite score). The higher the score, the higher the elasticity.
- Inelastic cities included cities like New York City (grouped with Newark, Jersey City, and Paterson); Washington, DC; Detroit; Boston-Brockton-Lawrence-Lowell; St. Louis; Minneapolis-St. Paul; Providence; Pittsburgh; Baltimore; Cleveland; Philadelphia-Wilmington; and Miami.
- Moderately elastic cities were San Francisco (only as paired with Oakland); Cincinnati-Hamilton; Chicago (annexed site of the future O’Hare International Airport); Los Angeles (filled in San Fernando Valley); Seattle-Tacoma; Milwaukee; Norfolk-Newport News (hyper-elastic Virginia Beach is really a municipalized suburban county); Portland OR; Denver; Atlanta; Tampa-St. Petersburg; Riverside- San Bernardino; Sacramento; Salt Lake City; and Columbus OH.
- Highly elastic cities were Memphis; Indianapolis (merged with Marion County); Kansas City MO; San Diego; Dallas-Fort Worth; Houston; San Jose; Orlando; San Antonio; Phoenix; Austin; Jacksonville (merged with Duval County); Charlotte; and Las Vegas.
Download Data
Data is available for download at the D.C. Policy Center Tableau Public page.