
The D.C. Policy Center report “Landscape of Diversity in D.C. Public Schools: What Does School Diversity Look Like in D.C.?” presents a snapshot of racial and ethnic diversity as well as economic diversity in D.C.’s public schools, characteristics of D.C.’s most diverse schools, and how diversity has changed in recent years. Only eight traditional public or public charter schools in D.C. lead in both racial and economic diversity.
Below is a summary of the report and its key findings. For more information, read the full report or download the report as a PDF.
Racially and economically diverse schools are thought to offer various mechanisms — more financial resources or positive impacts from peer exposure, for example — that can improve outcomes for students of all backgrounds, particularly students of color and low-income students. Diverse schools can have life-long impacts on the lives of minorities and disadvantaged students: higher levels of educational attainment, improved adult health outcomes, and lower rates of incarceration (Johnson 2011). White students also benefit from school diversity, which can prepare them for diverse workplaces, lower their levels of prejudice, and build higher levels of cultural competence (Siegel-Hawley 2012) without loss in student performance (National Center for Education Statistics, IES 2015). However, it can be challenging to both attain a diverse student body and to integrate students within a school.
Schools provide potential opportunities to expose students to peers across lines of difference, including other races, ethnicities, and income levels. This report presents a snapshot of racial and ethnic diversity as well as economic diversity in D.C.’s public schools, characteristics of D.C.’s most diverse schools, and how diversity has changed in recent years. While diversity has many dimensions, this analysis focuses on race and ethnicity, and income as measured by students who are at-risk,[1] which is a metric that captures a set of characteristics associated with low opportunities at home.
Looking at diversity in D.C.’s public schools reveals various trends. First, the District’s public school students are less diverse than the school-age population. And many schools are less diverse than the overall student body, suggesting that some schools pool together students of similar racial, ethnic, and income backgrounds. This is partly the result of the extent to which students enroll in their in-boundary schools or schools close to home, and attend school together with other students from their neighborhoods in an economically and racially segregated city. But given the high share of enrollment at public charter schools and traditional public schools from out-of-boundary, there is potential for certain schools to reflect the same amount of diversity as exists across all public school students.
Background
D.C.’s traditional public and public charter schools are more likely to expose students to different income groups than different racial or ethnic backgrounds. Overall, D.C.’s public school students[2] are more concentrated by race and ethnicity than economic status: in 2016-17, 68 percent of students were African American, 18 percent were Latino, and 10 percent were white. In contrast, public school students are more diverse by income levels: 47 percent of students were at-risk (Office of the State Superintendent for Education (OSSE) 2017). However, public schools as a whole are less diverse than the school-age population. African American students and low-income students are over-represented, and white students are under-represented in public school enrollment given demographics of the school-age population.
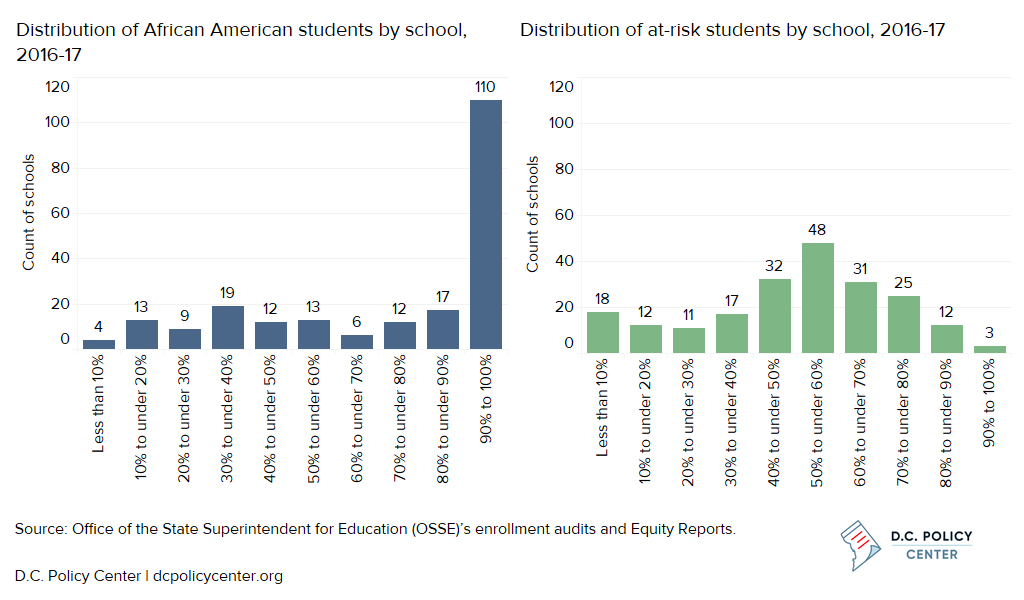
By school, a balance of students by economic status is common while racial and ethnic homogeneity is widespread. Over half of public schools had between 40 percent and 60 percent of students who were at-risk, meaning that about half of students attended schools with a balanced share of students from another economic group (see Executive Summary Figure 1). Only nine percent of schools (18 schools in total) have a student body was less than ten percent at-risk, compared to one percent of schools (three schools in total) with at least 90 percent of at-risk students. By comparison, the distribution of African American students was extremely imbalanced. Half of D.C.’s public schools with students in pre-kindergarten through grade 12 had a student body that was at least 90 percent African American, meaning that many students did not attend school with peers from other racial or ethnic groups.
Figure 1. Distributions of African American students and at-risk students
Public schools in D.C. were legally segregated until the Bolling v. Sharpe and Brown v. Board of Education Supreme Court decisions in 1954. However, these decisions didn’t lead to immediate integration in D.C. public schools and were accompanied by white flight: from 1954 to 1957, the school district lost 4,000 white students and gained 4,000 African American students each year (Orfield and Ee 2017). Legally, integration efforts continued with Hobson v. Hansen, which struck down the tracking system as inequitable in 1967, and found that the per-pupil funding in D.C. public schools was unjust in 1971. Along with this de jure progress, there have been small gains in desegregation: the percent of African American students attending schools with 90 to 100 percent of minority students decreased from 96 percent in 1992-93 to 88 percent in 2012-13 (Orfield and Ee 2017). And the population shifted in recent years: from 2010 to 2016, the city added more white residents (about 38,000) and Latino residents (about 19,000) than African American residents (about 15,000) on net (United States Census Bureau 2016).
This report provides a snapshot of diversity in D.C.’s public schools over 60 years after court-ordered desegregation at a time when enrollment in the city’s public schools is growing and the demographics of the student body are changing. Between 2014-15 and 2016-17, public schools added over 4,500 pre-kindergarten to grade 12 students. Over this same period, the proportion of African American students decreased by four percentage points, the proportion of Latino students increased by three percentage points, and the at-risk student population declined by three percentage points (Office of the State Superintendent for Education 2015) and (Office of the State Superintendent for Education (OSSE) 2017).
Measuring current diversity in D.C. schools
This report examines diversity in D.C.’s public schools by developing a score for how exposed students are to those from other economic or racial and ethnic groups. A school’s diversity score is the share of its non-plurality group (see Box 1). This gives a sense of the extent to which different groups are represented, which increases the potential for interaction between groups.
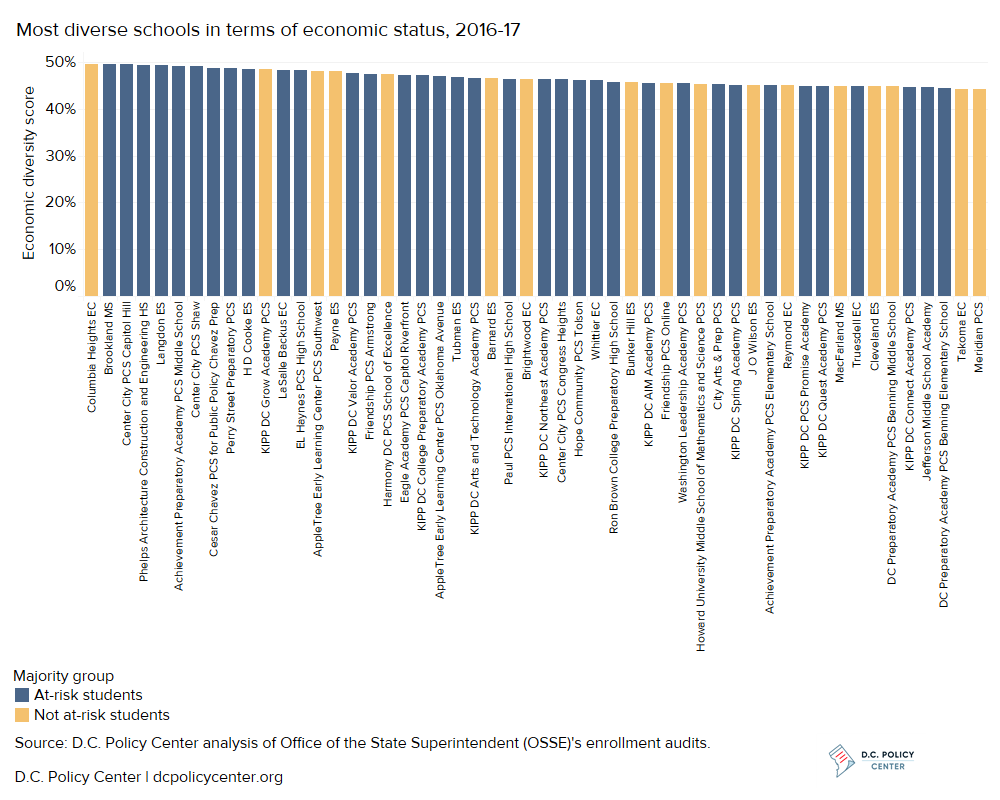
Box 1. Measuring diversity
The analysis uses the sum of share of non-plurality groups among enrolled students to provide an absolute and intuitive measure of diversity. The larger the sum, the more diverse the school. The two diversity scores cannot be compared directly because the distributions of student demographics differ for the underlying data, which means the potential scores are not the same.
The diversity scores purposefully exclude information about the school’s neighborhood characteristics, and intentionally measure diversity in absolute terms primarily because there is a high degree of public school choice in D.C. Just 27 percent of students attended their in-boundary traditional public school in 2016-17. This permits D.C.’s schools to be more integrated than their neighborhoods in theory. Other established methods did not allow for consideration of the three primary races and ethnicity of D.C.’s students, or were overly complicated to interpret (see Appendix II | Methodology).
The report intentionally analyzes both racial and ethnic diversity as well as economic diversity to provide a fuller picture of exposure to students from other groups. However, there are some limitations to interpreting economic diversity scores, which are based on the percentage of students who are at-risk. At-risk data provides the best information on economic status, as the percentage of economically disadvantaged students (or the percentage of students receiving free or reduced price lunch) is not available for the three-quarters of schools in D.C. given data complications.[3]
Key findings
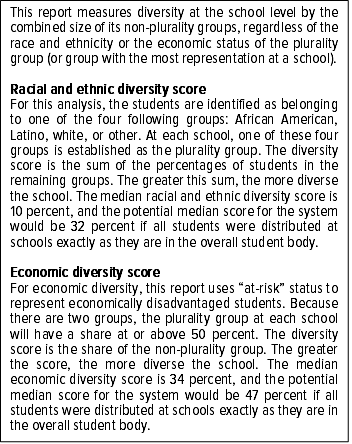
Racial and ethnic diversity is low, even considering the composition of D.C.’s students. The median racial and ethnic diversity score is ten percent compared to a potential median score of 32 percent, which would occur if all students were distributed as they are in the overall student body. A median score of ten percent means that half of schools have one group (usually African American students) representing 90 percent or more of all enrollment. The most racially and ethnically diverse schools are more likely to have a Latino or white plurality group (see Figure 2).
Figure 2. Most racially and ethnically diverse schools
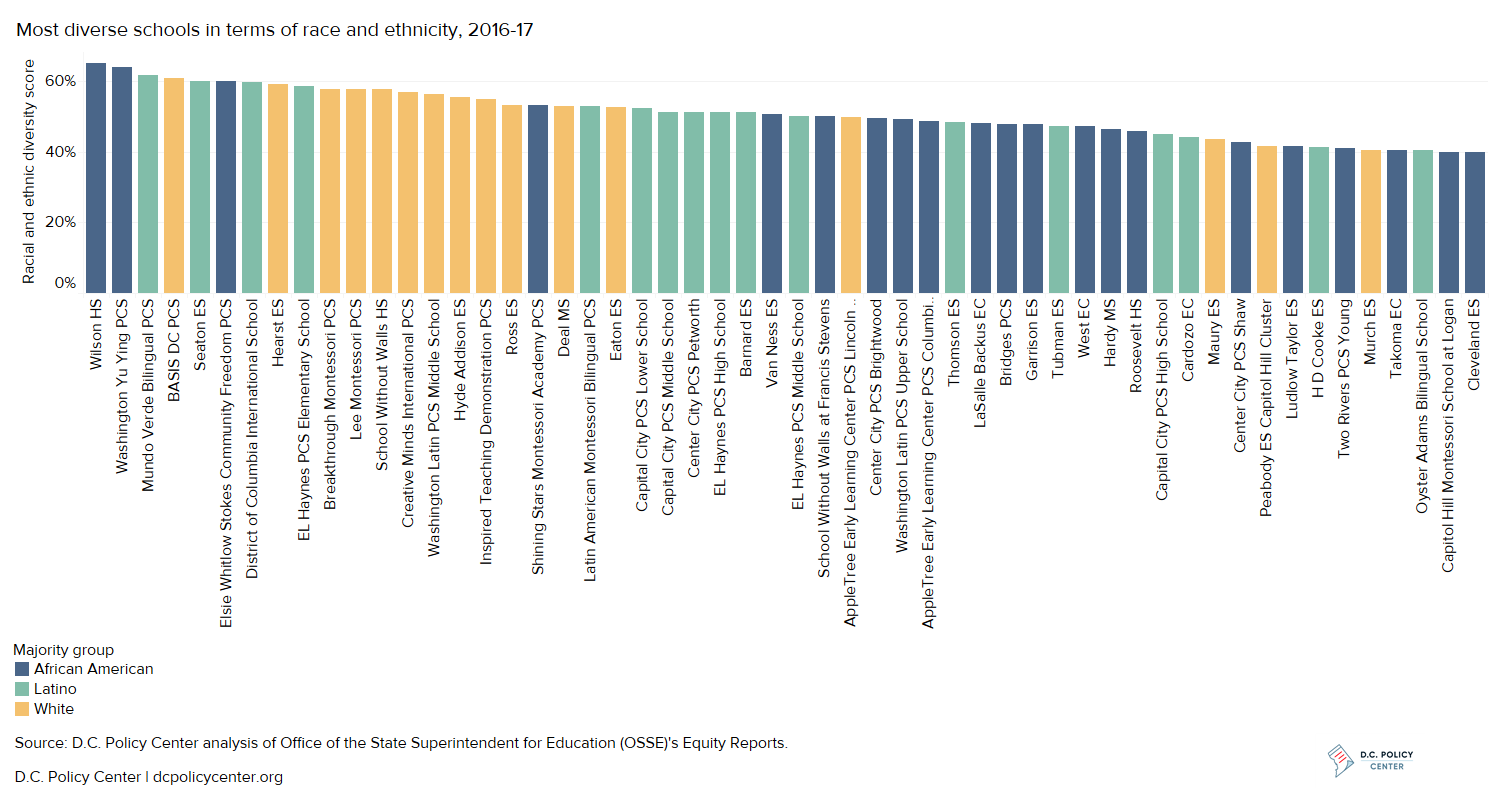
Schools are more likely to have students from a mix of economic backgrounds. The median economic diversity score is 34 percent compared to a potential median score of 47 percent, which would occur if all students were distributed as they are in the overall student body. This means that half of schools have a student body with a concentration of students that is no more than 66 percent at-risk or not at-risk. The most economically diverse schools tend to have student bodies that are majority at-risk (see Figure 3).
Figure 3. Most economically diverse schools
School choice tends to be accompanied by economic diversity, and attending neighborhood schools of right at high rates tends to go along with racial and ethnic diversity. Economic diversity is higher at public charter schools than at District of Columbia Public Schools, or DCPS (with a median score of 38 percent at public charter schools compared to a median score of 28 percent at DCPS schools). Racial and ethnic diversity is higher at DCPS schools than public charter schools (with a median score of 21 percent at DCPS schools compared to a median score of 5 percent among public charter schools). Racial and ethnic diversity is higher in a subset of DCPS schools with higher in-boundary participation and lower percentages of at-risk students than other DCPS schools.
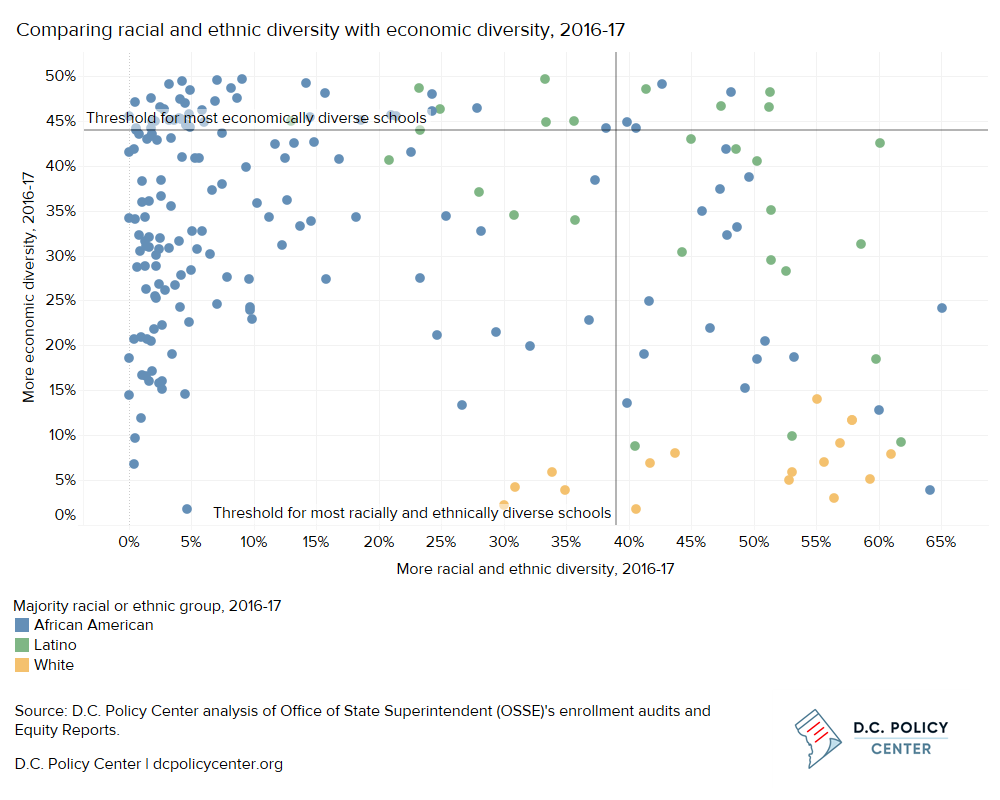
There is little overlap between two types of diversity at the majority of schools and in eastern and western Wards. Using the 75th percentile of scores in each category to highlight the schools that are most diverse, only eight schools are the most diverse in both categories: EL Haynes PCS High School, Barnard ES, LaSalle Backus EC, Tubman ES, Center City PCS Shaw, H D Cooke ES, Takoma EC, and Cleveland ES. None of these schools have a plurality of white students, and only one is a high school. All but one is located in Ward 1 or 4. Other patterns emerge: schools with a plurality of African American students vary in terms of economic diversity while schools with a plurality of white students have high racial and ethnic diversity but low economic diversity (see Figure 4). Geographically, there is a lack of economic diversity in Wards 2 and 3 and a lack of racial and ethnic diversity in Wards 7 and 8.
Figure 4. Overlap in racial and ethnic and economic diversity
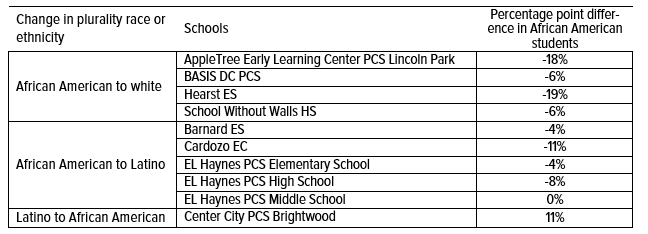
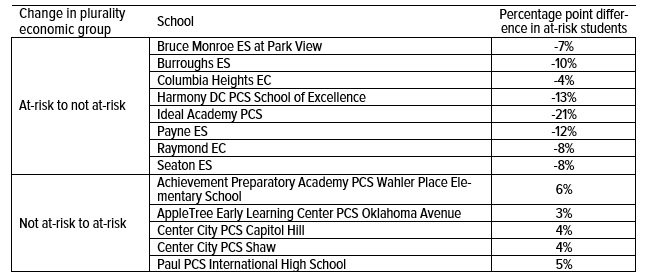
For the majority of schools, diversity has not changed in the short term, but some schools are experiencing large shifts. From 2014-15 to 2016-17, the median school saw a one percentage point increase in its racial and ethnic diversity score and no change in its economic diversity score. When change did occur, schools located east of the Anacostia River mostly became more economically diverse and schools located west of Rock Creek Park mostly became more racially and ethnically diverse. Changes in racial and ethnic diversity resulted from shifts in both white and Latino populations. A few schools switched their plurality group entirely: out of 194 schools, ten changed their plurality race or ethnicity and 13 changed their plurality economic group (see Executive Summary Table 1 and Executive Summary Table 2). No school shifted in both categories.
Table 1. Schools that changed plurality racial and ethnic group from 2014-15 to 2016-17
Executive Summary Table 2. Schools that changed plurality economic group from 2014-15 to 2016-17
Implications
The city’s schools have a long way to go to achieve racial and ethnic diversity even given demographics of the current student body, but economic diversity has the potential to decrease as less students are identified as at-risk (meaning the balance between students from different economic groups will no longer be close to 50 percent). To maintain and increase diversity, schools that want to be diverse need to focus on both race and ethnicity and economic status, especially at the 18 schools with less than ten percent of students who are at-risk that tend to also have very high waitlists.
There is room for diversity to improve. if students were distributed across public schools as they are in the overall student body, the median racial and ethnic diversity score would be 32 percent (higher than the current value of 10 percent) and the median economic diversity score would be 47 percent (higher than the current value of 34 percent). As the student body is changing to become more diverse racially and ethnically and less diverse economically, there will be more opportunities to improve racial and ethnic diversity.
A diverse student body is not sufficient to realize the benefits from diversity – the right school-level approaches that involve staff, students, and families are necessary to enable true integration. If more diversity is achieved, schools need to commit to diversity as part of their missions, in ways that include equitable resource allocation within the school, strong relationships between students and staff, use of restorative justice, and teachers and staff that represent the student body (Potter and Quick 2018). For example, the RIDES project at Harvard University emphasizes the following ideal outcomes for all students: strong academic preparation, a sense of belongingness, commitment to dismantling racism and oppression, and appreciation of diversity (RIDES 2018). Locally, Kindred focuses on building authentic relationships between diverse groups of parents to improve equity within schools (Kindred 2018).
Better data with more details on economic status (free or reduced lunch, for example) would allow for a more informed discussion of economic diversity. The current measure of at-risk is binary and includes students along income-based criteria (receiving Temporary Assistance to Needy Families (TANF) or Supplemental Nutrition Assistance Program (SNAP) benefits) as well as those undergoing specific adverse experiences (homelessness or foster care) or those who are over-age in high school. The annual income thresholds for benefits program differ (approximately $9,000 for TANF and $49,000 for SNAP for a household of four in 2018-19), but data are not available on the number of students who receive one or the other.
Click here to read the full report or download the report as a PDF.
Chelsea Coffin is the Director of the Education Policy Initiative.
The author is grateful to the Walton Family Foundation and Education Forward DC for their generous support of the Education Policy Initiative. The paper benefited from helpful feedback and input from Matt Chingos, Gina Chirichigno, Steven Glazerman, Scott Goldstein, Irene Holtzman, Nathan Joo, Sara Mead, Arthur McKee, Ginger Moored, Halley Potter, Genevieve Siegel-Hawley, Ramin Taheri, Jon Valant, Conor Williams, and Betsy Wolf. At the D.C. Policy Center, Yesim Sayin Taylor and Kathryn Zickuhr offered crucial guidance, and Simone Roy and Clare Zaytoun provided valuable research assistance.
[1] The at-risk category includes students who receive Temporary Assistance to Needy Families (TANF) or Supplemental Nutrition Assistance Program (SNAP) benefits, are homeless, are involved with the foster care system, or over-age in high school.
[2] Here and throughout, the term public schools refer to both traditional public (District of Columbia Public Schools, or DCPS) and public charter schools).
[3] In D.C., almost three-quarters of schools meet the requirements for the Community Eligibility Provision that provides all students with free lunches without submitting FARM applications. This means that data on economic disadvantage are limited. However, estimates are likely to be similar: 92 percent of students who are considered at-risk receive SNAP benefits (Office of the State Superintendent for Education (OSSE) 2018), which has an income eligibility of 200 percent of the federal poverty level. This is similar to the income eligibility requirements of reduced lunch, which is 185 percent of the federal poverty level.
Photo credit: U.S. Department of Education, photo of Watkins Elementary School.