
A new analysis of recently-released American Community Survey data shows that commute times have increased gradually nationwide and in the D.C. metropolitan area in recent years. Among the 100 largest metro areas, the D.C. metro area has a longer average commute time in 2016 than every metro area except for New York City. In addition, when and how workers commute varies across the D.C. metro area, with differences varying most between D.C. and the outer suburban counties.
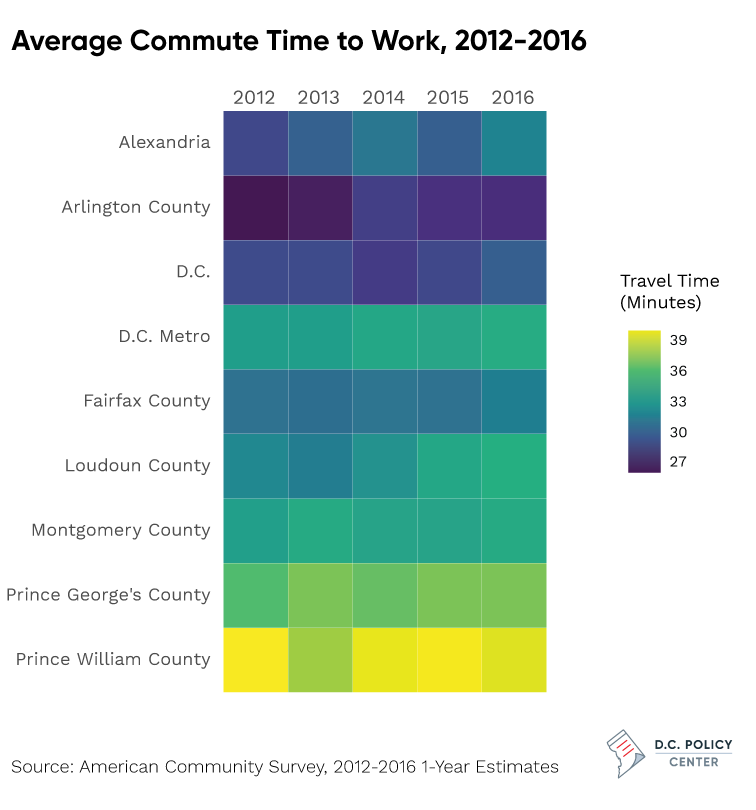
Average commute time has increased somewhat for many counties in the metro region
The average commute time for the D.C. metro area was 34.8 minutes in 2016. Looking only at changes from the previous year, it appears that there were only small changes in overall commute time from 2015 to 2016, but changes in some jurisdictions were more pronounced. For instance, the average length of commute by public transportation in the District of Columbia increased from 36.9 minutes in 2015 to 39.5 minutes in 2016. Additional analysis suggests that increases in overall commute time were largely driven by increases in commute time for public transportation users.
Commute times lengthened for drivers and public transportation riders
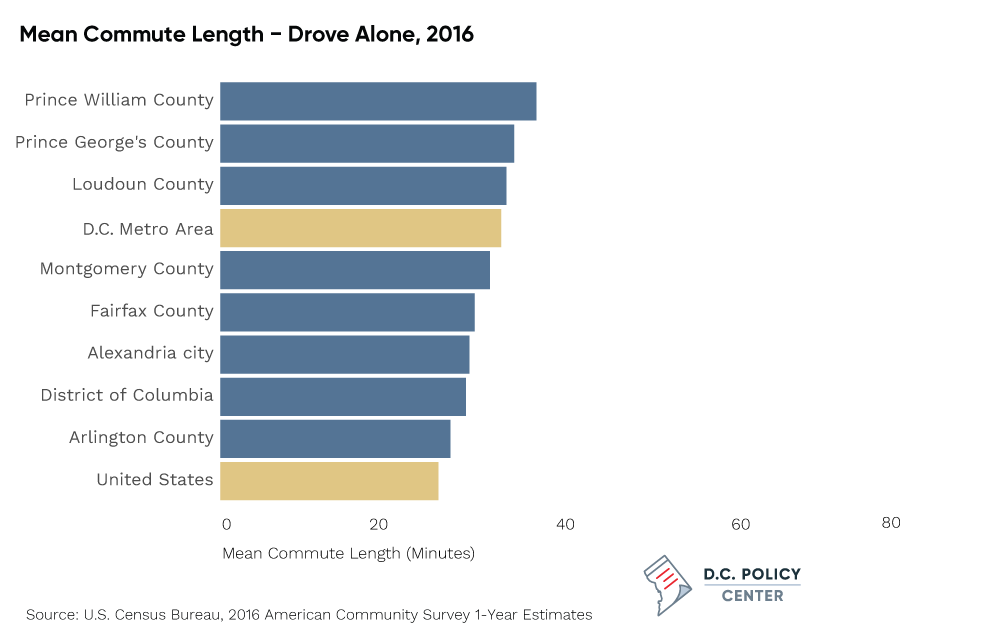
As of 2016, the average commute time among those who drove alone to work in the D.C. metro area is 32.7 minutes, seven minutes longer than the nationwide average (25.4 minutes). The average public transportation commute time in the D.C. metro area (49.2 minutes) is similar to the nationwide average (50.1 minutes), with public transportation commute times in Alexandria, Arlington, and D.C. significantly lower than the nationwide average.
In the District of Columbia, the average public transportation commute time was up 2.6 minutes compared with the previous year [1], from 36.9 minutes in 2015 to 39.5 minutes in 2016. The average commute time among those who drove alone to work likewise increased two minutes from 2012, from 26.6 minutes to 28.6 minutes. In Arlington, there was an increase in commute time from 2012 to 2016 of 2.2 minutes among workers who use public transportation.
![]()
A higher proportion of workers are experiencing long commutes
In several jurisdictions, there was an increase in long commutes (defined by the Census Bureau as commutes of 60 minutes or longer), particularly among public transportation users. Long commutes were already common among workers who reside in Loudoun, Montgomery, Prince George’s, and Prince William counties—counties that did not experience significant increases in long commutes like D.C., Arlington, and Alexandria did.
In D.C., the percent of workers with long commutes fluctuated between a low of 7.8 percent in 2014 and a high of 9.8 percent in 2016. In 2013, 4 percent of Arlington residents had a long commute, but in 2016, 7.9 percent had a long commute. Public transportation users had an even greater increase in long commutes. The percent of Arlington public transportation users with a commute of 60 minutes or more increased from 7.7 percent in 2012 to 12.2 percent in 2016.
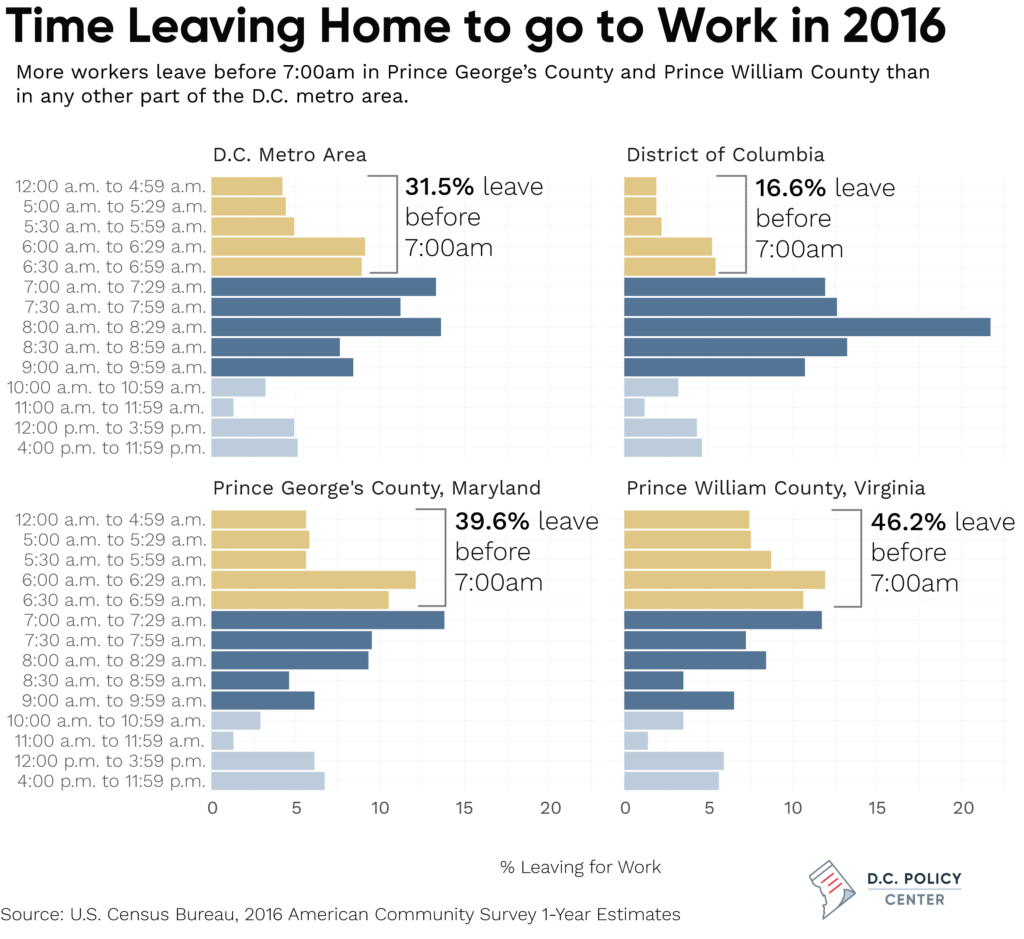
The majority of workers leave for work by 8 a.m.
In the D.C. metro area overall, workers left most often between the 7 – 7:30 a.m. and 8 – 8:30 a.m. time periods. In the D.C. metro area, 72.1 percent of workers left for work between 6 – 10 a.m. Workers tend to leave earlier in Prince George’s County and Prince William County, with a higher proportion of workers leaving before 7 a.m. (39.6 percent in Prince George’s County and 46.2 percent in Prince William County) than in other jurisdictions.
Explore this data for the rest of the D.C. Metro area on Tableau.
Proportion of D.C. workers commuting by public transportation has declined slightly
In the D.C. metro area overall, and in all jurisdictions except D.C., most workers drive to work. Public transportation use is highest in D.C. (36 percent), though the percent of workers using public transportation in D.C. has fallen slightly since 2013 (when it was 38.5 percent). Public transportation use is lowest in Loudoun County (3.4 percent) and Prince William County (4.1 percent) – the only jurisdictions included here that do not have a Metro station.
In 2016, among workers who live in D.C., 13.7 percent walked to work in 2016, while 4.6 percent biked to work. This is likely due to the infrastructure available for pedestrians and cyclists, as well as having a shorter distance to travel. In the D.C. metro area, just over half (50.6 percent) of workers work within their county of residence (or county-equivalent), while three-quarters (75.6 percent) work within their state of residence. Workers who live in D.C. are the most likely to live in the city in which they work – 75 percent work in D.C.
In addition, working from home has gradually become more common in the past few decades. In the D.C. metro area, 5.7 percent of workers worked from home in 2016. The percent of workers who worked from home ranged from 3.3 percent of workers in Prince George’s County to 8.2 percent in Loudoun County, including 6 percent of workers in D.C.
About the data
The analysis and charts in this piece were based on American Community Survey 1-year estimates, available at the following links:
- Table S0801: Commuting Characteristics by Sex: used for means of transportation and place of work
- Table S0802: Means of Transportation to Work by Selected Characteristics: used for mean travel time by means of transportation
- Table B08302: Time Leaving Home to go to Work
American Community Survey data on commuting (journey to work) includes workers aged 16 and over. Travel time includes only workers aged 16 and over who did not work from home. Commute time measures the travel time from home to work.
American Community Survey 1-year Estimates are only available for jurisdictions with populations of 65,000 or more, so data for certain jurisdictions within the D.C. metro area (e.g. the City of Fairfax or City of Falls Church) was unavailable.
Margin of error was considered when determining whether changes in estimates were statistically significant enough to include. In cases where the margin of error is large, it is difficult to determine whether year-to-year differences are the result of an emerging trend or sampling error. In some cases, differences between 2012 and 2016 estimates were statistically significant, but differences between 2015 and 2016 estimates were not; the differences highlighted in the text of this piece were all statistically significant at the 90 percent confidence interval.
An in-depth look at the analysis can be found here on our data blog.
[1] (Update, 9/27/2017) SafeTrack began on June 4, 2016, and other sources indicate that this had an impact on commutes in the D.C. area. However, it’s unclear whether Safetrack’s implementation is directly related to the year-by-year changes observed in the ACS data, because the week in which ACS respondents were surveyed in 2016 is unknown (and is not the same for all respondents).
Feature photo by Ted Eytan (Source).
Simone Roy is a Research Associate at the D.C. Policy Center.