

This report examines how providers of housing for youth experiencing homelessness obtain their funding (sources of funds), how they spend this funding (uses of funds), how these vary across providers and program types, and what role D.C. government funds play in the finances of the providers. The report also presents some information on how the COVID-19 pandemic impacted the providers and what they see as risks to their financial models in the coming years. This information helps inform the city about housing capacity and funding levels.
You can read the full report in this pdf, or in the text below.
Introduction
In 2017, the District of Columbia published its first data-driven strategic plan—Solid Foundations DC1—to make youth homelessness a rare, brief, and nonrecurring experience. The plan called for a comprehensive system that can help prevent youth homelessness, or significantly reduce the duration over which youth experience homelessness by creating stable housing for youth with adequate supports necessary for improving the social and emotional wellbeing of the youth, enable meaningful access to education, training, and a livelihood, and create an environment so youth can make permanent connections to their communities.
Figure 1: DHS funding for organizations serving youth who are experiencing homelessness, Fiscal years 2018 through 2023
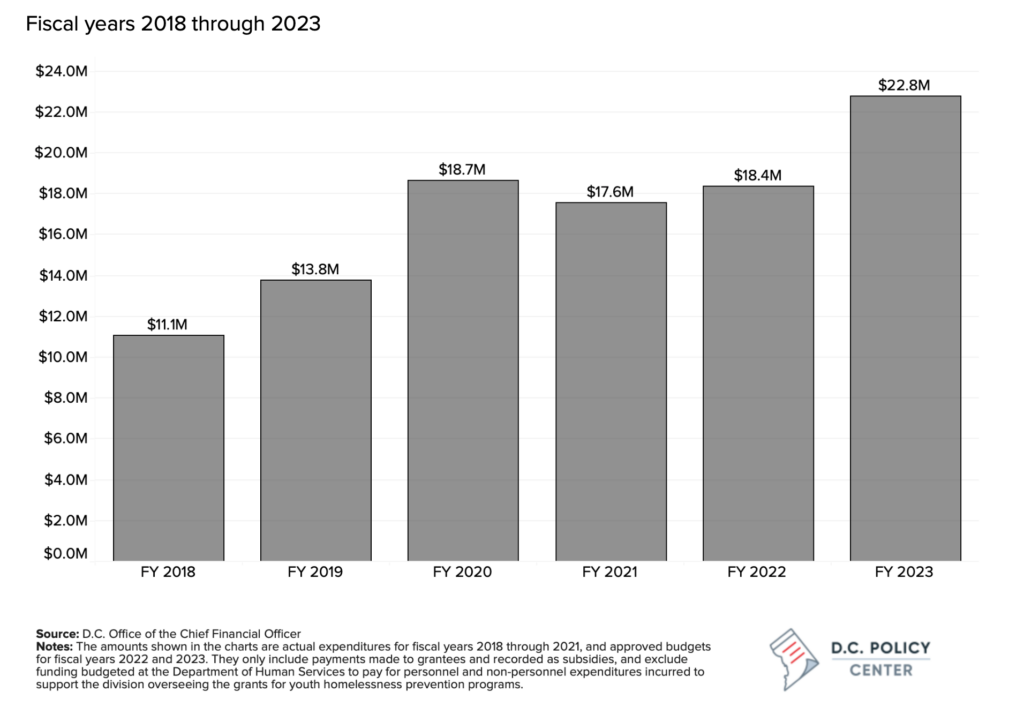
Solid Foundations DC was put into action beginning in fiscal year 2018, with increased investments to expand services available to youth, including rapid rehousing, extended transitional housing, and a drop-in center that provides 24-hour care for youth in need of help. In fiscal year 2018, the District made available a total funding of $11.1 million to partner organizations that provided supports and services to youth experiencing homelessness. By fiscal year 2020, that amount had increased to $18.7 million, and has since then stayed at about this level (with the exception of FY 2023, when the city was able to make additional investments using temporary federal funds received through the American Rescue Plan Act).2 In fiscal year 2021, which is the subject of this report, DHS directly funded 25 different programs across 12 providers that provided 373 youth-dedicated beds. In preparing Solid Foundations DC, the Interagency Council on Homelessness worked with providers of existing programs to estimate the unit cost for each proposed program model that would be a part of the system (emergency shelter, transitional housing, rapid re-housing, etc.), in order to help with budget planning. However, at that time, there was not adequate information on the costs of services because of the relative infancy and smaller size of the youth system, and the historic underfunding of the youth homeless services, which meant that existing budgets reflected what is available and not what is needed. Thus, Solid Foundations DC called for a reevaluation of the costs once the programs scaled up. This report has been prepared to fulfill this requirement.
Notes on the methodology
This report is a public expenditure analysis of the providers that receive direct grant funding from the D.C. Department of Human Services (DHS) and serve youth who are experiencing homelessness. Youth are defined as individuals under 25 years of age who are unaccompanied by a parent, guardian, or spouse. Parents under 25 years of age who have their children with them are also considered unaccompanied. The report analyzes both how providers generate their revenues (sources of funds) and how they spend these resources (uses of funds), and the role the DHS grants play in this fiscal picture.
The work on this report began in early 2022 and therefore the data and analyses presented in the report are focused on fiscal year 2021. In conducting this cost analysis, the D.C. Policy Center worked with 12 service providers that were receiving direct funding from DHS in that fiscal year. For informational purposes, the report also includes grant budget data for providers for fiscal year 2022.
The goal of the report is to examine how providers obtain their funding (sources of funds), how they spend this funding (uses of funds), how these vary across providers and program types, and what role D.C. government funds play in the finances of the providers. The report also presents some information on how the COVID-19 pandemic impacted the providers and what they see as risks to their financial models in the coming years. It is important to note that DHS-funded programs are a subset of all programs in the District of Columbia serving youth who are experiencing homelessness. In 2021, there were 17 providers that collectively offered 1,347 youth-focused beds across 47 different programs. DHS-funded programs are also a subset of all programs offered by the 12 providers who were grantees in 2021. In 2021, DHS funded 25 youth-focused programs offered by these 12 providers. That year, these providers offered 63 programs that were youth-focused or for families or individuals experiencing homelessness. That is, DHS funding is a share of all revenue raised by these providers, including revenue from federal funds, private grants, and other types of donations. Because the fiscal health of providers depends on their ability to meet expenses across all programs that they offer, the report presents this broad picture of funding, and not just DHS-funded programs.
This analysis is subject to the following limitations:
- First, the report uses information on the types of revenue that providers received each year through their IRS tax filings, but not all providers filed their IRS 990 forms for the five-year period (2017-21) that we analyzed. Rather than 60 data points (12 providers each filing a form for five years), the analysis relies on 29 data points.
- Second, data from IRS filings do not include information on how much of this funding is unrestricted, and how much could be used across programs. It is possible that a provider could finish the year with a surplus, but not be able to use this surplus freely. The funding providers receive from the DHS is restricted—only 10 percent of the funding can be used for overhead.
- Third, the cost analysis cannot distinguish between the expenditure needs of transitional and extended transitional housing programs. The differences between the types and the intensity of services offered between transitional and extended transitional housing can result in different expenditure needs but the analyses cannot separate those services. This is because program information collected at the federal level does not make a distinction between transitional and extended transitional housing.
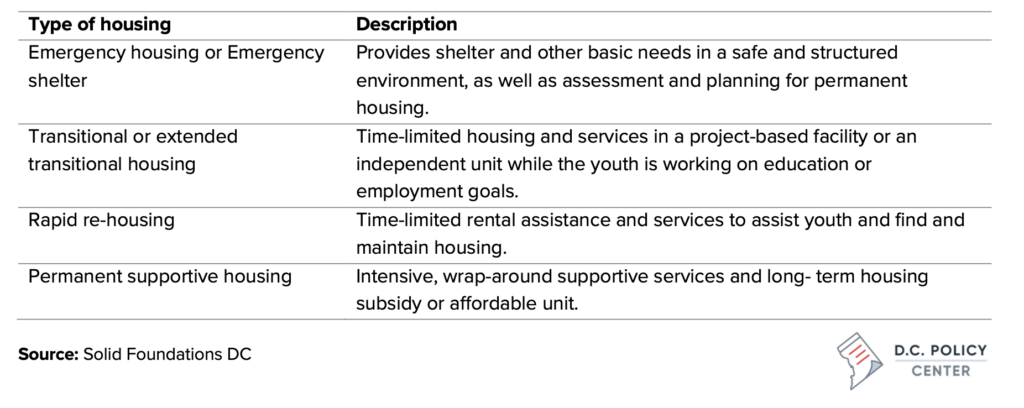
Table 1: Type of housing services provided to youth who are experiencing homelessness
Data sources
The financial information presented in this report relies on multiple sources of data that include detailed budget information obtained from the Office of the Chief Financial Officer, grant budget information for each provider obtained from DHS, filed IRS 990 forms for providers, and when available, financial audits for providers. Additionally, the D.C. Policy Center distributed a questionnaire to DHS-funded providers seeking detailed information on the capacity of each services provider, the nature of services offered, and revenue and cost structures. The D.C. Policy Center conducted pre-survey interviews with a subset of these providers, as well as follow-up interviews to dig deeper into the cost structure of the programs.
Presentation of results
The report is a system-wide analysis of the funding and cost structure of service providers; therefore, findings are presented across all programs, without specific information on any single provider. Additional data are presented by program type and provider capacity.
Summary of findings
The key findings of the report include the following:
Overall, youth homelessness appears to be on the decline, but there is great uncertainty about the future. Data from the PIT count and estimates developed by the D.C. Policy Center using the 2019 Census trends suggest that the number of youth experiencing homelessness or at imminent risk of becoming homeless decreased significantly between 2016 and 2019, but improvements have been slow since then. The D.C. Policy Center estimates that in 2021, there were 753 youth under the age of 25 experiencing homelessness or in imminent danger of becoming homeless, compared to over 1,200 youth in 2016. However, the 2021 PIT count did not include unsheltered individuals, and capacity restrictions during COVID may have artificially depressed the number of youth arriving at emergency shelters (which can provide youth with other housing options). One troubling trend is the increase in the number of unaccompanied youth captured in the PIT counts since 2015. Between 2015 and 2021, the PIT counts indicated that the overall incidence of homelessness in D.C. declined by 35 percent. However, during the same period, the incidence of homelessness among unaccompanied youth under the age of 25 in the city increased steadily—from 183 to 311, or by 67 percent.
The District’s youth housing support system has grown stronger, with twice as many beds dedicated to youth in 2021 as compared to 2017. In 2021, there were an estimated 1,347 beds available in the District of Columbia for youth experiencing homelessness through 17 different service providers offering 48 different types of programs. The majority of the 48 distinct programs offer interim housing for youth: in addition to five emergency shelters which provide basic needs in a safe and structured environment, there are 34 programs that offer transitional or extended transitional housing, providing time-limited housing and services in a project-based facility or an independent housing unit where youth can receive supports to meet their education or employment goals. In addition, five programs with 150 beds total offer permanent supportive housing options for youth who are facing complex challenges, and four programs with 426 beds offer rapid rehousing options to youth aged 18 to 24, providing youth with a limited-time rental assistance as they rebuild their lives.
Programs funded by DHS are concentrated in emergency, transitional, and extended transitional services. In 2021, the DHS funding supported 25 programs run by 12 different service providers with 373 youth-dedicated beds. Emergency shelters and transitional and extended transitional housing account for 70 percent of capacity. In addition, there are seven programs serving LBGTQ youth with 82 dedicated beds, one program with eight beds focused on youth who have experienced domestic violence, and one program focused on pregnant and parenting youth. Capacity funded by DHS accounted for 39 percent of all youth-dedicated beds across these 12 providers.
DHS-funded programs are typically run by experienced service providers with broad portfolios.
A typical provider has at least 10 years of experience working in the housing space, and many have over 20 years of experience. They tend to offer at least two different types of housing programs—and many offer more—and most serve clients other than unaccompanied youth as well (i.e., individuals and families experiencing homelessness): youth-dedicated beds across these programs make up over 25 percent of their full capacity. But across emergency and transitional housing programs, youth-dedicated capacity accounts for over 90 percent of all capacity. In addition to case management, all providers offer additional wrap-around services to the youth they serve—most commonly education and health, including mental health services followed by career services.
Providers mix multiple streams of funding to serve their clients. The largest source of funding for providers is government grants, which make up on average 63 percent of revenue received by providers. Government grants tend to be a larger share of overall revenue for smaller providers. Providers also receive funding from individual donors, philanthropic organizations, and occasionally corporations. These grants and gifts account for another 24 percent of program revenue. Other sources of funding include fundraising events or campaigns, non-cash contributions, and program service revenue. According to data reported by the service providers, D.C. government funding accounts for about 44 percent of revenue. Federal funding, including funding received through community-based organizations, is reported at 23 percent, and philanthropic donations are about 20 percent of overall revenue.
Personnel costs constitute the main cost driver for service providers. Across providers, employee or contractor compensation averaged at 46 percent of all spending but could be as high as nearly 70 percent of budgets for some organizations. Compensation expenses as a share of budgets declined over time, but providers have mentioned the need to increase wages for staff to retain employees and attract new staff. Providers have been increasing the share of their budgets allocated to other types of expenditures, especially contracted services such as cleaning, maintenance, transportation, or food services. Administrative contracts—for accounting and financial management type services, for example—are rarely used. Fixed costs, which include rent, insurance, and utilities, make up 11 to 13 percent of budgets. Expenses associated with fundraising and administrative needs are modest and consume about 5 percent of organization resources.
Service providers are usually able to cover their costs, but their margins are too thin to build reserves that can provide financial resiliency. The median organization finished each year with an operating surplus equivalent of 6 percent of total revenue. This is a small margin, leaving little room for flexibility and scant resources for creating a healthy reserve fund. This means it is generally difficult for housing providers to build robust reserve funds, which makes it difficult to manage cash or cover occasional shortfalls. In fact, the most commonly mentioned financial risk by the service providers is cash-flow management. Many providers report having a reserve, but these tend to be small, providing cash that can cover about three months of operations. When faced with a shortfall, organizations sometimes ask donors to cover the gap, sometimes borrow from a bank, or use a line of credit.
Finding resources to replace the loss of Paycheck Protection Program grants, increased costs associated with COVID-19 protocols, and rising wages and salaries are the biggest financial risks.
Providers report increased costs driven by the COVID-19 pandemic—especially the costs associated with cleaning. Other sources of cost increases are staff salaries which, providers note, need to be increased to keep existing staff or attract new staff. While PPP loans have provided much needed relief in 2020, most providers had a difficult time filling the gap. There are other risks that impact provider finances. Some organizations have struggled with contract requirements, and sometimes had to wait long periods for reimbursements. Others note that when a candidate is identified, the process of putting them through various clearance processes such as the D.C. Child Protective Registry and the criminal background checks can take much longer than what is tolerable for a waiting candidate.
Providers invest modest amounts in administrative capacity. Expenses associated to fundraising and administrative needs are modest and consume about 5 percent of organization resources, suggesting that providers do not set aside funds for capacity building. This is evident in IRS 990 filings: For the five-year period examined in the report, only half of the IRS 990 filings could be located. Additionally, problems with delayed payments and contract execution could also be a function of to weak administrative capacity.
Provider unit costs vary greatly even across programs in the same housing category. Estimated unit costs–the cost per bed per year, including wraparound services–show a wide variation across providers and years, with an estimated median unit cost of $49,700, and an interquartile range of $40,700 to $63,100. The variation in unit costs is smallest for operators of emergency shelters: the median unit cost for emergency shelters is estimated at $44,200 and the interquartile range is narrow, ranging between $41, 500 and $45,200 per bed. In contrast, transitional and extended transitional housing programs—and services included within—can look very different across providers and therefore have a wide range of unit costs. The interquartile range of unit costs for providers that primarily provide transitional and extended transitional housing services is between $42,600 and $69,900.
For many providers, the grants they receive from the DHS for youth beds constitute a significant revenue stream. Collectively, DHS grants made up an estimated 20 percent of total revenue reported by the providers across their all programs, including those not funded by DHS. Grants for transitional and extended transitional housing programs accounted for 70 percent of the youth bed capacity supported by the District government. Grant budgets show that 85 percent of the funding was used to pay for staff costs.
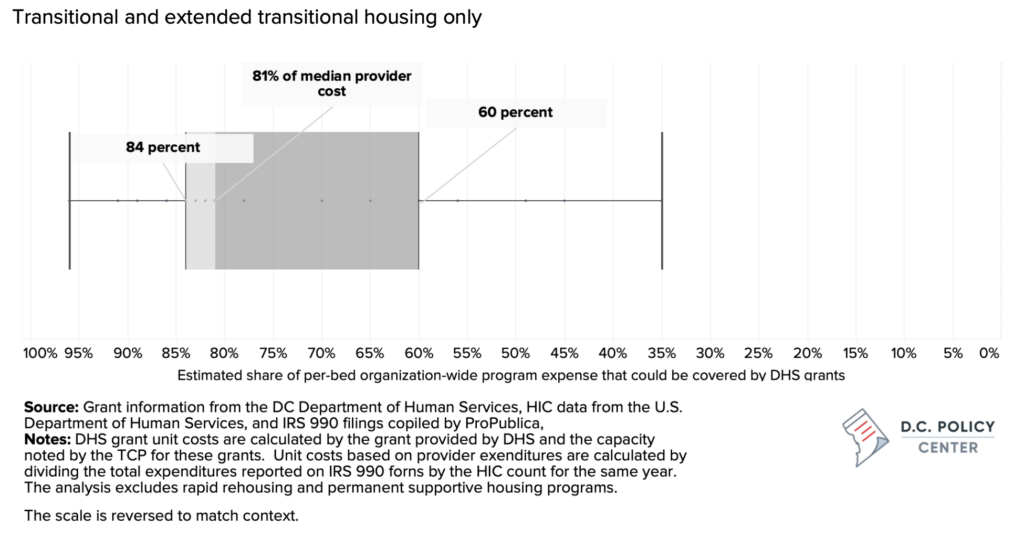
DHS grants, when divided by the number of beds they support, averaged just under $40,000 in 2021. This is approximately $3,325 per month, or about $500 less than what the Economic Policy Institute projects as what a single adult would need to maintain an adequate standard of living in the District of Columbia. There is a tension between providing adequate supports so providers can maintain their current capacity, and at the same time, leveraging grant dollars in a way that incentivizes new beds and new programs. Comparing provider unit costs to funding received per bed shows that for the median provider, a DHS grant can cover 81 percent of their organization-wide unit cost. Half the providers can use DHS grants to pay 60 to 84 percent of their unit costs.
Recommendations
This report offers three sets of recommendations: systemwide recommendations that can help increase funding efficiency and lead to more effective use of public funds, recommendations for providers that can improve their financial management, and recommendations for the D.C. government and the DHS, than can help reduce operational risks for the providers.
At the systems level, better definitions of service levels can help match funding to needs. At present, there is great variation in both DHS funding levels, and spending levels across providers and programs, but little information on how much of these differences are driven by actual program costs, and how much are legacy differences that date back to original funding decisions. More transparency in funding can be achieved by creating tiers of service which map service levels to funding levels. Additionally, better definitions of different types of housing could better illuminate requirements and funding levels needed for each service—specifically regarding emergency housing versus shelters, and transitional versus extended transitional housing. This information can be augmented by a cost adequacy study to determine adequate levels of services to increase program success and the costs associated with these services.
There is also a need to use government investments to leverage non-D.C. government funds. Providers will have to raise additional funding, and better leveraging of public funding can help create additional capacity and resiliency in the system. DHS already coordinates some of its funding with community-based organizations. But additional collaboration with local or national philanthropic organizations could increase the amount of grants or gifts from these sources. To achieve this, DHS and service providers can work together to develop a case for support for their programs, including a clear statement on the government’s funding levels, as well as providing acknowledgement that service providers will require non-governmental supplements to their DHS grant budgets to be able to continue their services.
Providers can take steps to negotiate more flexibility in funding. Providers report overhead expenditures that vary between 16 to 25 percent of program costs, which is higher than the 10 percent indirect cost recovery cap imposed on the DHS grants. D.C. Code allows providers to negotiate a higher cost-recovery rate directly with the D.C. Government or use this information in their D.C. contracts if they have negotiated a higher rate with the federal government.
Financial management and organizational capacity among the providers need improvements.
Providers invest only a small portion of their resources in administration and organizational development. Provider filings with the IRS can be missing, or annual financial reports are not always available for all providers or could be of varied quality. Some of the delays in contract execution and delay in receiving payments from DHS stems from provider’s inability to present DHS with all required documentation. Providers can improve financial managing and increase organizational capacity by looking for help from philanthropic organizations that focus on capacity building. The D.C. government can also be a source of training.
DHS should consider matching its payment schedule to providers’ needs and clearly communicating grant timelines and requirements. At present, providers frequently mention that the wait between when they begin their grant-funded work and the time they receive payment from the District can be two or three quarters, creating cash management problems. If the District’s fiscal year structure is the main cause of this problem, this issue can be addressed by budgeting funds across different fiscal years or by allowing advance payments. Providers have noted that information about grant requirements and changes in grant requirements and timelines have not been communicated adequately. While due diligence is a central part of funding, perhaps this issue can be addressed by investing in organizational capacity at DHS or by providing additional supports to service providers, so they are fully aware of all that is necessary to successfully meet grant requirements including reporting requirements. DHS can also consider adjustments to the invoice approval process and staff retraining to reduce delays.
The District government should take steps to remove non-financial, programmatic, and regulatory constraints on providers.Providers have noted that delays in receiving clearance from the District’s Child Protective Registry have made hiring difficult—an issue that has also hindered schools from hiring substitute teachers and paraprofessionals. Adding capacity to the Child and Family Services Agency and clarifying the requirements are necessary to ease this pain point. Providers are also worried about legal confidentiality requirements that can be at odds with housing referral requirements. DHS should work with service providers to understand the conditions under which this prevents client placement, and work toward a regulatory or legislative fix.
Youth homelessness in the District of Columbia
The U.S. Department of Housing and Urban Development (HUD) defines an unaccompanied youth to be someone under 25 years of age who is unaccompanied by a parent, guardian, or spouse. Parenting youth under 25 years of age who have their children with them are also considered unaccompanied.
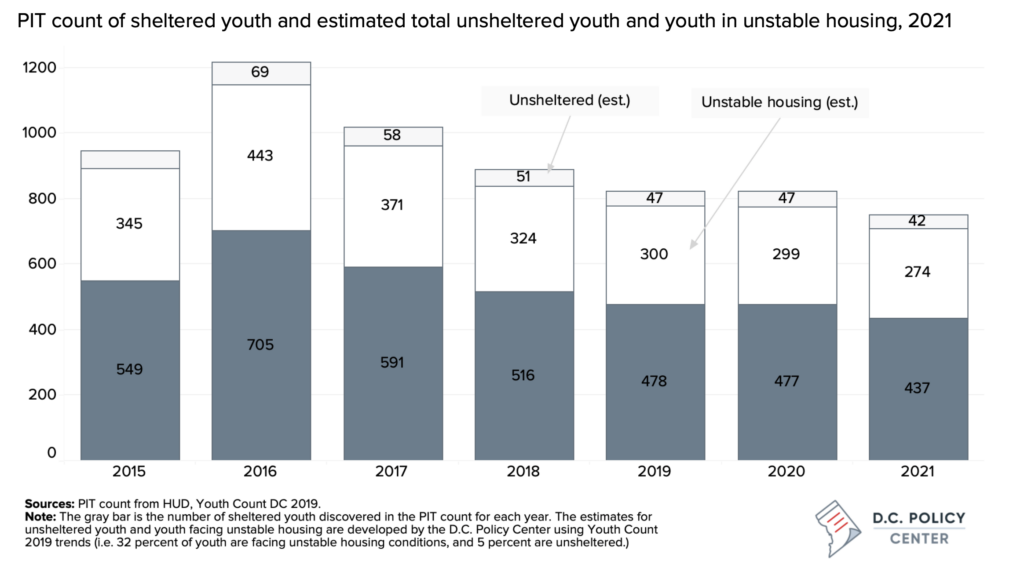
The 2021 Point-in-Time (PIT) count revealed that there were 434 unaccompanied youth under the age of 25 experiencing homelessness and sheltered by one of the service providers in the District.3 This number is an undercount for three reasons. First, it does not include the youth housed in Rapid Rehousing and Permanent Supportive Housing programs (467 reported for 2021 in these units). Second, it does not capture youth facing unstable housing conditions or at imminent risk of homelessness—for example, youth who are couch-surfing with friends, or sharing a space with strangers.4 Third, the 2021 data are even more problematic than a typical PIT count because, citing COVID-19 concerns, many communities including the District did not conduct a full unsheltered count that year, likely missing some youth who were unhoused.5 In addition, capacity restrictions related to COVID might have had limited the number of youth in emergency shelters.
Because of the known problems with the PIT count, in 2015, the District implemented a youth-focused homelessness census called Youth Count DC.6 This annual census collects information on not only youth experiencing homelessness (unsheltered, or in emergency shelters or transitional housing), but also youth who are at imminent risk of homelessness. The questionnaire is distributed widely, and youth can participate using a phone or another online device.
Data from this census show a much higher incidence of homelessness and housing instability among youth compared to the PIT count. The data for the most recent year available (2019) show that the PIT count can underestimate the incidence of homelessness among youth by as much as 40 percent.7 For example, in 2019, the Youth Census identified 1,306 youth who were experiencing, or at some point, experienced homelessness that year; among those, 707 were already known in the system (with records in Homelessness Management Information Systems), and 599 were only identified through the Census. The same year, the PIT count showed only 478 youth under the age of 25 experiencing homelessness. The 2021 Youth Census (which only focused on those experiencing homelessness only, and therefore excludes those who are at imminent risk of losing their home) identified a total of 517 unaccompanied youth experiencing homelessness, including 370 individuals and 142 heads of households with 163 children living with them.
Data from the PIT count and estimates developed by the D.C. Policy Center using the 2019 Census trends suggest that the number of youth experiencing homelessness or at imminent risk of becoming homeless decreased significantly between 2016 and 2019, but improvements have been slow since then (and with COVID, the data are less reliable). Our best estimate is that in 2021, there were 753 youth under the age of 25 experiencing homelessness or in imminent danger of becoming homeless.8 That same year there were also 308 children in emergency shelters or transitionary housing, in addition to the youth experiencing homelessness.
Figure 2: Youth experiencing homelessness in D.C.
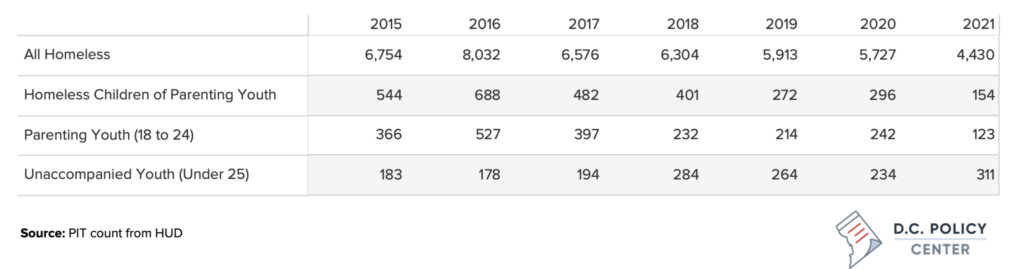
One troubling trend is the increase in number of unaccompanied youth captured in the PIT counts since 2015. Between 2015 and 2021, the incidence of homelessness in the District as captured by the PIT counts declined from 6,754 to 4,430, or by 35 percent. The decline was even greater among parenting youth (and their children). In 2015, there were 366 parenting youth experiencing homelessness in the District; by 2021 this number was down to 123—a decline of 30 percent. However, during the same period, the incidence of homelessness among unaccompanied youth under the age of 25 the city increased steadily—from 183 to 311, or by 67 percent.9
It is possible that the increase in the count of youth experiencing homelessness is not driven by an actual increase in the number of homeless or housing-unstable youth, but a higher level of participation in emergency shelter and transitionary housing programs, with more youth knowing of and finding a safe haven in these places. Since 2015, the District added nearly 200 new youth-dedicated beds in emergency shelters and transitional housing, increasing capacity by nearly 45 percent. There was also more outreach to youth, so some of the increase in numbers could be more youth being captured by the system. At the same time, this increase in single youth experiencing homelessness mimics the trends among adults.
Table 2: Individuals experiencing homelessness captured in PIT counts, 2015 – 2021
Youth experiencing homelessness and who seek shelter are predominantly Black and are more likely to be female. The 2021 PIT count shows that Black youth make up 90 percent of youth in emergency shelters and transitionary housing, with a slightly higher presence in transitionary housing. Approximately 10 percent of sheltered youth are Hispanic or Latino.10 Half the youth in emergency shelters and 59 percent of the youth in transitionary housing are female. It appears from the data that transgender youth and gender non-conforming youth are less likely to continue from emergency shelters into transitionary housing. These youth make up 13 percent of the youth in emergency shelters but only 6 percent of the youth in transitionary housing.
Figure 3: Characteristics of youth experiencing homelessness
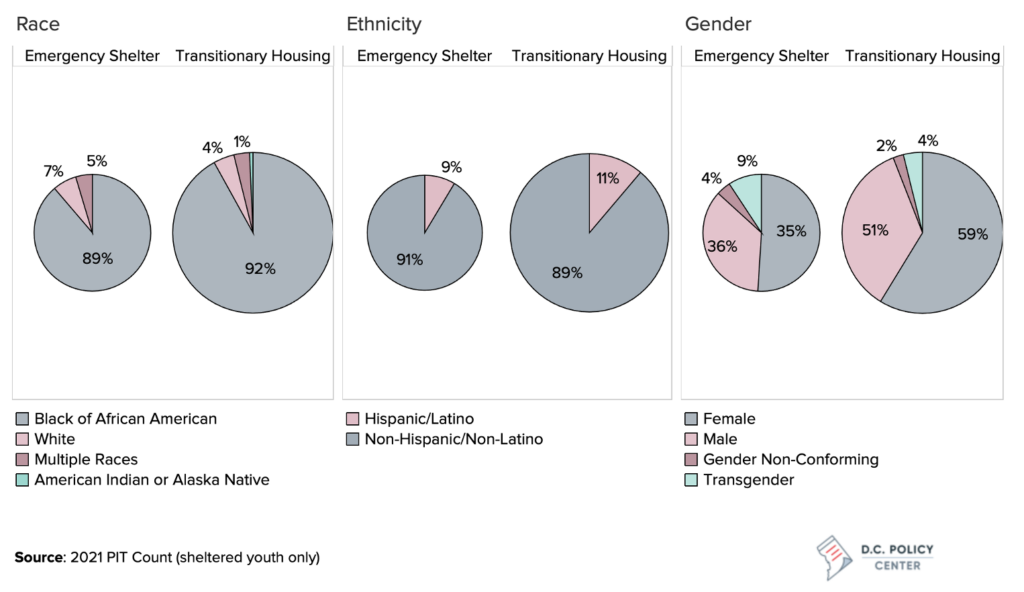
While the PIT count does not capture the number of LGBTQ youth, the 2019 Youth Census found that 34 percent of single youth and 13 percent of parenting youth were LGBTQ. It also showed that LGBTQ parenting youth were less likely to be served by the youth system—19 percent of LGBTQ youth captured in the Census were parenting, whereas only 7 percent of LGBTQ youth who were served by the youth system were parenting. Youth experiencing homelessness are likely to have a history of domestic violence or experience mental health issues. Approximately one in three youth report being the victim of family or intimate partner violence—that rate, across all persons experiencing homelessness, is one in five.11 And this share is higher in the most recent Youth Census, with 43 percent of the youth reporting having at some point experienced domestic violence or intimate partner violence, and of this group, over half report currently fleeing a violent household or partner. Half the youth report having a mental health condition, compared to 40 percent across the entire population of individuals experiencing homelessness (the 2021 Youth Census pins this share to 36 percent). One in four youth are justice-involved—compared to 44 percent across the entire population of individuals experiencing homelessness—and many of them face homelessness after they exit the criminal justice system. Finally, approximately 36 percent of the youth experiencing homelessness do not have a high school diploma.
Characteristics of service providers
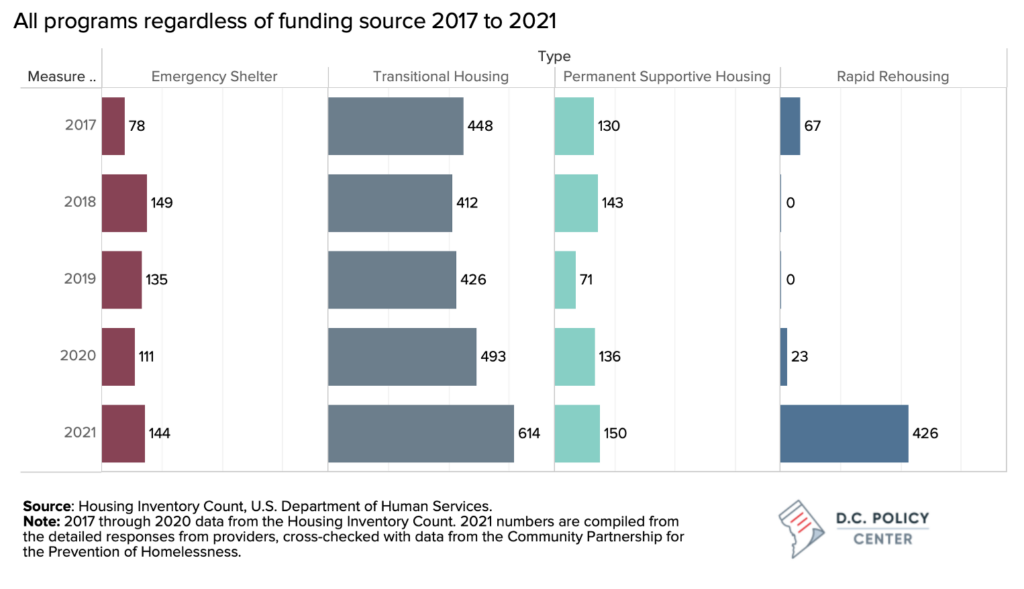
In 2021, there were an estimated 1,347 beds available in the District of Columbia for youth experiencing homelessness, scattered across 48 distinct programs offered by 17 different service providers. The number of beds dedicated to youth showed a significant increase in 2021 from previous years for which we have data: between 2017 and 2020, the number of beds dedicated to youth averaged at around 730. While this increase was largely due to the addition of over 426 beds dedicated to youth in rapid rehousing programs in 2021, capacity in all types of programs—and especially in transitional housing—has increased since 2017.
Figure 4: Dedicated youth beds across various housing options available to youth in D.C.
Characteristics of programs serving youth
The majority of the 48 distinct programs offer interim housing for youth: in addition to five emergency shelters which provide basic needs in a safe and structured environment, there are 34 programs that offer transitional or extended transitional housing, which provide time-limited housing and services in a project-based facility or an independent housing unit where youth can receive supports to meet their education or employment goals. In addition, five programs with 150 beds total offer permanent supportive housing options for youth who are facing complex challenges and need indefinite supports, and four programs with 426 beds offer rapid rehousing options to transitional-age youth, providing youth with a limited-time rental assistance.
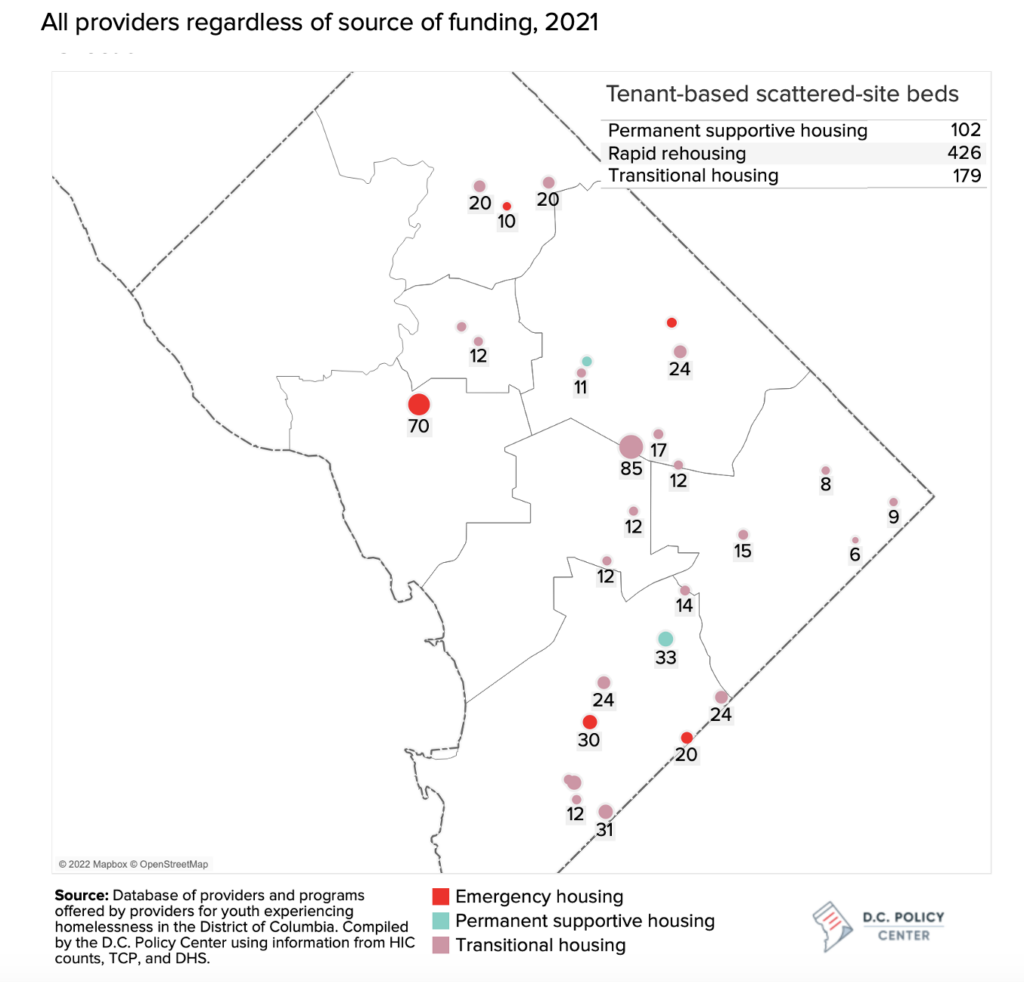
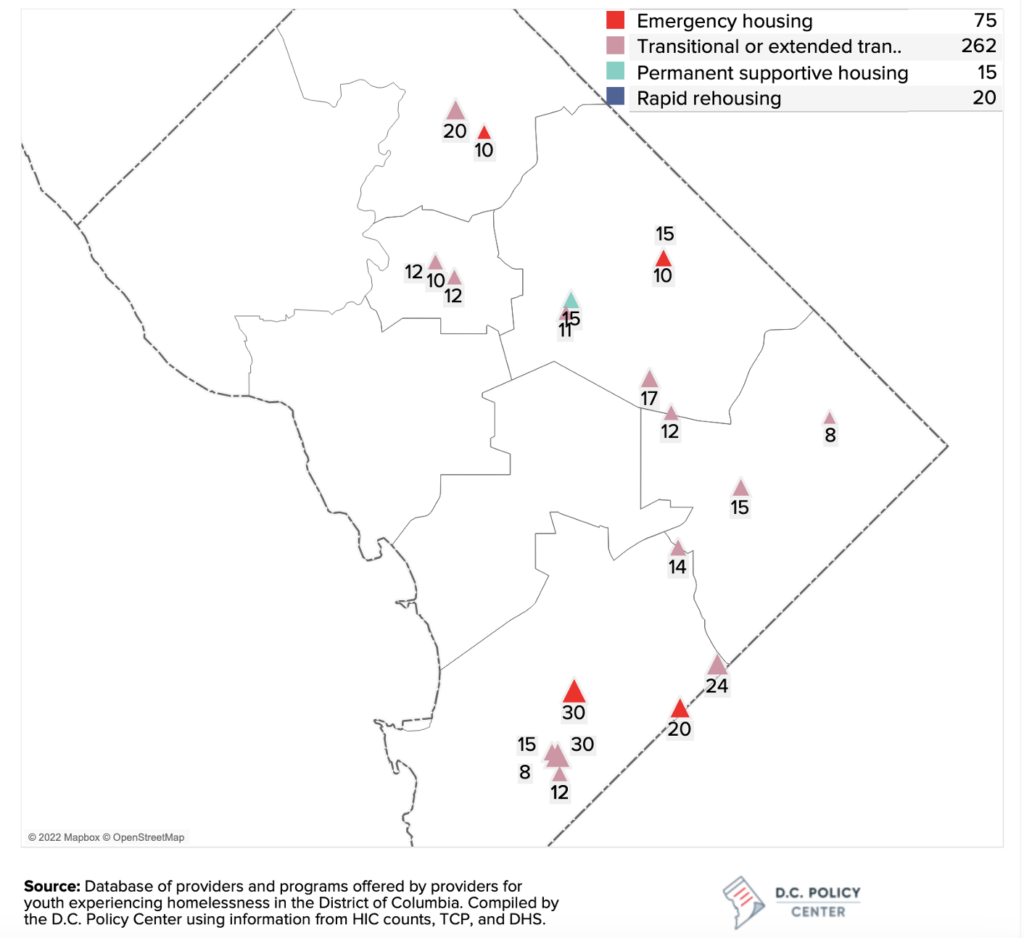
There are approximately 700 beds dedicated to youth in scattered-site tenant-based programs including 179 beds in transitional and extended transitional housing, 102 beds in permanent supportive housing and 426 beds in rapid rehousing programs. The rest of the beds are in site-based facilities that can be found in every ward in the city except for Ward 3. There are five emergency housing options with beds dedicated to youth, including two in Ward 8, and one in each Wards 2, 4, and 5. Ward 8 has both the largest number of programs and the largest number of beds dedicated to youth, followed by Ward 5.
Figure 5: Site-based housing providers serving youth experiencing homelessness in D.C.
Programs serving youth vary in their size, focus, and types of housing they offer. While most programs serve all youth, there are eight different programs with 85 dedicated beds serving LGBTQ youth, two programs with 128 dedicated beds serving youth who have experienced domestic violence or abuse, and one program with 12 dedicated beds serving teen mothers. Most programs that serve youth experiencing homelessness are small: 37 out of the 48 programs identified in this report serve have 25 or fewer beds. Larger programs are either emergency shelters or are tenant-based scattered-site programs (such as rapid rehousing programs).
Characteristics of programs funded by the Department of Human Services
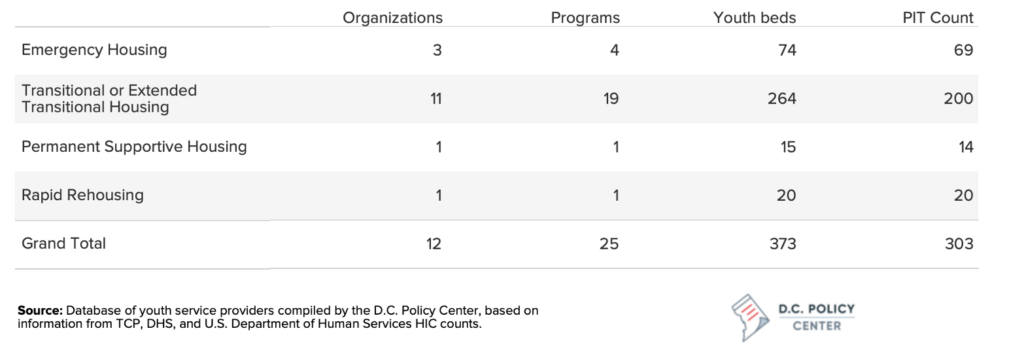
Of the 48 programs identified through the US Department of Human Services Housing Inventory Count, 25 programs, run by 12 different service providers with 373 youth-dedicated beds, were funded directly by the Department of Human Services (DHS) in 2021, including one small program serving the Department of Youth Rehabilitation Services. That same year, according to the PIT count, 303 youth were being served by these programs. Emergency shelters and transitional and extended transitional housing make up the majority of these programs, accounting for 70 percent of capacity. In addition, there are seven programs serving LBGTQ youth with 82 dedicated beds, one program with eight beds focused on youth who have experienced domestic violence, and one program focused on pregnant and parenting youth.
Table 3: Summary of service providers and capacity funded by the Department of Human Services, Fiscal Year 2021
DHS-funded youth beds are only a subset of overall capacity offered by these twelve service providers. These service providers have additional programs in and around Washington D.C. serving youth, individuals, and families experiencing homelessness. In 2021, for example, these service providers collectively offered 63 different programs with a total capacity of 3,736 beds serving different populations (individuals, families, and youth). In contrast to the DHS funded programs, where most of the investment is in transitional and extended transitional housing, 75 percent of overall capacity across all programs was concentrated in permanent supportive housing and rapid rehousing programs serving families (see appendix table). Capacity funded by DHS accounted for 39 percent of all youth-dedicated beds across these twelve providers. The distribution of youth-dedicated beds across different program types is similar to the distribution of DHS-funded programs, with 68 percent of beds in transitionary or extended transitionary programs.
Figure 6: DHS funded site-based housing providers serving youth experiencing homelessness in D.C.
The D.C. Policy Center distributed a questionnaire to the 12 service providers funded by DHS to inquire about their service characteristics, client characteristics, and revenue and cost structures. Out of the 12 providers, 11 responded. These responses allow us to provide some high-level information on the characteristics of service providers and the types of services they provide youth.
First, many of the service providers that work in the youth system are experienced. All providers that responded to the D.C. Policy Center questionnaire has been in existence for over 10 years, and more than half have been in existence for over 20 years. Second, many of the providers offer multiple types of programs, to include a mix of emergency shelters, site-based or scattered transitional housing (or both), rapid rehousing, or permanent supportive housing. In our sample, all participants reported offering at least two types of programs, most commonly emergency shelter services and transitional housing at the same time. Service providers also commonly offer a mix of extended transitional housing and rapid rehousing services. Third, many of the programs have a youth focus, but as noted before, service providers also serve clients other than unaccompanied youth. Among the respondents, over half reported serving all types of individuals and families experiencing homelessness, and youth dedicated beds make up over 25 percent of the full capacity. But, across transitional housing programs, youth-dedicated capacity account for over 90 percent of all capacity. Finally, many of the providers focus on youth between the ages of 18 and 24. Only one in four providers report serving minors, including minors who are pregnant or parenting.
Table 4: Summary Characteristics of Service Providers funded by DHS
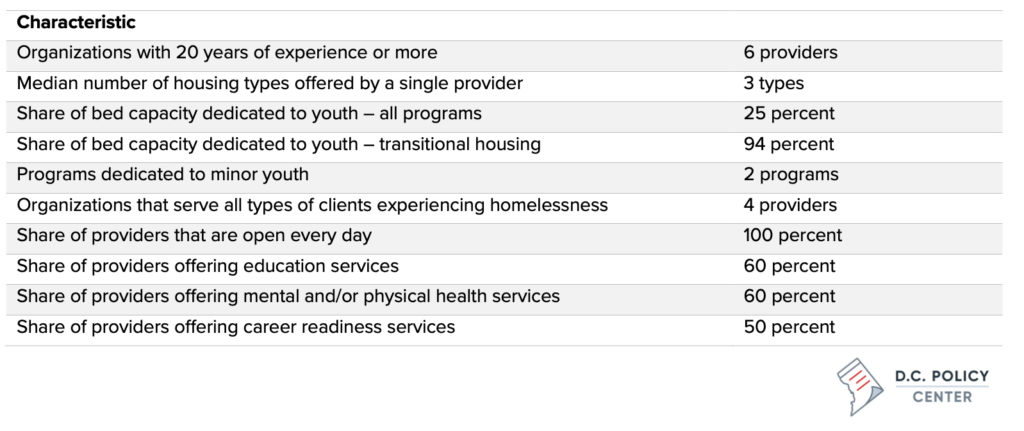
All providers who participated in the questionnaire reported being open every day, and 80 percent of the providers (which account for 90 percent of the youth bed capacity) are open 24 hours a day. Many providers report providing services at levels and hours that are greater than what is contractually required of them. About a third of the providers offer programs which require case management services more than once a week, but 45 percent of providers offer case management services at that frequency. All providers offer additional wrap-around services to the youth they serve—most commonly education and health, including mental health services (60 percent of all providers), and career services (half of all providers). Other, less common types of services include legal help, fitness centers, clothing and laundry services, library services, and special events around holidays, and sponsors for baby showers for parenting youth.
The financial structure of providers serving youth
Providers that serve youth who are experiencing homelessness work with a broad set of clients (including individuals and families experiencing homelessness) and offer a variety of housing programs. While some aspects of these programs are similar (for example, shelter services) across providers and programs, there is great variation in the types of wrap-around supports offered, especially across transitional and extended transitional housing. Thus, there is great variation in how providers raise their funding, and how much it costs them to serve their clients. For these reasons, the analyses presented here include both a combined picture (where sources and uses of funds are summed up across providers, and presented for the entire sector), and a distributional picture (where the median value is presented along with the interquartile range, which roughly captures range of values that cover the middle 50 percent of providers).
What is the interquartile range?
Because the provider financials are so varied, presenting averages for provider revenues and expenditures could obscure the full fiscal picture. For this reason, the revenue and expenditure analyses provided in this report includes both median values (the value in the middle of a distribution) and how these values are distributed across providers. The distribution of values is captured through the use of interquartile range.
In descriptive statistics, the interquartile range is a measure of the spread of data known as statistical dispersion. It is defined as the difference between the 75th and 25th percentiles of the data. The interquartile range is sometimes called the midspread or the middle 50 percent. That is, half the observations fall within the interquartile range.
DHS grants are one of many funding streams that service providers combine to serve their clients across multiple programs. While DHS-funded grant budgets are detailed in how providers can use the money for a given program, this funding is only one portion of the total spending across the entire organizational budgets. In many cases, the actual cost of running the DHS-funded programs could be greater than DHS funding, and providers fill the gap with other sources funding including federal dollars, philanthropic investments, in-kind contributions, and program revenue. Providers also pull resources across different types of programs they offer, especially to cover overhead costs.
To understand the overall funding structure of service providers (across all of their programs, not just youth-focused programs), the D.C. Policy Center compiled the filed IRS 990 forms for all participating organizations for all available years since 2017. This exercise resulted in 29 different data points to examine the revenue and cost structures of service providers. This analysis was supplemented with information collected from the service providers through a questionnaire and DHS-funded budgets to examine the overall financial structure of youth-focused programs and the role of DHS grants in these programs.
Organizational revenue
Data collected from IRS 990 forms show that government grants are the largest source of revenue for service providers, collectively accounting for 63 percent of all funding they received. All other contributions, gifts, and grants from philanthropic organizations account for an additional 24 percent. Providers also generate some income from programs and services they offer, including subsidies they receive for the tenants they serve and rental income they collect. It is not common for service providers to generate funding through federated campaigns and fundraising events (only 2 percent of funding is reported to be raised this way).
Table 5: Funding structure of service providers serving youth
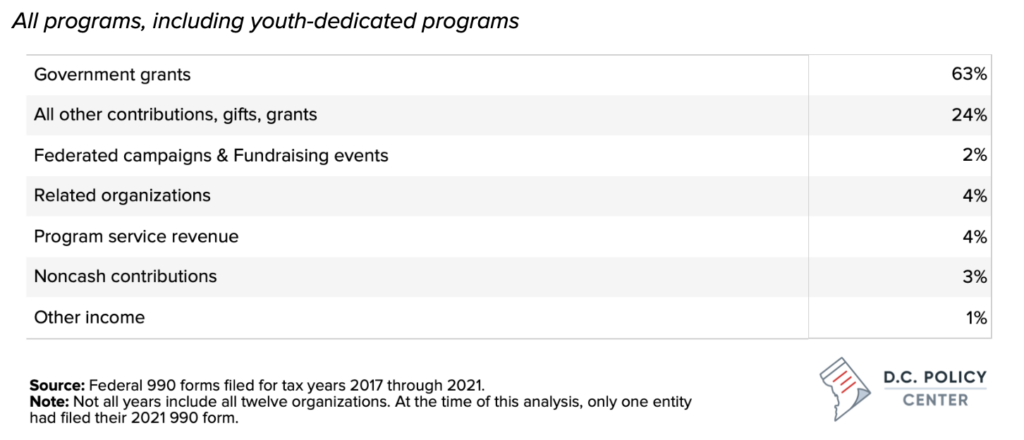
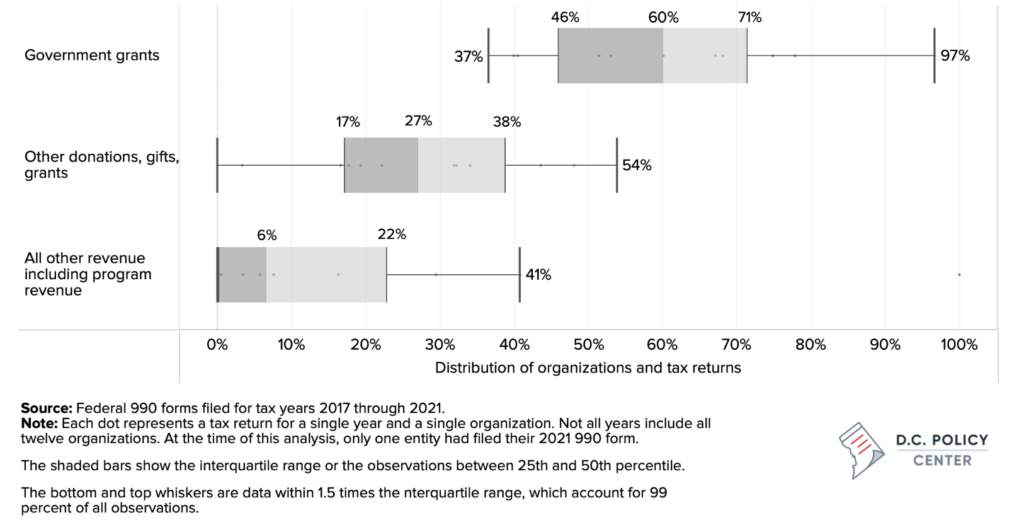
While government grants account for 63 percent of all revenue sources, there is great variation across organizations on how they fund their operations. The median organization received 60 percent of its funding from government grants including grants from the federal government, D.C. government, and governments in other jurisdictions where providers offer services. But the share of funding from government sources varies between 46 percent and 71 percent of total revenue for the interquartile range or the “middle 50 percent” of all organizations. Similarly, philanthropic contributions tend to account for about 27 percent of all revenue for the median organization but could be as high as 38 percent and as low as 17 percent for the middle of the distribution.
Government grants tend to be a larger share of all funding for smaller organizations. Across the largest providers with annual revenue of $6 million or more, overall government funding is generally below 15 percent of all revenue. In contrast, government funding accounts for more than 60 percent of all revenue for smaller providers with budgets under $2 million.
Figure 7: Distribution of funding sources across all organizations and observations (all programs)
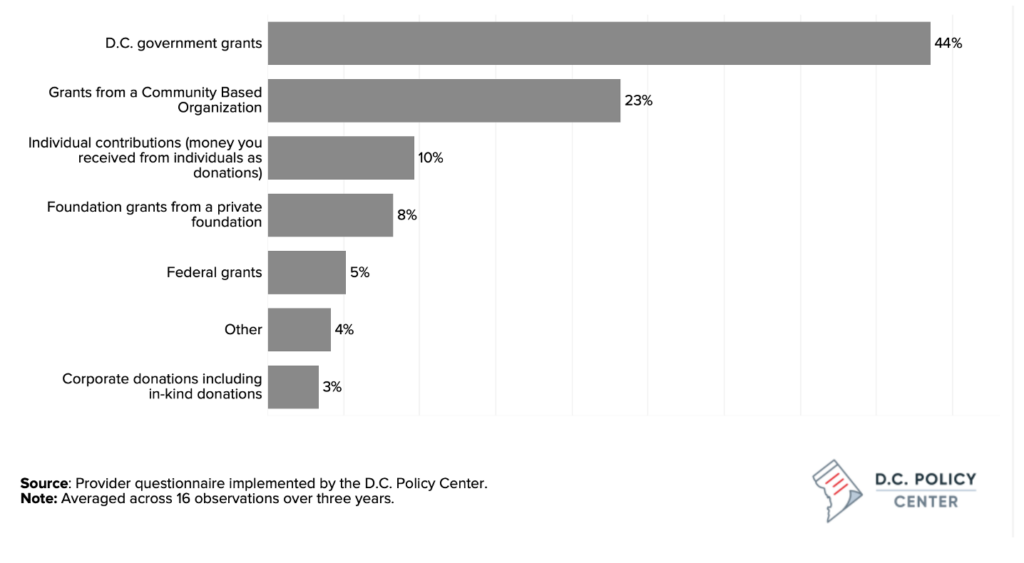
DHS funding is an important part of the funding streams for the twelve organizations serving youth in D.C. We estimate, from the 990 forms, that the annual funding from DHS accounts for about forty percent of all revenue for the 12 providers. The organizational budgets reported by the providers in the D.C. Policy Center questionnaire are consistent with this estimate, showing an average of 44 percent of all organizational funding coming from DHS, but this share can be as high as 64 percent and as low as 24 percent.
The second largest source of funding, as reported by the providers, are grants from community-based organizations (for example, the Community Partnership for the Prevention of Homelessness). On average, such grants made up 23 percent of all revenue. However, half of the providers that responded to the D.C. Policy Center questionnaire did not receive any community-based organization grants. Individual grants and donations make up, on average, 10 percent of all funding, and grants from private foundations make up an average of 8 percent of funding.
For a majority of service providers, direct federal funding is not a viable source of funding, mostly due to the complicated process of applying and receiving federal funds (although organizations could indirectly be receiving federal funds through a community-based organization). While direct federal funding, totaled across all providers, accounts for about 5 percent of overall revenue, the median amount is zero.
Figure 8: Funding sources reported by organizations serving youth in the District of Columbia
In responses to the D.C. Policy Center questionnaire, providers noted that 2020 and 2021 funding has been helped by the PPP loans (largely forgiven), which are non-recurring. Some providers reported that they were able to backfill these amounts by more aggressively seeking private donations. Some providers reported liquidating assets through the pandemic to establish reserve funds. Others began to participate in workplace giving programs and holding fundraising events.
For a majority of the service providers, over three quarters of their revenues (including their DHS grants) are restricted, meaning the grants or donations they receive are committed to certain programmatic spending and cannot pay for overhead expenses or any other expenses that are not explicitly approved in grant agreements. DHS grant agreements allow overhead spending for of a maximum of ten percent of operating budgets (excluding occupancy costs and cash transfers to clients). However, providers report typically having overhead costs between 16 to 25 percent, meaning general operating funds could be insufficient to cover overhead costs. Thus, providers are often using sources of unrestricted funding to pay for the overhead expenses associated with DHS-funded programs.
Provider expenditures
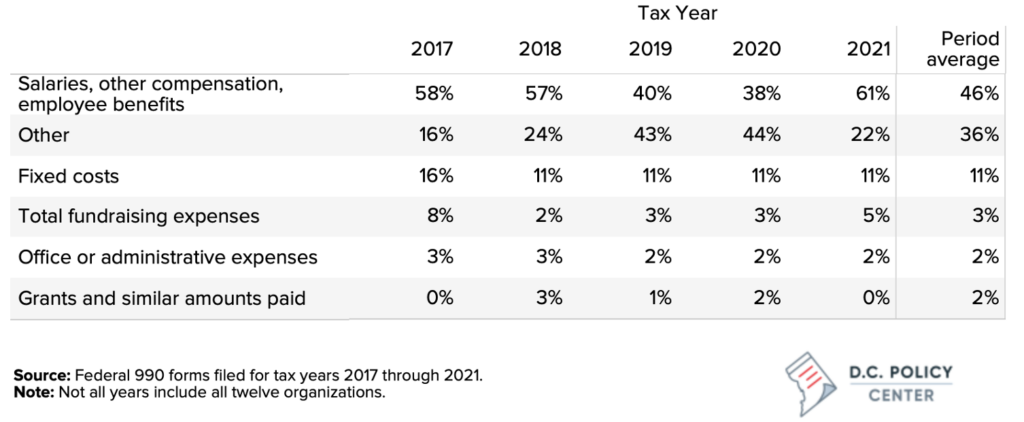
The largest source of expenditures for service providers are related to personnel, including salaries, fringe benefits, and other forms of compensation. Across providers and years, employee or contractor compensation averaged at 46 percent of all spending but could be as high as nearly 70 percent of budgets for some organizations. Personnel expenses declined over time (the 2021 figure increased but is representative of only one provider as at the time of the drafting of this report, most organizations had not filed their 2021 990 forms), and providers have been allocating a larger share of their budget to other types of expenditures, which include contracted services. Fixed costs, which include rent, insurance, and utilities, have remained stable over time, at an average of 11 percent of budgets. Expenses associated with fundraising and administrative needs are modest and consume about 5 percent of organization resources.
Table 6: Distribution of expenditures across functional categories, 2017 through 2021
These numbers from tax filings comport with what is reported on the D.C. Policy Center questionnaire. Data over 11 observations show that personnel expenditures averaged at 53 percent, and the share of personnel expenditures varied between 37 percent and 68 percent. Fixed costs averaged at 13 percent but could be as high as 30 percent.
Figure 9: Expenditure patterns across organizations serving youth experiencing homelessness
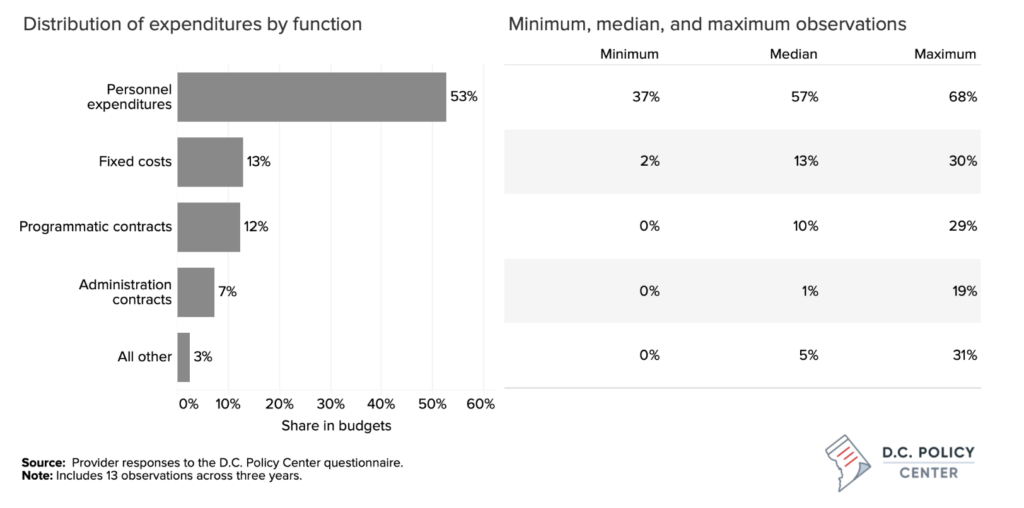
The responses to the D.C. Policy Center administered questionnaire also provide more information on how organizations spend their contract dollars. Approximately 12 percent of all spending is on contracts related to service delivery—cleaning, maintenance, transportation, food services, or contracts for other services provided to the youth. And administrative contracts—for accounting and financial management type services, for example—are rarely used. While the average share of these expenditures in organization budgets is 7 percent, the median organization spends about 1 percent of its budget on such services.
Financial health of organizations serving youth
Data collected from 990 forms over a five-year period (2017 through 2021) over 29 observations show that providers have generally been successful in ending their fiscal years with sufficient revenues to cover their expenditures.12 This data show that the median provider finished the year with a surplus equivalent of 6 percent of total revenue, with an interquartile range of 4 percent to 18 percent.13 Across the 29 observations, there were three instances where a provider finished the year with a net operating loss, and in two of these instances, providers closed the year with a deficit that is equivalent of 15 percent or more of their operating budgets.
Figure 10: Distribution of net operating incomes (revenue minus expenditures) per tax filings
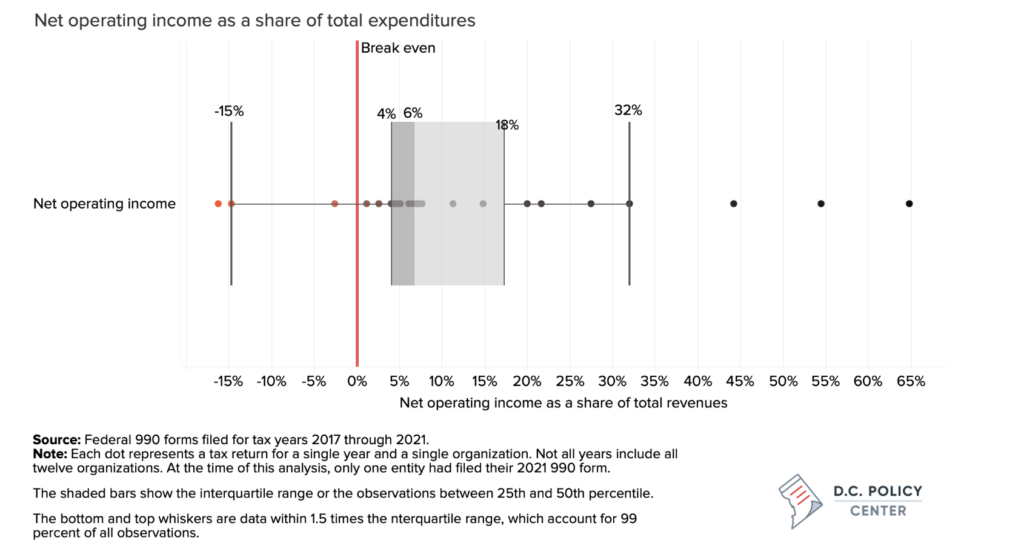
Calculations based on provider responses to the D.C. Policy Center questionnaire paint a comparable picture, showing a median end-of-year surplus equivalent to 6 percent of total revenues, with an interquartile range of 4 and 16 percent (compared to 4 and 18 percent per the 990 filings).
In their responses to the D.C. Policy Center questionnaire, all providers that responded to the question about their ability to meet costs by existing revenues (8 providers) reported they could do so. Most had in hand cash sufficient to cover just under three months of operating expenditures. When faced with a shortfall, this cash reserve is the first source of financial resiliency. When faced with shortfalls that cannot be fully covered by their cash reserves, providers report asking donors to cover the gap, borrowing from a bank, or using a line of credit among means through which they cover their costs.
Risks to financial resiliency and COVID-19 impacts
The most commonly mentioned financial risk by the providers is cash flow management. This stems from the misalignment between when providers incur their expenditures and when receive their funds. Providers mention that government contracts (including the DHS grants) are often received in the second or third quarter of their fiscal year, making it difficult for them to plan their spending and manage cash. Some organizations report struggling with meeting the contract or invoicing requirements, and sometimes having to wait long periods for an executed contract and reimbursements. Interviews with providers and DHS staff suggest that delays in payments are often a function of missing documentation or information requested by DHS as a part of the contracting and payment process.
Figure 11: Share of providers that identify the issue as a major constraint to maintaining or increasing service capacity
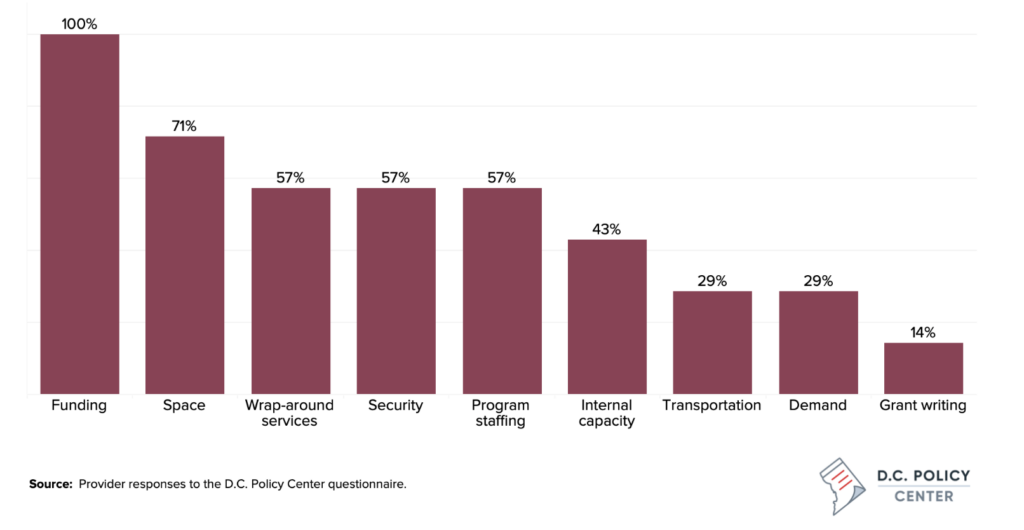
The second most commonly mentioned risk is the increasing costs of providing services. Some of this increase has been driven by the COVID-19 pandemic—especially the costs associated with cleaning: Four out of five providers who participated in the questionnaire identified cleaning costs as a major cost driver. Other sources of cost increases are staff salaries which, providers note, needed to be increased to keep existing staff or attract new staff.
All providers identified funding as a major and frequent constraint to maintaining or expanding service capacity. As noted, providers have struggled to fill the funding gap from the PPP grants; they are also increasingly worried about costs—specifically the costs of space (71 percent of providers identified this as a frequent constraint).
The responses to the D.C Policy Center questionnaire suggest that increasing costs of staffing, security, and wrap-around services have constrained providers from maintaining or expanding their program capacity. One provider noted that DHS grants are no longer sufficient to pay for the salaries necessary to attract and retain qualified workers. Many providers reported that when a candidate is identified, the process of putting them through various clearance processes such as the D.C. Child Protective Registry and the criminal background checks can take much longer than what is tolerable for a waiting candidate.
Providers are also worried about legal confidentiality requirements that can be at odds with housing referral requirements. They have also observed increased wait times for mental health supports, as well as other types of supports, which can be anywhere between three to six months. This length of time can be problematic given the needs of the unaccompanied youth they are serving.
Unit costs
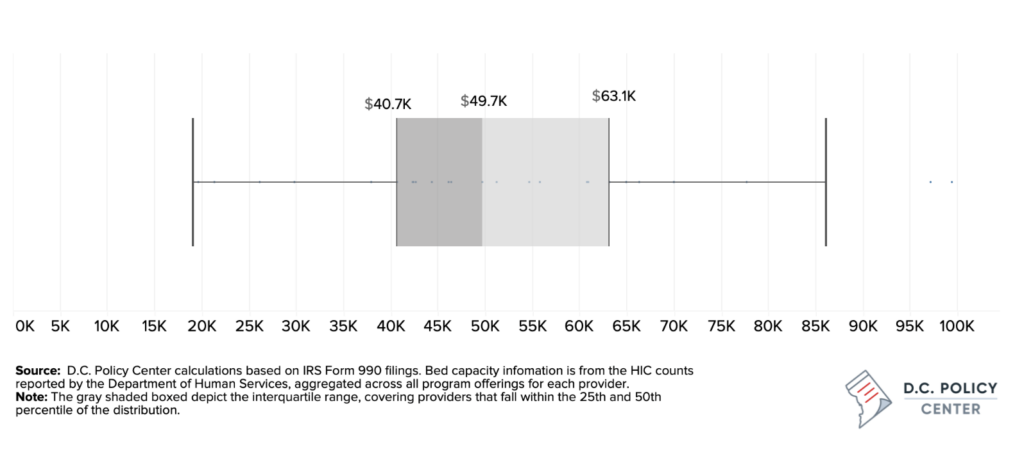
Unit costs – the spending per bed per year – can be a useful metric in comparing providers’ spending patterns. To develop unit cost estimates, the D.C. Policy Center combined information from IRS Form 990 filings and the Housing Inventory Counts reported for the corresponding year of filing for each of the 12 providers that receive DHS grants. The results show a wide variation in unit costs: the median unit cost for the study period is $49,700 with an interquartile range of $40,700 and $63,100 (meaning across providers and years, unit costs fell within this range half of the time).
Figure 12: Estimated unit costs across all programs
The unit cost metric is sensitive to the types of housing options offered by the service providers, as well as the wrap-around services they provide. Rapid rehousing, for example, is much cheaper to provide than extended transitional housing or permanent supportive housing, as it does not involve much beyond the housing subsidy. Unit cost differences for rapid rehousing are entirely driven by rent subsidy levels (which can reflect organizational capacity, the type of unit, or the location of the unit). This can be seen in the data analysis: organizations that primarily offer rapid rehousing programs had the lowest median unit cost across all housing types at $25,600 per bed.
In contrast, transitional housing and permanent supportive housing services require wrap-around supports that are necessary to prepare youth for independence, and therefore can be costly to provide. The D.C. Policy Center’s estimated median unit cost for providers that primarily provide transitional and extended transitional housing is $60,700, and for permanent supportive housing the median unit cost is $56,400.
Figure 13: Estimated unit costs across by housing type and by the bed capacity of the service provider
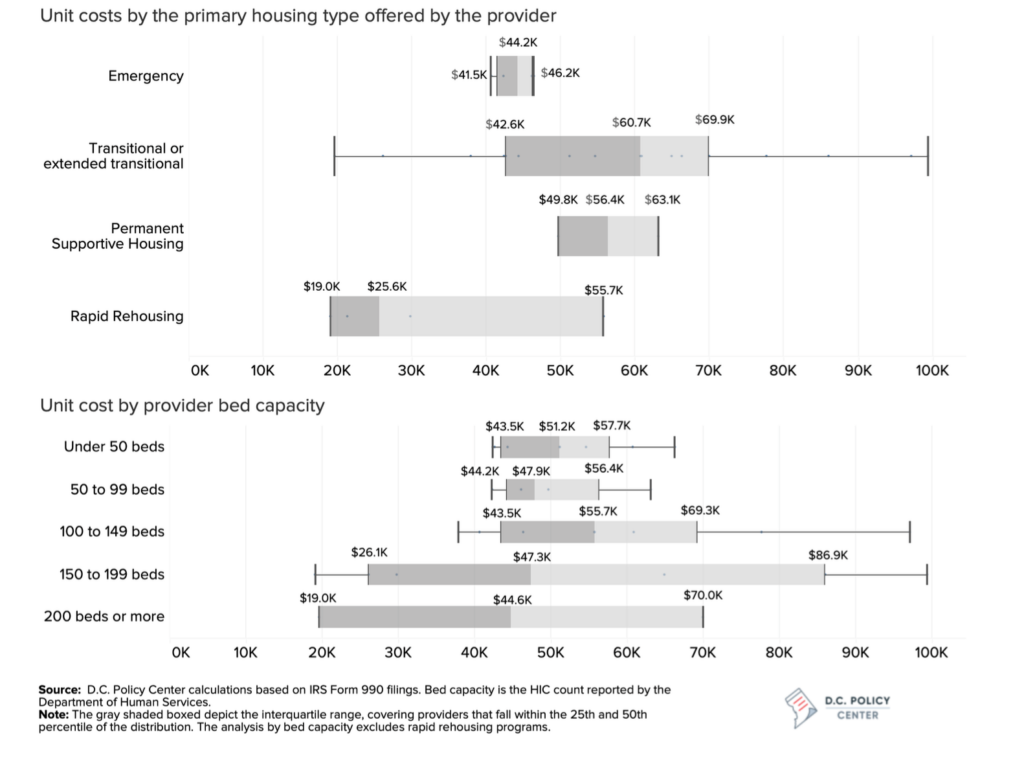
The type of housing offered can also drive the variation in unit costs across providers. Providers typically operate emergency shelters in similar ways, and therefore, their unit costs should be comparable, with variations potentially reflecting rents or the size of the shelter. This is evident in the data: the median unit cost for emergency shelters is estimated at $44,200 and the interquartile range is narrow, with fifty percent of the providers spending between $41,500 and $45,200 per bed. In contrast, transitional and extended transitional housing programs can look very different across providers depending on the type and intensity of wrap-around services offered, and therefore have a wide range of unit costs. The interquartile range of unit costs for providers that primarily provide transitional and extended transitional housing services is between $42,600 and $69,900.
Analysis of unit costs by provider capacity suggest lack of scale economies, meaning providers grouped by category have similar median unit costs. (This analysis excludes rapid re-housing because costs are almost entirely driven by rents). Smaller providers with fewer than 100 beds (typical size for DHS grantees), show a smaller variation in how much they spend per bed, with the interquartile range spanning between $43,500 and $57,700. For providers with a more than 100 beds, the variation in unit costs is much larger, perhaps showing that these providers can mix different types of services in different ways given their scale, and therefore have a greater variation in how much they spend per bed.
Additional analysis shows that providers with programs that primarily focus on youth tend to have higher unit costs than programs that are serving individuals and families experiencing homelessness. Most providers that have programs focused on families offer rapid rehousing options that can be cheaper, whereas youth-focused organizations tend to offer transitionary and extended transitionary housing programs which are more expensive. Providers with programs where less than a third of the bed capacity are dedicated to youth have a median cost of $42,000 whereas programs where more than two thirds of the bed capacity are dedicated to youth have a median cost of $57,000. However, when one excludes organizations that are primarily focused on rapid rehousing, the cost differences across service providers largely disappear.
Characteristics of DHS funding
DHS funds specific youth-focused programs based on budgets proposed by providers. A single provider may receive multiple grants for different programs: for example, a provider may propose and receive separate grants for an emergency shelter and a transitional housing program in the same location; or a provider may similarly propose and receive separate grants for programs that are at different locations. The grant amounts are driven by the information submitted by the provider as well as budget availability. According to grant information received from DHS, in 2021, the agency awarded a total of approximately $14 million in grants across 12 service providers and 25 different types of programs, supporting a total capacity of 373 beds.14 Overall, DHS grants constituted approximately 20 percent of provider-reported revenues for all the programs they operate (including those not funded by DHS), and 21.5 percent of provider-reported expenditures at the organizational level. For most providers, DHS grants constituted less than a quarter of their total revenues. But for four providers, DHS grants make up more than half the revenue they receive for all of their programs.
Figure 14: DHS grants relative to provider-level revenue and expenditures
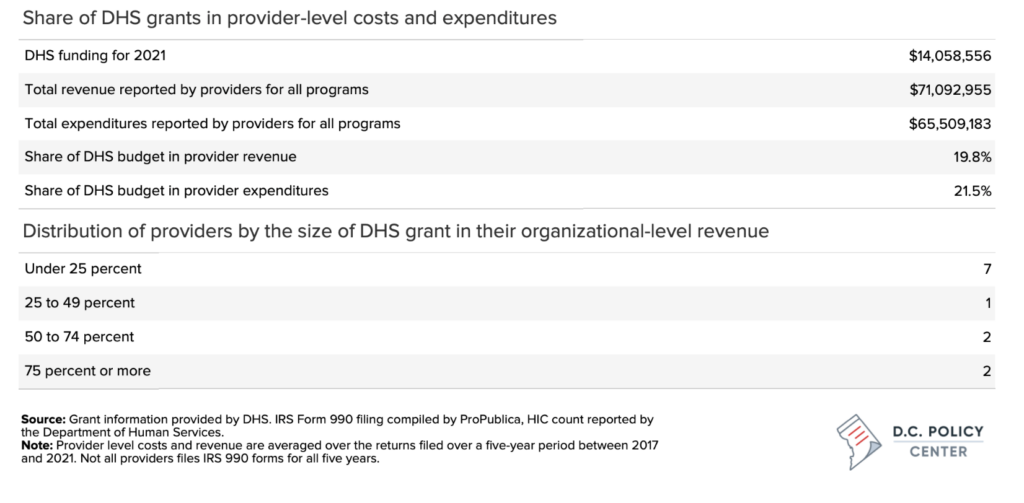
Figure 15: Distribution of DHS grants by program type, and program capacity
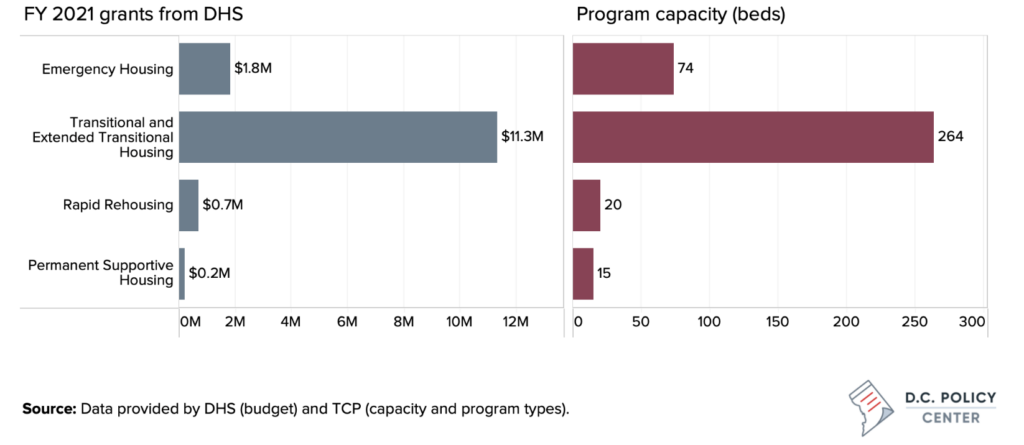
Grants were most commonly awarded for transitional and extended transitional housing ($11.3 million), accounting for 70 percent of the youth bed capacity supported by the District government. The second most common type of program funded by DHS is emergency housing, which is, often times, provided alongside transitional housing by the same provider. DHS grants for emergency housing providers totaled $1.8 million in 2021, supporting approximately 20 percent of total capacity. Finally, DHS awarded approximately $1 million in grants for rapid rehousing and permanent supported housing in 2021 for 35 beds combined.
DHS grants typically award providers a combination of direct programmatic and indirect costs. Direct costs include costs associated with operating the programs such as staff salaries and fringe benefits, contractors serving providers, supplies and small equipment, utilities, communications, and travel. In addition, DHS awards providers unrestricted funding to cover overhead costs, which are capped at 10 percent of programmatic costs. Providers also can receive funding for occupancy, as well as funding for direct transfers to clients such as rental assistance or cash stipends.
Figure 16: Distribution of DHS grants by allowable use
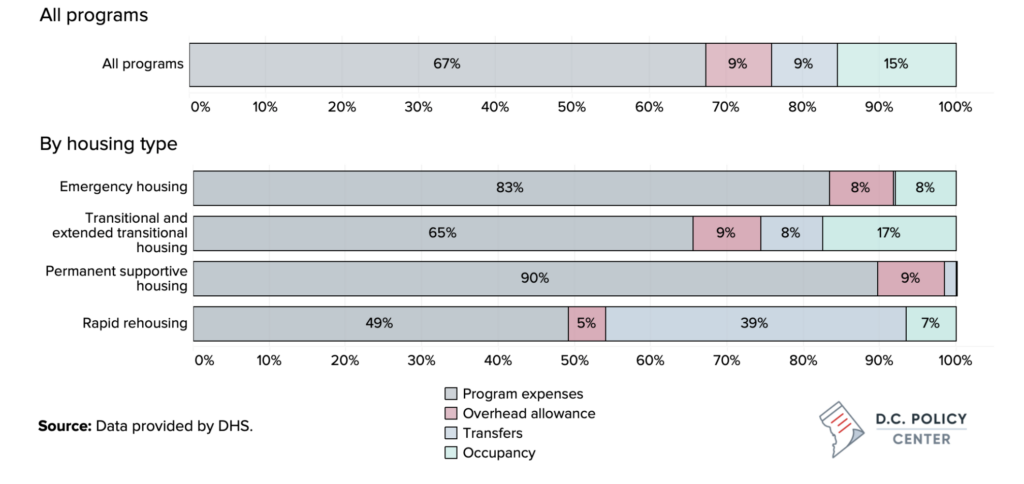
In 2021, program expenses were equivalent of 67 percent of all DHS grants, unrestricted overhead funding was 9 percent, transfers were similarly 9 percent, and occupancy costs were 15 percent. But these shares varied greatly by program type. For emergency housing, for example, where client services are almost entirely programmatic, program costs accounted for 83 percent of grants. In contrast, for rapid rehousing, where a significant share of grants are dedicated for client transfers (primarily rent and economic assistance), program costs accounted for about half the grant budget. Overhead allowance varied between 5 and 9 percent across different types of programs. As presented, this number appears lower than the 10-percent cap because DHS grants calculate overhead allowance as a share of program expenses only.
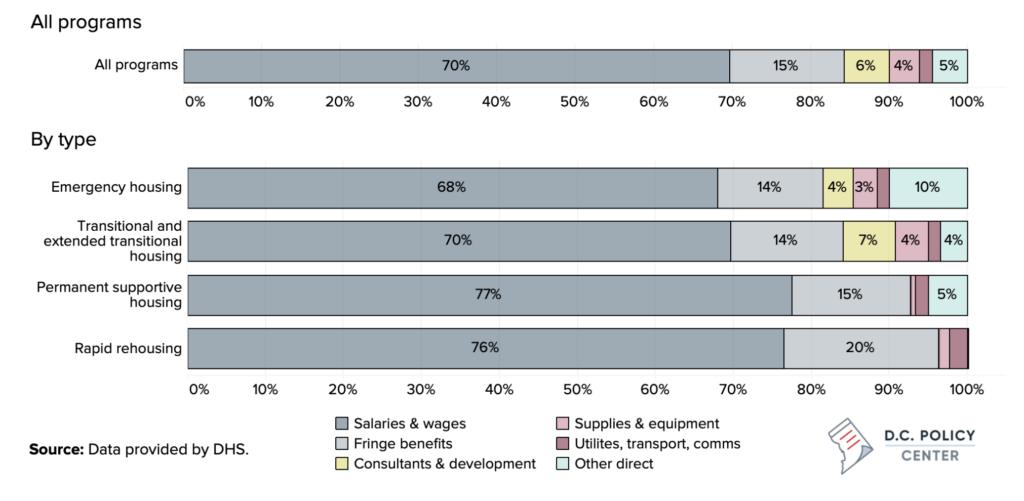
DHS grants allow program dollars to be spent on salaries and fringe benefits, supplies and minor equipment, consultants, or other activities such as planning that can improve provider capacity. Grants can also be used to pay for utilities, transportation, and communication costs, and other direct costs related to programs such as third-party contractors. An analysis of grants from 2021 shows that providers most often use DHS grants to pay for salaries and fringe benefits—collectively these expenses account for 85 percent of grant dollars. The share of salaries and fringe benefits in grant budgets is particularly high for permanent supportive housing programs and rapid rehousing programs, but for different reasons—the service-heavy nature of permanent housing programs amplify personnel costs, whereas personnel costs occupy a larger share in rapid rehousing programs primarily because program costs are a small share of total expenditures which include rent subsidies. Regardless, the spending profile is driven by transitional and extended transitional housing programs which account for 70 percent of grants.
Figure 17: Distribution of program expenditures by spending category
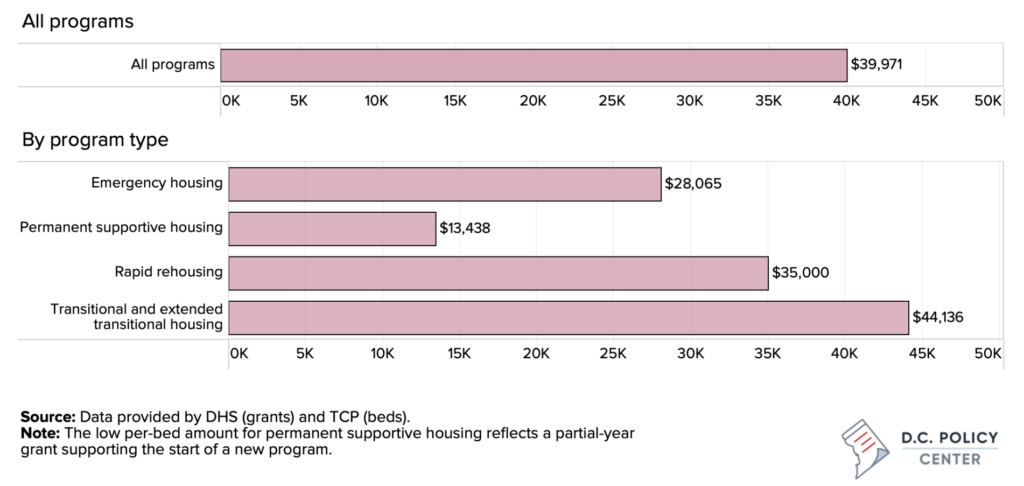
DHS grants divided by the total capacity supported by the grant averaged just under $40,000 in 2021 (the median per bed grant was $41,893). This is approximately the equivalent of $3,325 per month, or about $500 less than what the Economic Policy Institute projects as what a single adult would need to maintain an adequate standard of living in the District of Columbia.15
There is, once again, great variation in unit costs across different programs. But highest grants per bed are received by programs offering transitional and extended transitional programs at $44,136. This is because these programs both have strong programmatic support components, and also typically offer stipends and other types of assistance for their clients. Emergency housing programs typically receive $28,065 per bed, and similarly this reflects the level, duration, and intensity of services provided in each program.
Figure 18: DHS grants per bed
Funding adequacy v. funding leverage
One important consideration is the extent to which DHS grants cover the cost of programs youth-focused housing programs. The presence of DHS grants have helped expand youth-focused bed capacity in the District of Columbia, persuading new providers to serve the youth or existing providers to increase capacity or add new programs. Larger grants from DHS can provide financial security for existing providers, since providers would not have to raise as much additional funding from other sources to cover costs. But because funding is limited, grant decisions must balance two factors: providing adequate supports so providers can maintain their current capacity, while at the same, time leveraging grant dollars in a way that incentivizes new beds and new programs.
Providers face different degrees of challenges in meeting their expenditure needs and have varied capacity in pulling multiple streams of resources. To assess whether DHS funding is high enough to cover organizational costs or incentivize new beds, the D.C. Policy Center compared providers’ unit costs across all of their capacity to the per-bed grants they receive from DHS. DHS-funded programs have approved budgets, which must be spent in prescribed ways. The purpose of this exercise is not to determine whether DHS funds are sufficient for the programs they fund (which is, by definition the case), but assess how these funds, measured on a per-bed basis, compare to the per-bed expenditures providers incur across all of their programs.
Comparing provider unit costs across all programs to funding received per bed from DHS show that for the median provider, a DHS grant can cover an estimated 81 percent of adding a new bed if this bed cost is equal to their average unit cost. And half the providers can cover somewhere between 84 percent and 60 percent of their unit costs through their DHS funds.
Figure 19: The estimated share of per unit costs that can be covered by DHS grants
Summary of findings and recommendations
This report used provider-level information to develop a cost analysis of service providers that serve youth who are experiencing homelessness. The analysis developed in this report relies on information obtained from (a) DC Office of the Chief Financial Officer on overall government funding for youth homelessness programs including programmatic spending at the Department of Human Services and grants provided by the agency to service providers; (b) detailed grant budgets for each participating provider at the program level provided by the DHS; (c) capacity information from the U.S. Department of Human Services collected through the annual Housing Inventory Count; (d) Point-in-Time counts provided by the U.S. Department of Human Services; (e) financial information collected from IRS 990 forms filed by providers funded by DHS; and (f) responses provided by service providers to a questionnaire distributed by the D.C. Policy Center.
The analysis is conducted to provide systemwide picture, which is not driven by any specific or identifying information about any individual providers. However, it is important to note that service providers vary greatly in their overall revenue and expenditures, the size of their organization measured by bed capacity, the mix of clients they serve (individuals, families, and youth), their focus areas, and the mix of housing and services they offer to their clients. Therefore, there is great variation in their costs and unit costs.
Current DHS grants partly reflect these variations, and the grant amounts were originally determined by information received from service providers who applied for and received grants from DHS. But original budgets were set at a time when the youth system was relatively young, and there was not enough information to determine unit costs for adequate service delivery. Since then, the size of the youth system doubled (across all providers and programs, including DHS funded programs), increasing from 643 beds in 2017 to 1,347 beds in 2021.
While there are similarities between providers that receive funding from DHS, there are also significant differences in size, scope, focus area, types of clients served, and types of housing offered. Additionally, the analysis does not incorporate any information on program characteristics or youth outcomes. Therefore, the numbers presented in this report should not be used as an adequacy metric. Rather, the main purpose of the report is to benchmark provider costs and identify gaps between program costs and DHS funding. Finally, to ensure that DHS funding history does not influence this benchmark, the report used provider data across all provider programs and not just DHS programs. While this approach provides a fuller picture of the cost structure of service providers, it also incorporates the level of funding adequacy for all types of programs, which may or may not be sufficient.
Key findings of the report
On providers serving youth experiencing homelessness and capacity:
- In 2021, there were an estimated 1,347 beds available in the District of Columbia for youth experiencing homelessness scattered across 48 distinct programs offered by 17 different service providers. This shows an increase of 517 beds (or 62 percent) in capacity since 2017 (730 beds).
- Direct DHS grants supported 12 of these providers across 25 different programs that collectively have 373 beds dedicated to youth experiencing homelessness. That is the equivalent of 28 percent of all youth-dedicated beds in the District of Columbia.
- The 12 providers who receive direct DHS grants offer a large set of programs serving youth, families, and individuals experiencing homelessness in and around the District of Columbia. DHS-funded programs accounted for 39 percent of the youth-dedicated bed capacity across these providers and 10 percent of total bed capacity (including beds dedicated to families and individuals experiencing homelessness.)
- DHS-funded service providers are typically experienced entities with operations dating back 10 years or more. They typically offer more than one type of housing, but their transitional housing programs are more likely to have youth focus. All providers are open daily, and a majority are open 24 hours a day, seven days a week.
On program revenue:
- The largest source of revenue for providers is public funding. Government funds account for 63 percent of all program revenue received by all 12 providers, combined. The degree to which an individual provider depends on government revenue varies greatly, but the share of government funding in overall revenue tends to be much higher in smaller organizations.
- DHS funding plays a significant role in the revenue streams of the service providers. The provider reported data suggest that DHS grants, averaged across 12 providers, account for 44 percent of program revenue, but this share could be as high as 64 percent and as low as 24 percent.
- For a majority of service providers, direct federal funding is not a viable source of funding, mostly due to the complex process of applying for and receiving federal funds. These organizations could indirectly be receiving federal funds, through a community-based organization, but only half the providers that responded to the D.C. Policy Center questionnaire indicated grants from community-based organizations are a revenue source.
- The majority of providers that responded to the D.C. Policy Center questionnaire report that 75 percent of more of their revenues (including their DHS grants) are restricted, meaning those revenues are committed to a certain programmatic spending. DHS grant agreements restrict 90 percent of grant budgets, allowing an overhead spending of 10 percent. The majority of organizations surveyed report overhead spending between 16 to 25 percent of their total budget.
On program expenditures:
- According to IRS Form 990 filings, the largest source of expenditures for service providers is related to personnel, including salaries, fringe benefits, and other forms of compensation. Between 2017 and 2021, across providers, employee or contractor compensation averaged at 46 percent of all spending but was as high as nearly 70 percent of budgets for some organizations.
- Personnel expenses have been declining over time, and providers have been increasing the share of their budgets allocated to other types of expenditures, including contracted services. Fixed costs, which include rent, insurance, and utilities, have remained stable over time, at 11 percent of budgets. Expenses associated to fundraising and administrative needs are modest and consume about 5 percent of organization resources, suggesting that providers do not set aside funds for capacity building.
- These numbers from tax filings comport with what is reported on the D.C. Policy Center questionnaire. Data across 11 observations show that personnel expenditures averaged at 53 percent, and the share of personnel expenditures varied between 37 percent and 68 percent. Fixed costs averaged at 13 percent but could be as high as 30 percent.
On the fiscal health of the providers:
- Data collected from 990 forms over a five-year period (2017 through 2021) across 29 observations show that providers have generally been successful in ending their fiscal years with sufficient revenues to cover their expenditures. These data show that the median provider finished the year with a surplus equivalent of 6 percent of total revenue. And for half of these observations (the interquartile range), the end-of-year surplus was between 4 percent and 18 percent. Across the 29 observations, there were three instances in which a provider finished the year with a net operating loss, and in two of these instances, providers closed the year with a deficit equivalent to 15 percent or more of their annual operating budget.
- Calculations based on provider responses to the D.C. Policy Center questionnaire paint a comparable picture. That information also shows a median end-of-year surplus of 6 percent.
- In their responses to the D.C. Policy Center questionnaire, the providers noted that 2020 and 2021 funding has been helped by PPP loans (largely forgiven), which are one-time. Some have been able to backfill these amounts by more aggressively seeking private donations. Some providers liquidated assets through the pandemic to establish reserve funds.
- In their responses to the D.C. Policy Center questionnaire, providers most commonly mention the misalignment between when they receive their funds and when they incur their expenditures as a major financial risk that makes it difficult for them to manage cash flow.
- The second most commonly mentioned risk is the increasing cost of providing services. Some of this has been driven by the COVID-19 pandemic—especially the costs associated with cleaning: 80 percent of providers who participated in the questionnaire identified cleaning costs as a major cost driver.
- Another cost driver is the staff salaries which, providers note, need to be increased to keep existing staff or attract new staff. One provider noted that DHS grants are no longer sufficient to pay for the salaries necessary to attract and retain qualified workers.
- A slow bureaucracy also poses risks. When a prospective staff member is identified, the process of putting them through various clearance processes such as the D.C. Child Protective Registry and the criminal background checks can take much longer than what is tolerable for a waiting candidate.
- The increasing costs associated with staffing, security, and the costs of providing wrap-around services have constrained providers from maintaining or expanding their program capacity.
On estimated unit costs:
- The D.C. Policy Center estimated provider-level unit costs—that is, the cost of maintaining a bed—for each provider, across all its programs and operations per year, regardless of focus or location.
- Estimated unit costs—the spending per bed per year—show a wide variation across providers and years, with an estimated median unit cost of $49,700, and an interquartile range of $40,700 to $63,100. These cost estimates include other wrap-around services that an organization provides, such as transportation, food, and mental health services.
- The unit cost metric is sensitive to the types of housing options offered by the service providers, as well as the wrap-around services they provide. Organizations that primarily offer rapid rehousing programs have the lowest unit costs, with a median annual cost of $25,600 per bed. In contrast, for providers that primarily provide transitional housing and extended transitional housing, the estimated annual median unit cost is $60,700, and for providers that primarily offer permanent supportive housing, it is $56,400.
- The variation in unit costs is smallest for operators of emergency shelters: the median unit cost for emergency shelters is estimated at $44,200 per year, and the interquartile range is narrow, ranging between $41,500 and $45,200 per bed. In contrast, transitional and extended transitional housing programs have a wide range of unit costs. The interquartile range of unit costs for providers that primarily provide transitional and extended transitional housing services is between $42,600 and $69,900.
- Unit costs are lower and less varied for smaller providers with fewer than 100 beds across all their programs (typical size for DHS grantees). But unit costs are also higher for providers whose programs more heavily focus on youth. Organizations where less than a third of the bed capacity are dedicated to youth have a median cost of $42,000, whereas organizations where more than two-thirds of the bed capacity are dedicated to youth have a median cost of $57,000.
On DHS grants:
- According to grant information received from DHS, in 2021, the agency awarded a total of approximately $14 million in grants across 12 service providers and 25 different types of programs, supporting a total capacity of 373 beds.
- Collectively, DHS grants made up an estimated 20 percent of total revenue reported by the providers across all programs, including programs not funded by DHS. For a majority of the providers (7 out of 12), DHS grants account for under 25 percent of their total revenues at the organizational level. For four providers, DHS grants make up more than half of their organizational revenue.
- Grants for transitional and extended transitional housing programs accounted for 70 percent of the youth bed capacity supported by the District government, and grants for emergency housing programs supported approximately 20 percent of total capacity.
- DHS grants can be used to pay for program expenses, overhead, transfers, and fixed costs. In 2021, program expenses were equivalent to 67 percent of all DHS grants, unrestricted overhead funding was 9 percent, transfers were 9 percent, and occupancy costs were 15 percent.
- Across all programs, providers spend 85 percent of their grant dollars on salary and fringe benefits. These shares are particularly high for permanent supportive housing programs and rapid rehousing programs.
- DHS grants, when divided by the number of beds they support, averaged just under $40,000 in 2021. This is approximately equivalent $3,325 per month, or about $500 less than what the Economic Policy Institute projected as what a single adult would need to maintain an adequate standard of living in the District of Columbia for 2021.
- The highest grants per bed were received by programs offering transitional and extended transitional programs, at $44,136. Emergency housing programs, on average, received $28,065 per bed.
On the tension between adequacy and leverage:
- DHS must balance two factors in grant decisions: providing adequate supports so providers can maintain their current capacity, while at the same time, leveraging grant dollars in a way that incentivizes new beds and new programs.
- Comparing provider unit costs across all programs they offer to funding received per bed shows that for the median provider, DHS grants covered approximately 81 percent of the institutional cost of providing a bed (across all programs offered). For half the providers, the per-bed grant received from DHS can cover 60 to 81 percent of their typical unit cost.
Recommendations
Beginning Fiscal Year 2018, the District began to significantly increase the grant funding for service providers that are serving youth who experience homelessness. The investments set aside for service providers in the District’s budget are almost entirely paid for by the District’s local recurring revenue, with a small, one-time amount set-aside in Fiscal Year 2022 from federal fiscal stability funds provided through the American Rescue Plan Act.16 Most of this funding is recurring: In addition, the Fiscal Year 2023 budget has provided $2.3 million in ARPA funding, which is not likely to continue in the future.
While use of recurring local funds protects budgets from cuts in normal years with robust growth, the continued economic impacts of the pandemic make such growth unlikely: at present the four-year financial plan shows that recurring revenues are not covering recurring costs through the financial plan period, and the District is using over $2.4 billion of one-time resources to balance its budget and financial plan through Fiscal Year 2026. It is possible that by FY 2026; the economic picture will improve to bring recurring revenues and recurring expenditures in balance. But if this does not happen, the city would have to consider cuts, which could have implications for the future of the DHS grants.
Given this fiscal picture, it will be important for both the service providers and the DHS to have clear and realistic expectations about the future of grants funding and what providers will have to do to cover their costs. This will require better understanding of the cost structure, and perhaps a different funding approach. The future will likely bring additional stress on service providers. Specifically, inflation will likely continue pushing costs up both by putting upward pressure on wage and salary expenditures and increasing the cost of basic goods and services. Providers are also looking for greater flexibility in funding use, adjustments for inflationary pressures, and easing or removal of non-fiscal barriers or impediments for service providers. Finally, it would be important to create means of financial resiliency for service providers and form a shared understanding about better leveraging grant dollars.
This report offers three sets of recommendations: systemwide recommendations that can help increase funding efficiency and lead to more effective use of public funds, recommendations for providers that can improve their financial management, and recommendations for the D.C. government and the DHS, than can help reduce operational risks for the providers.
Systemwide recommendations:
- Develop better definitions of service for funding purposes. At present, there is great variation in both DHS funding levels, and spending levels across providers and programs. However, there is little information on how much of these differences are driven by actual program costs, and how much are legacy differences that date back to original funding decisions. Creating additional transparency around funding decisions can be achieved a few different ways. For example, tiers of service can be created which clearly map to service levels and funding levels. Additionally, better definitions of different types of housing could better illuminate requirements and funding levels needed for each service—specifically regarding emergency housing versus shelters, and transitional versus extended transitional housing.
- Conduct an adequacy study. This responses to the D.C. Policy Center conducted questionnaire were not sufficient to determine the adequacy of the funding providers receive from DHS, and whether funding is sufficient to incentivize new capacity. For this reason, the report used financial information from organizational filings with the IRS to analyze program cost structures. Most providers that receive grants from DHS offer housing services to clients other than youth (individuals and families experiencing homelessness). Additionally, most providers offer multiple types of housing with different cost structures. Therefore, the adequacy analysis conducted for this report is an approximation. An adequacy study conducted by active participation of providers can develop a clearer picture of providers’ needs and capacity to meet these needs.
- Use government investments to leverage non-D.C. government funds. Better leveraging of public funding can help create additional capacity and resiliency in the system. DHS already coordinates some of its funding with community-based organizations. But additional collaboration with local or national philanthropic organizations could increase the amount of grants or gifts from these sources. To achieve this, DHS and service providers can work together to develop a case for support for their programs, including a clear statement on the government’s funding levels, as well as providing acknowledgement that service providers will require non-governmental supplements to their DHS grant budgets to be able to continue their services.
Recommendations for providers:
- Consider ways to negotiate more flexibility in funding. Provider overhead expenditures vary between 16 to 25 percent of program costs, which is higher than the 10 percent indirect cost recovery cap imposed on the DHS grants. To increase flexibility in funding, providers should consider negotiating a higher rate for cost-recovery with the federal government or with the D.C. government, or alternatively providing information to DHS that would allow the agency to agree to a higher indirect cost-rate, which is allowable under D.C. Code § 2–222.01.
- Strengthen financial management and invest in organizational capacity. While this study is not an audit of provider finances, the report’s findings suggest that financial reporting and organizational capacity among the providers can be improved. Both IRS filings and information provider responses to the D.C. Policy Center questionnaire show that housing providers invest only a small portion of their resources in administration and development. Provider filings with the IRS can be missing, or annual financial reports are not always available for all providers or could be of varied quality. Some of the delayed payments from DHS are due to incomplete financial documentation, lack of supporting information, or missing 990 filings. Providers can improve financial managing and increase organizational capacity by looking for help from philanthropic organizations that focus on capacity building. The D.C. government can also be a source of training.
Recommendations for DHS and D.C. government:
- Adjust payment schedules to meet provider needs. The District can improve financial resiliency among service providers by matching its payment schedule to providers’ needs. At present, providers frequently mention that the wait between when they begin their grant-funded work and the time they receive payment from the District can be two or three quarters, creating cash management problems. If the District’s fiscal year structure is the main cause of this problem, this issue can be addressed by budgeting funds across different fiscal years or by allowing advance payments (similar to early payments Local Education Agencies receive on their per-pupil funding prior to the beginning of the fiscal year since school year begins three months earlier).
- Clearly communicate grant timelines and requirements. Providers have noted that information about grant requirements and changes in grant requirements and timelines have not been communicated adequately. While due diligence is a central part of funding, perhaps this issue can be addressed by investing in organizational capacity at DHS or by providing additional supports to service providers, so they are fully aware of all that is necessary to successfully meet grant requirements including reporting requirements. DHS can also consider adjustments to the invoice approval process and staff retraining to reduce delays.
Remove non-financial, programmatic, and regulatory constraints on providers. Providers have noted that delays in receiving clearance from the District’s Child Protective Registry have made hiring difficult. There is some evidence that this slow pace of clearance is impacting D.C. government’s operations as well: Lack of substitute teachers and paraprofessionals at D.C. Public Schools is often tied to the long and uncertain clearance process. Adding capacity to the Child and Family Services Agency may be necessary to ease this pain point. Providers are also worried about legal confidentiality requirements that can be at odds with housing referral requirements. DHS should work with service providers to understand the conditions under which this prevents client placement, and work toward a regulatory or legislative fix.
Appendices
For appendices, please see the PDF version of the report.
Endnotes
- The plan can be accessed at https://ich.dc.gov/page/solid-foundations-dc-comprehensive-plan-end-youth-homelessness.
- According to the data received from the OCFO, in the approved budget the youth-focused housing service providers have been allocated $20.4 million in local funds and 2.3 million from ARPA funds.
- The same year, the PIT count reported in the Housing Inventory Count report under various youth categories was 503.
- District of Columbia Interagency Council on Homelessness, Solid Foundations D.C. p.14
- United States Interagency Council on Homelessness (2022). Findings—and limitations—of the 2021 Point-in-Time Count. Available at https://www.usich.gov/news/findingsand-limitationsof-the-2021-point-in-time-count
- The End Youth Homelessness Act of 2014 requires the Department of Human Services to conduct an annual census of youth who are experiencing homelessness.
- The most recent census was conducted in September 2021, but data from this census are not yet available.
- This estimate uses the 2019 trends to extrapolate 2021 numbers. The 2019 Youth Census found that 32 percent of the youth were acing unstable housing conditions and 5 percent were unsheltered.
- It is important to note that the Youth Count information shows a slightly different number of sheltered and unsheltered youth combined. It also shows that the total number of sheltered and unsheltered youth declined from 2020 to 2021. For details see 2021 Youth Count results presented by the TCP available at https://community-partnership.org/wp-content/uploads/2022/07/2021-Youth-Count-Presentation-Part-1.pdf.
- Even though the PIT count does not include youth who are living under unstable housing conditions, the demographic profile of the youth who are captured in the PIT count is very similar to the demographic profile of the youth captured by the youth census.
- The Community Partnership (2022). Homelessness in the District of Columbia: Results from the January 27, 2021. Point-in-time Count. Available at https://community-partnership.org/wp-content/uploads/2021/06/Homelessness-in-the-District-of-Columbia-4.27.21.pdf. Retrieved on October 3, 2022.
- It is important to note that this data set does not include all filings by all organizations each year—and especially Fiscal Year 2021—so it does not incorporate any recent changes in fiscal health.
- In two of the three instances where end-of-year surplus is above 30 percent of expenditures, the large revenue appears to be associated with a one-time grant, that might have been committed to fund multiple years of service. The last instance shows a high percentage over a relatively modest operating budget.
- In Fiscal Year 2022, the same 12 organizations received $15.6 million in funding for 24 separate programs. This amount does not include the funding for the TCP and other service providers.
- Economic Policy Institute, Family Budget Fact sheet, available at https://www.epi.org/resources/budget/budget-factsheets/
- Of the $14 million granted to service providers in FY 2021, there was a one-time funding of $1.3 million for youth-dedicated shelter beds for transitionary age youth. This was, in fact, a continuation of the same level of one-time funding in the FY 2020 budget. For details, see Kate Coventry, “What’s In the Approved Fiscal Year 2021 Budget for Homeless Services?” DC Fiscal Policy Institute, October 2020. Available at https://www.dcfpi.org/wp-content/uploads/2020/10/Whats-In-the-Approved-Fiscal-Year-2021-Budget-for-Homeless-Services.pdf