About 95 percent of U.S. households will fill out their 2020 Census information using forms mailed to their house that they will reply to via the internet, phone or mail. In the Washington D.C. region, the self-response rate from these forms varies greatly depending on location, density, race, population and income.
What are Census self-response rates?
The US Census Bureau is currently engaged in counting every person who lives in the United States as part of the 2020 Decennial Census. However, not everyone is counted in the same way: the Census uses different methods to count people living in traditional households, in group quarters (such as dorms, nursing homes, and military barracks), and in transitory locations (such as work camps and homeless encampments).
While a small number of households in remote areas — largely in Alaska and northern Maine — and Native American communities that opt-in, are directly counted by Census personnel, and 5 percent of households — largely rural ones that either do not receive mail delivery or where mailing address information cannot be verified — have Census forms left at their residences by Census personnel, roughly 95 percent of American households—including essentially all households in the Washington region —are in “self-response enumeration areas,” or places where Census forms are mailed to all housing units, and households are required to reply by internet, phone, or mail.
Although “Census Day” was April 1, as of publication, only 57 percent of households in self-response areas nationwide have completed their Census forms. Normally, 45 days later, on May 13, Census personnel would begin visiting housing units that had not submitted responses — whether because they were vacant or because households had not received or had ignored their Census forms — to collect responses in person.
However, the COVID-19 pandemic forced the Census Bureau to suspend all field operations on March 18, which at the time meant hand-delivering Census forms to households without mail delivery. This delivery, which restarted the week of May 4, does not require direct interaction with residents, but it is not clear when it will be safe for Census personnel to begin performing follow-up visits to collect responses in person, which makes it particularly important that people submit their Census forms as soon as possible.
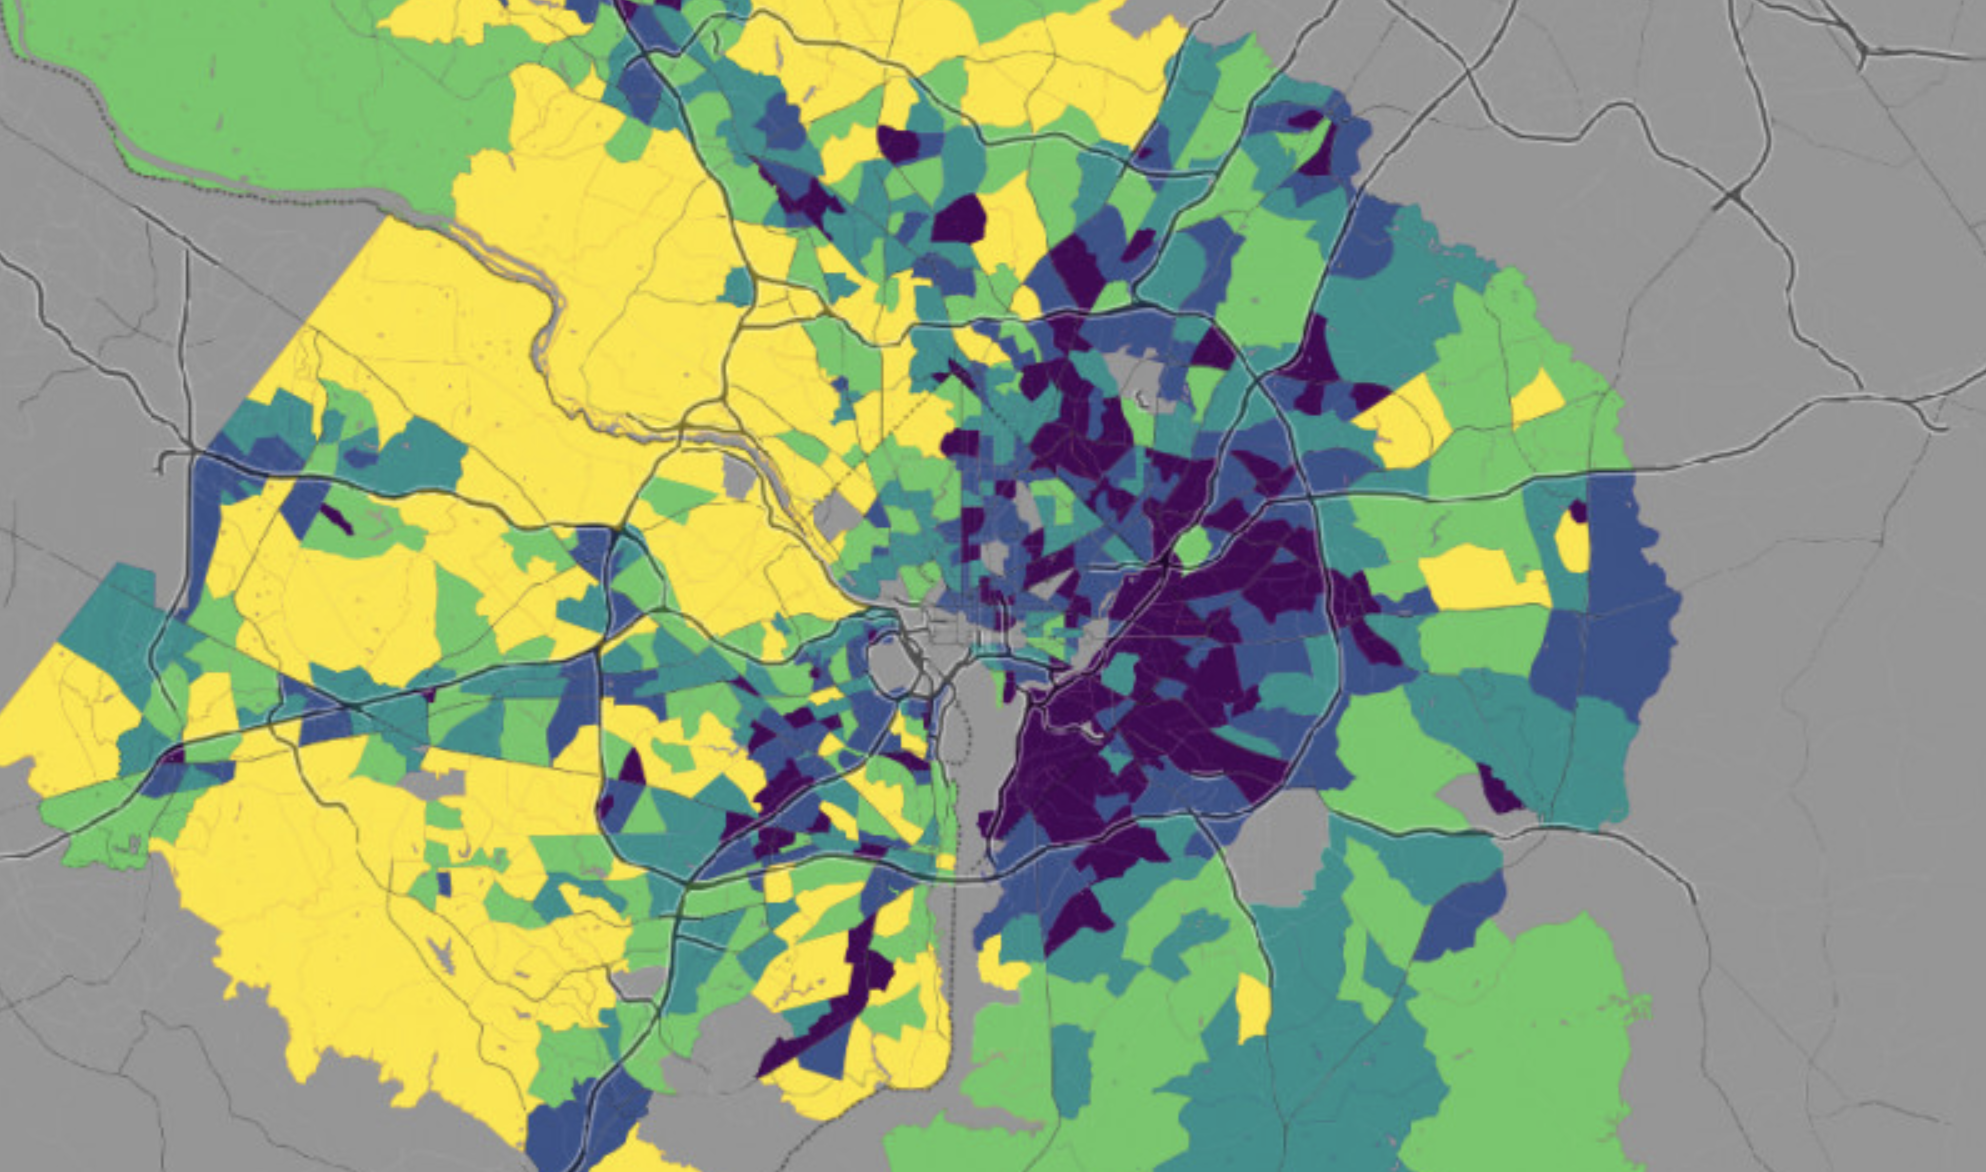
Cumulative 2020 Census self-response rates in the Washington, D.C. region
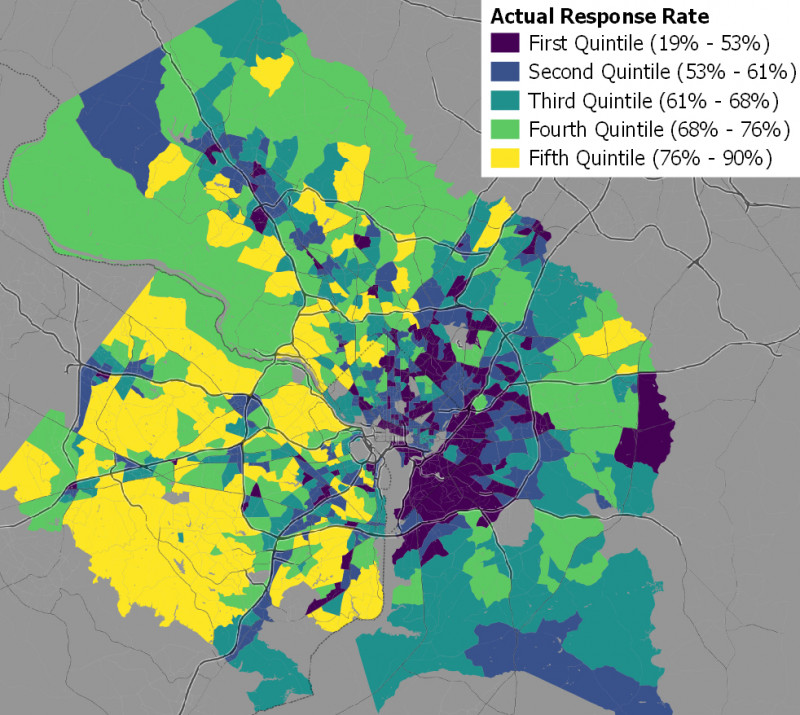
Note: Display is by 2020 Census tract. Tracts with large numbers of group-quarters residents have been removed. Data source: https://2020census.gov/en/response-rates.html.
Looking at census self-response rates across the region
To allow communities to keep track of the response rates for self-response Census forms, the Census Bureau currently provides a map of 2020 Census self-response rates by state, county, city, and Census tract on its website. While this map shows that the average response rate for the Washington region is 64 percent, higher than the national rate of 57 percent, there are major differences in the rate across different places within the region.
Population density of 2010 Census tracts
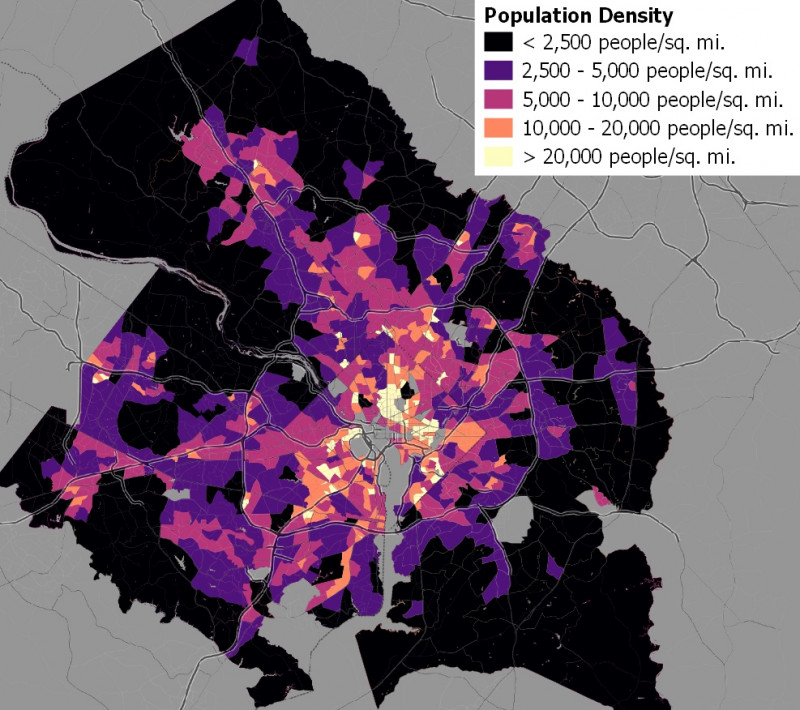
Note: Tracts with large numbers of group-quarters residents have been removed. Data source: 2018 American Community Survey 5-year estimates.
Self-response rates in the Washington region are highest — sometimes as high as 80 percent — in low-density suburban communities in Fairfax County, in Arlington County north of I-66, and in some lower-density portions of Montgomery County. They are lowest — sometimes lower than 50 percent — in Northeast and Southeast D.C.; and in low-income and largely minority communities (which I define here as places where the population is less than 50 percent non-Hispanic white), in Prince George’s County inside the Beltway.
Households that moved into their homes in 2015 or later, by 2010 Census tracts
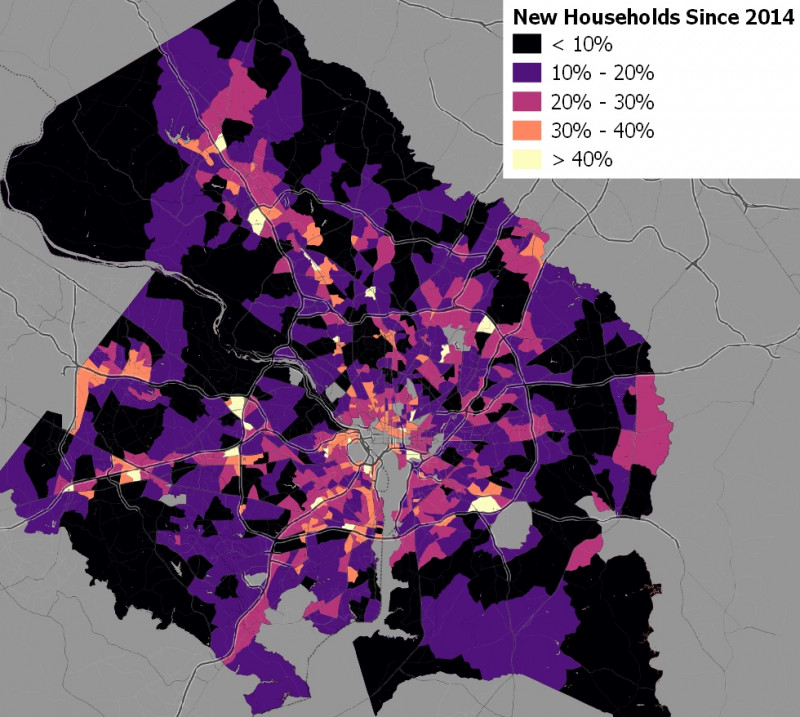
Note: Tracts with large numbers of group-quarters residents have been removed. Data source: 2018 American Community Survey 5-year estimates.
Linear regression comparing self-response rates to 2018 American Community Survey data for the Washington region confirms that there are statistically significant relationships between low self-response rates, population density, median household income, the fraction of residents who are racial and ethnic minorities, the fraction of households that moved into their current home after 2014, and the fraction of households that have low English proficiency.
Median household income, by 2010 Census tracts
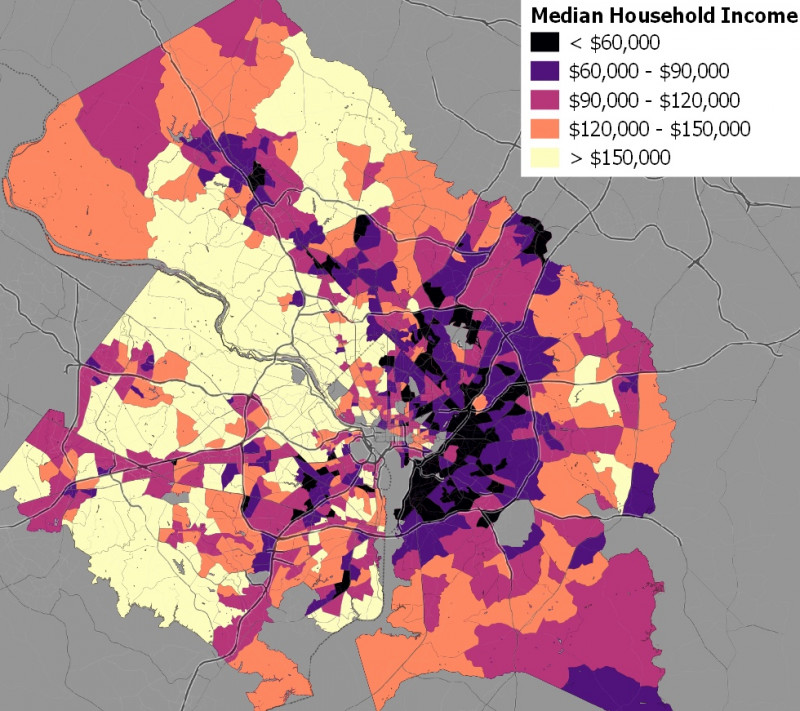
Note: Tracts with large numbers of group-quarters residents have been removed. Data source: 2018 American Community Survey 5-year estimates.
The fraction of households that have submitted their Census self-response forms in each Census tract increased by 1 percentage point for every:
- Increase in median household income (by $13,000)
- Decrease in the share of minority residents (by 7 percentage points)
- Decrease in population density (by 1,100 residents per square mile)
- Decrease in the share of recently-moved households (by 3 percentage points)
- Decrease in the share of low-English proficiency households (by 7 percentage points).
Households with limited English proficiency, by 2010 Census tracts
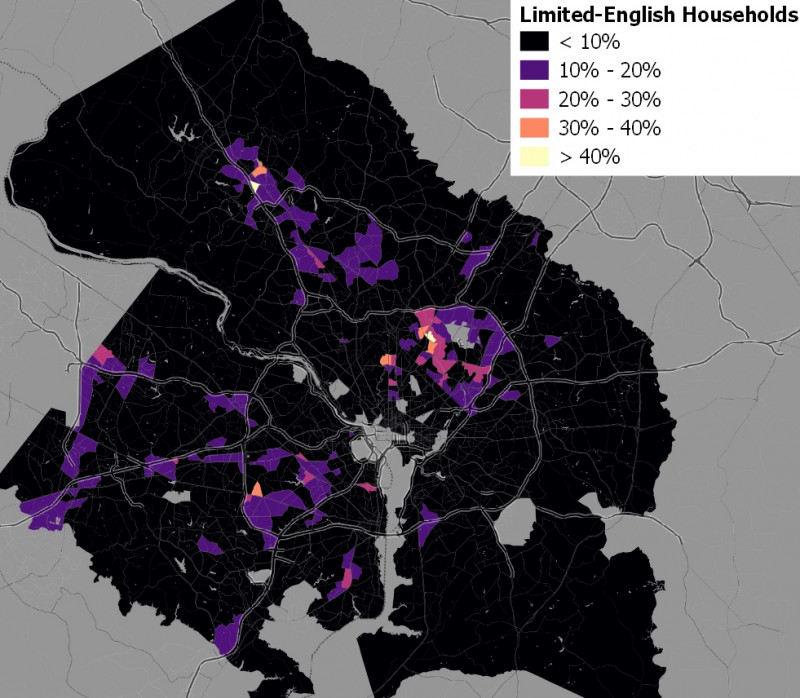
Note: Tracts with large numbers of group-quarters residents have been removed. Data source: 2018 American Community Survey 5-year estimates.
This means that parts of the region with higher population densities and higher concentrations of disadvantaged groups such as racial and ethnic minorities, lower-income households, and people with limited English proficiency are in danger of being undercounted in the 2020 Census, especially if the coronavirus pandemic limits the Census Bureau’s ability to conduct follow-up visits.
Census Bureau predictions of total self-response rates by 2010 Census tracts
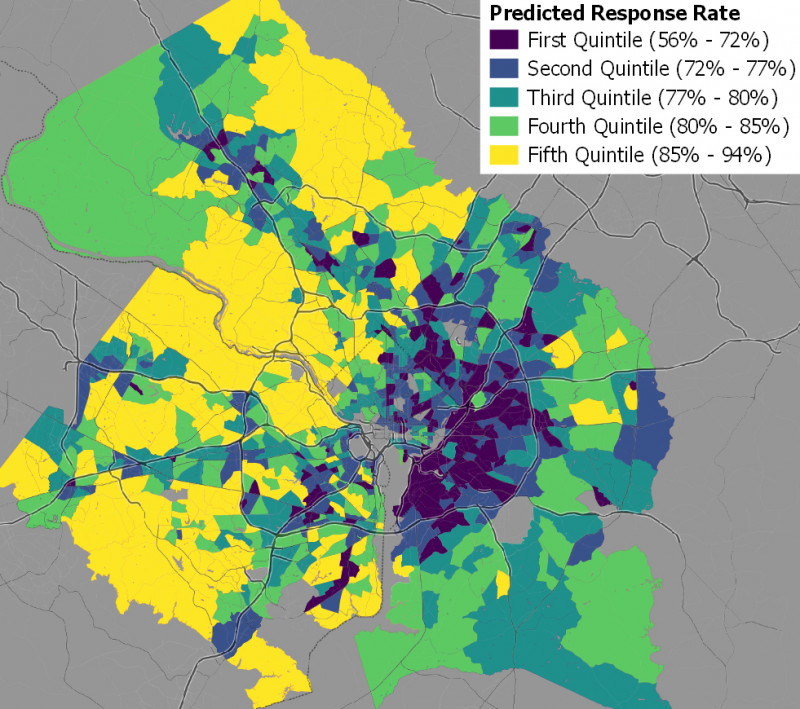
Note: Tracts with large numbers of group-quarters residents have been removed. Data source: https://www.censushardtocountmaps2020.us/
Self-response rates are worse than predicted in some communities
That disadvantaged neighborhoods were likely to have lower self-response rates and be more difficult for the Census to count did not come as a surprise to the Census Bureau or to local governments. As Mike Maciag wrote for the D.C. Policy Center last November, neighborhoods in the region with low median incomes and high concentrations of Black and immigrant residents — particularly east of the Anacostia River in DC and in Prince George’s County — were expected to have lower self-response rates.
Ratio of actual to Census Bureau predicted self-response rates by 2010 Census tracts
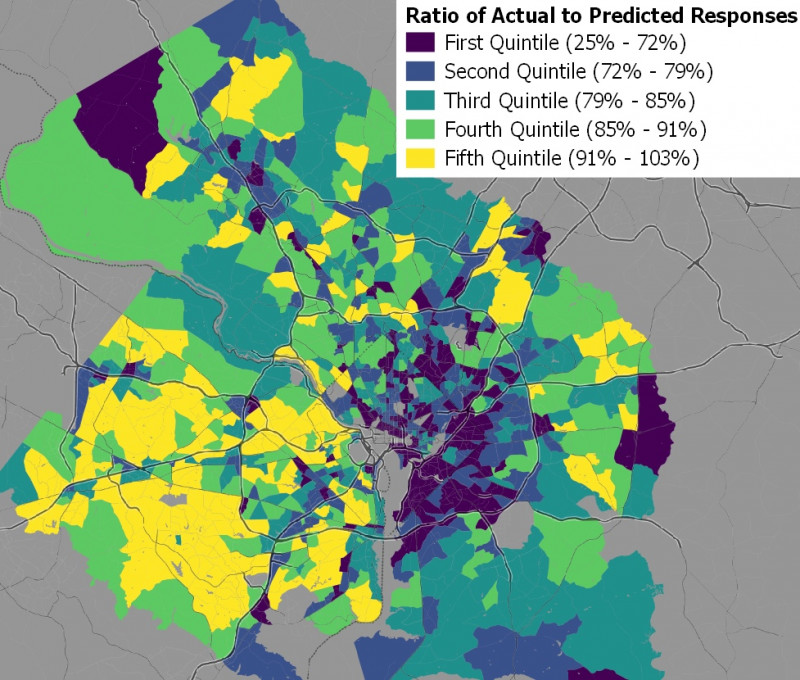
Note: Tracts with large number of group-quarters residents have been removed. Data sources: https://2020census.gov/en/response-rates.html and https://www.censushardtocountmaps2020.us/
However, by comparing the actual self-response rates as of May 4, 2020 with the Census Bureau’s predicted self-response rates, I found that many of the neighborhoods that were predicted to have low response rates are doing particularly badly compared to the Census Bureau’s predictions.
Tracts with actual self-response rates that are less than 75% of what was predicted are concentrated in the District — especially east of the Anacostia River — and in Prince George’s County inside the Beltway, as well as in the vicinities of several college campuses, including the University of Maryland and American University.
A linear regression found that the ratio of actual to expected self-responses increased by 1 percentage point for every:
- Increase in median household income (by $21,000)
- Decrease in the share of minority residents (by 11 percentage points)
- Decrease in population density (by 10,000 residents per square mile)
- Decrease in the share of recently-moved households (by 4 percentage points)
- Decrease in the share of low-English proficiency households (by 6 percentage points).
These results are consistent with the idea that the COVID-19 pandemic is reducing response rates, as it has been hitting low-income and minority populations particularly hard.
Low response rates in the vicinities of college campuses may also be due to college students returning home when their colleges closed for the pandemic: although the Census Bureau wants these students counted at the addresses where they would be living if there weren’t a pandemic, it seems likely that many college students who would otherwise be living at or near school will not have received their Census questionnaires at those locations.
The low self-response rates for minority and low-income communities are especially concerning because Census under-counts in disadvantaged communities will reduce those communities’ political representation and state and federal funding—much of which is allocated proportionally to Census population numbers—for the next decade. It is particularly important that local governments in these areas make additional efforts to increase their constituents’ self-response rates to ensure an accurate count despite the difficulties the COVID-19 pandemic presents for Census follow-up enumeration operations.
Fraction of non-internet self-responses as of May 4, 2020
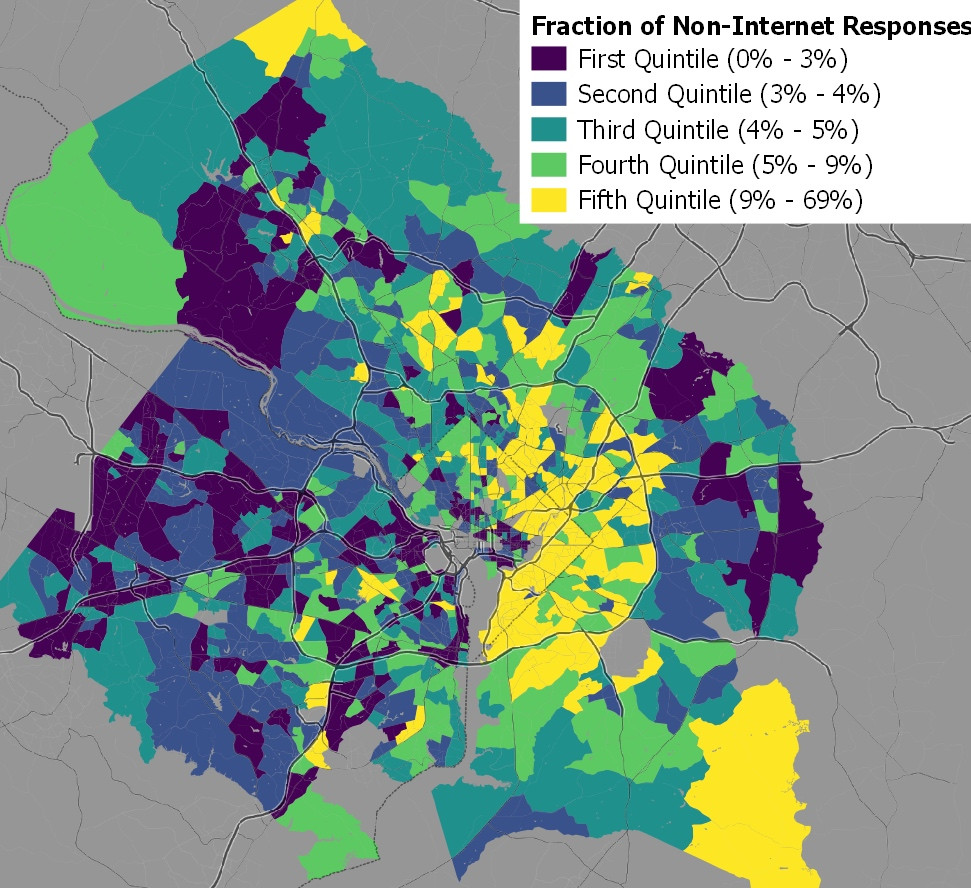
Note: Displayed by 2010 Census tract. Tracts with large numbers of group-quarters residents have been removed. Data source: https://2020census.gov/en/response-rates.html
Non-internet census self-responses
In previous Decennial Censuses, households were mailed forms to complete and mail back. However, for the 2020 Census, the Census Bureau is encouraging households to complete their Census forms online. Although most households in the region that have responded have done so online, roughly 7 percent of them instead responded to the Census by phone or mail. This data provides one possible means of mapping the “digital divide” in the region, as households who responded by means other than the Internet likely have less access to the Internet overall.
Percentage of minority residents in 2010 Census tracts
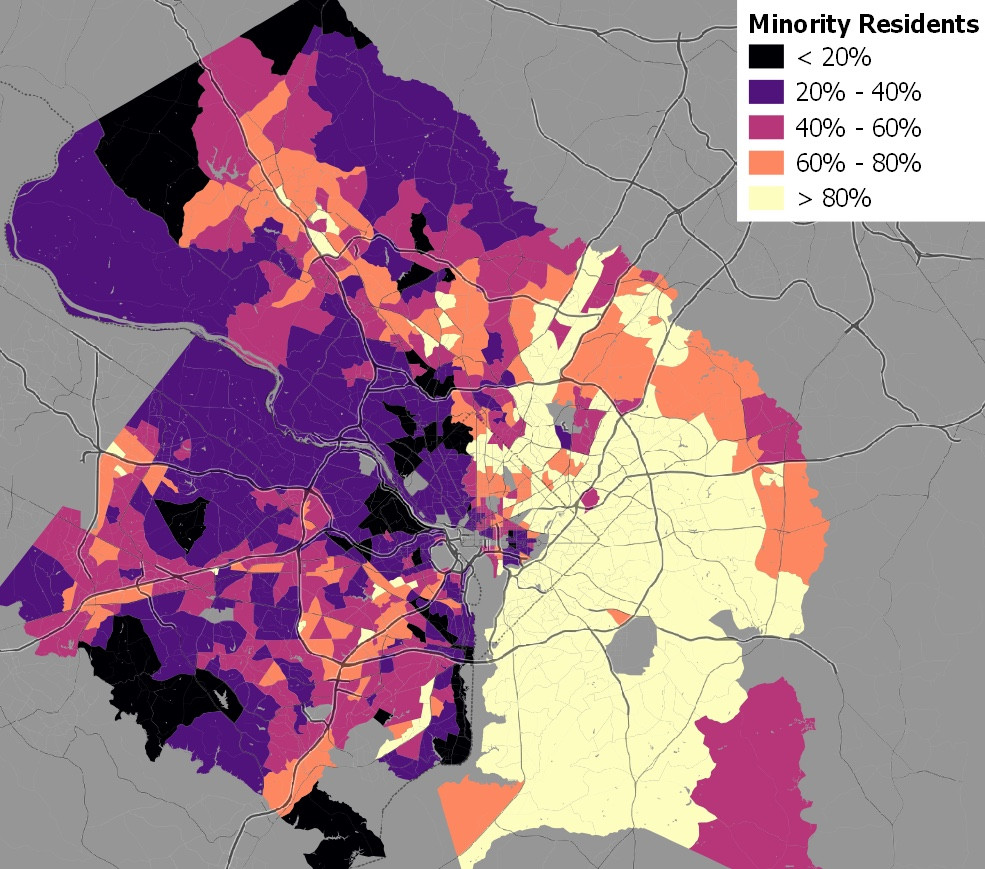
Note: Percentage of minority residents is calculated as all races other than non-Hispanic whites. Tracts with large numbers of group-quarters residents have been removed. Data source: 2018 American Community Survey 5-year estimates.
Mapping out the percentage of Census self-responses made by non-Internet means in the Washington region does seem to support this theory: the highest-income areas tend to have mail-in and phone response rates below 4 percent, while large pockets of mail-in and phone response rates above 25 percent are found in the District east of the Anacostia River, and in low-income and predominately-Black portions of Prince George’s County inside the Beltway.
Heads of household of age 65 or older, by 2010 Census tracts
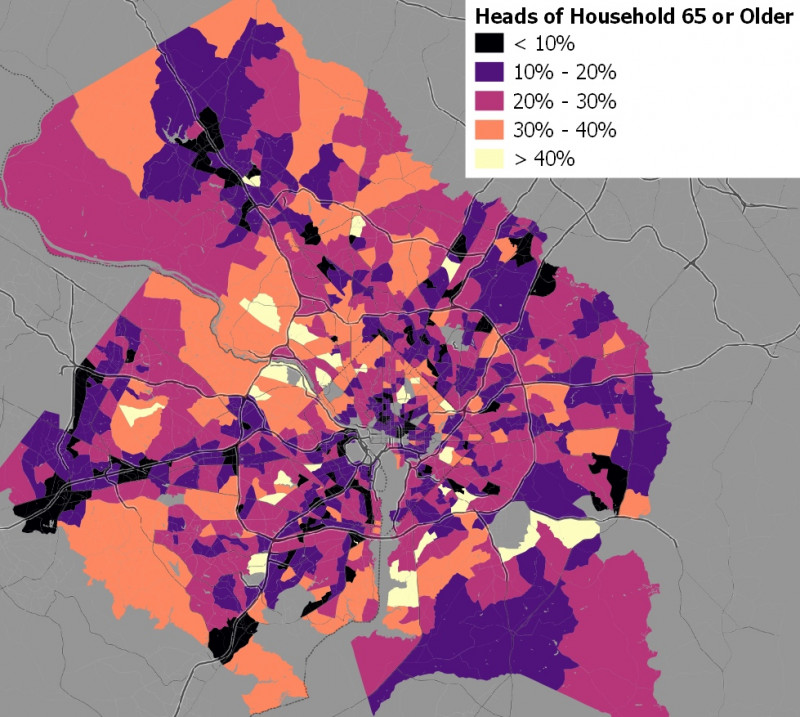
Note: tracts with large numbers of group-quarter residents have been removed. Data source: 2018 American Community Survey 5-year estimates.
Age may be as relevant as race: the Census tract with the highest rate of non-Internet responses— that is, with 68 percent of respondents coming in from non-Internet means — is in the age-restricted development of Leisure World in Montgomery County, which requires residents to be at least 50 years old and which is majority-non-Hispanic white. Other areas with very high numbers of non-Internet responses include the Armed Forces Retirement Home and the Lamond-Riggs neighborhood of Northeast D.C., which has a very high proportion of senior citizens as residents.
Population of immigrants who moved to the U.S. in 2000 or later
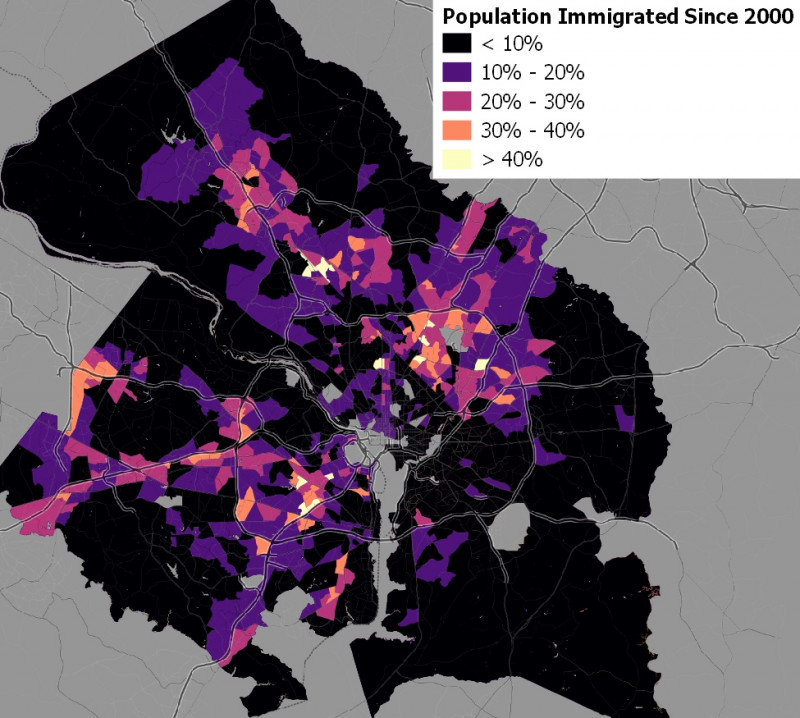
Note: shown by 2010 Census tracts. Tracts with large numbers of group-quarters residents have been removed. Data source: 2018 American Community Survey 5-year estimates.
In any case, linear regression with 2018 American Community Survey data found statistically significant links between the non-internet response rate and median household income, the share of residents who immigrated to the U.S. since 2000, the share of heads of household age 65 or older, and the share of households with no internet or only cell phone internet. A one percentage point increase in the fraction of responses made by non-internet means corresponded to a:
- Increase in the share of households without non-cellular internet at home (by 3 percentage points)
- Increase in the share of heads-of-household age 65 or older (by 3 percentage points)
- Decrease in residents who are recent immigrants (by 11 percentage points)
- Decrease in household median income (by $35,000).
Households with no internet or only cellular internet
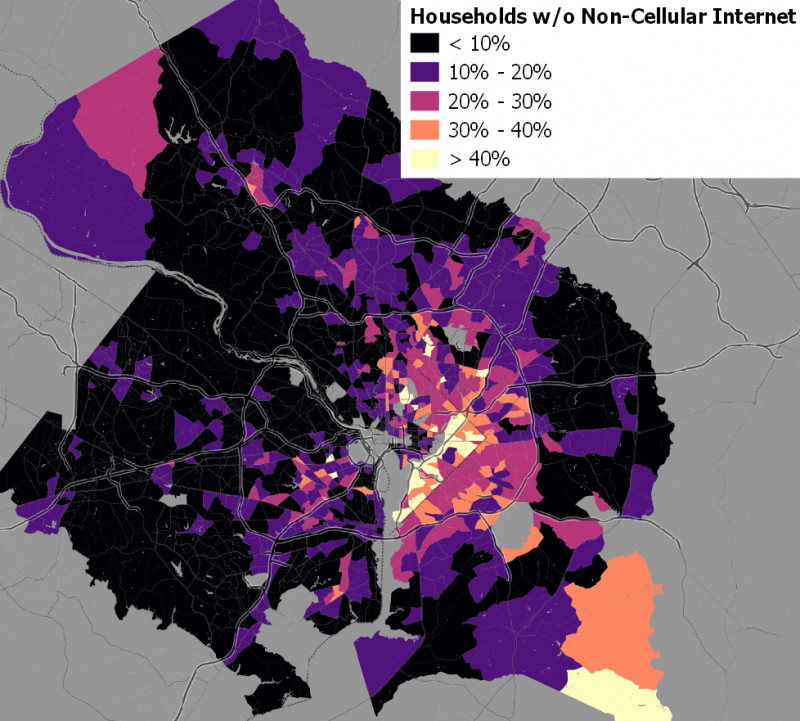
Note: shown by 2010 Census tracts. Tracts with large numbers of group-quarters residents have been removed. Data source: 2018 American Community Survey 5-year estimates.
About the data
2020 Census self-response rates were taken from the CSV file for 4 May 2020 and the online Census response rate map on the same day. This data is tabulated by provisional 2020 Census tracts. Technical data from the Census is available. Data on the Census’s predicted self-response rates were taken from the Center for Urban Research at the City University of New York’s national Hard-to-Count Map. Other demographic data is from the 2018 American Community Survey 5-year estimates, the most recent currently available.
2018 ACS data is tabulated by 2010 Census tracts, and GIS shapefiles are currently only available by 2010 Census tract, so maps were created and data was processed using this tabulation unit. Census tracts with a large number of group quarters residents (>20% in the 2018 ACS data) were removed from the sample by hand, since their demographic data may differ from the demographics of the residents in households and the latter are the subject of the self-response data.
In cases where the 2010 and 2020 Census tracts are not identical, either because a 2010 tract was divided into multiple 2020 tracts or (much more rarely in the Washington region) multiple 2010 tracts were combined into one 2020 tract, self-response rates for the 2010 tracts were estimated based on 2020 tract data from the online map. In the case of multiple 2010 tracts combined into one 2020 tract, the 2020 self-response rate was used for those 2010 tracts. In the case of one 2010 tract being divided into multiple 2020 tracts, the average of those 2020 tracts’ self-response rates was used for the 2010 tract.
Spatial-error linear regression modeling was performed with the R function spatialreg::errorsarlm, with Census tracts weighted by their numbers of households and using a first-order queen contiguity matrix. The R scripts used to process the data and perform this regression are provided.
All three are spatial-error linear models calculated over 949 Census tracts in the Washington region. (This is most of the Census tracts, with ones with low population (less than 100 residents) or high fraction of group quarters residents (more than 20 percent of total residents) removed.) I did a single, multi-variable regression for each of the three sections. Removing the non-significant variables didn’t change the signs or approximate magnitudes of the correlation coefficients of the significant variables.
The dependent variables are (1) fraction of households that have returned their forms—the self-response rate; (2) ratio of actual to predicted self-response rates, and (3) the fraction of self-response rates made by non-internet means.
The independent variables are all also fractions/ratios, except for population density and median income. I’m not sure if this is a problem, but I’m also not sure how to reasonably convert them to fractions/ratios for this. Any advice would be appreciated.
For simplicity of presentation, I took inverses of regression variables to present the data as the number of percentage points (or amount of population density / median income) that the independent variables would need to change for a one percentage point change in the dependent variable.