There’s a lot riding on the 2020 Census. The federal government uses census data to allocate more than $6 billion in annual funding to the District of Columbia for Medicaid, schools, food assistance and dozens of other programs. Across the Washington metropolitan area, the same population totals and decennial count results further direct billions in funding to the Virginia and Maryland suburbs, not to mention their role in determining congressional apportionment. For these reasons, it’s critical that all residents are counted.
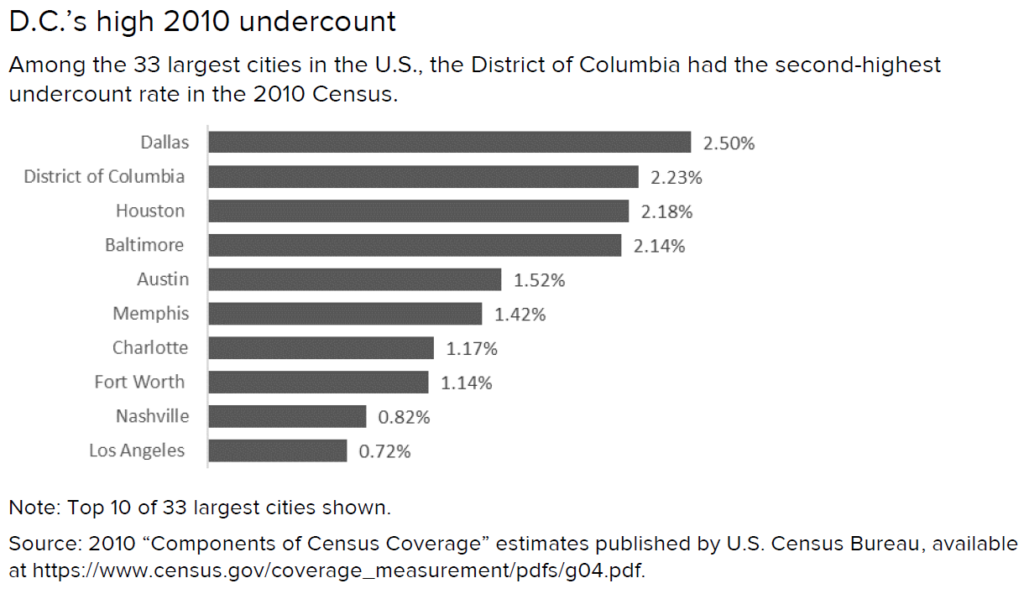
However, government officials, nonprofits and service providers have raised concerns that the 2020 Census could miss significant numbers of residents. For the 2010 Census, D.C. had the second highest share of residents missed among major U.S. cities: about 2.2 percent of District residents were not counted, on net. Census Bureau figures also suggest a few other local jurisdictions similarly experienced relatively high undercounts.
D.C. is especially hard to count for a number of reasons. First, several neighborhoods with high concentrations of poverty historically have responded to the census at low rates. So, too, have the many foreign born residents living throughout in the District. The large contingent of renters in multi-unit buildings further makes it difficult for census takers to ensure that everyone is counted.
With the 2020 Census quickly approaching, we’ve taken a look at neighborhoods where local officials will need to focus their efforts. These “hard-to-count” areas are found throughout the region, but are heavily concentrated in the District. Click here to jump to the Washington Metropolitan Area Hard-to-Count Index, or continue reading to learn more about what it measures and why.
Learning from the 2010 Census
Unlike surveys, which extrapolate results from samples to estimate findings for larger populations, the decennial census represents an exact count of every person and household in the entire United States. This is obviously an ambitious undertaking, with the Census Bureau attempting to reach respondents first by mail, and then in-person. Census takers—also known as enumerators—canvas neighborhoods and follow up with nonresponding households, but aren’t always able to locate and count every resident.[1]
The 2010 Census count of D.C.’s population was about 2.23 percent lower than its estimated actual population, according to the Census Coverage Measurement Estimation report, the second highest undercount of any city with a population of at least a half million. Dallas recorded the highest net undercount rate, at 2.50 percent, with Houston (2.18 percent) and Baltimore (2.14 percent) just behind D.C.
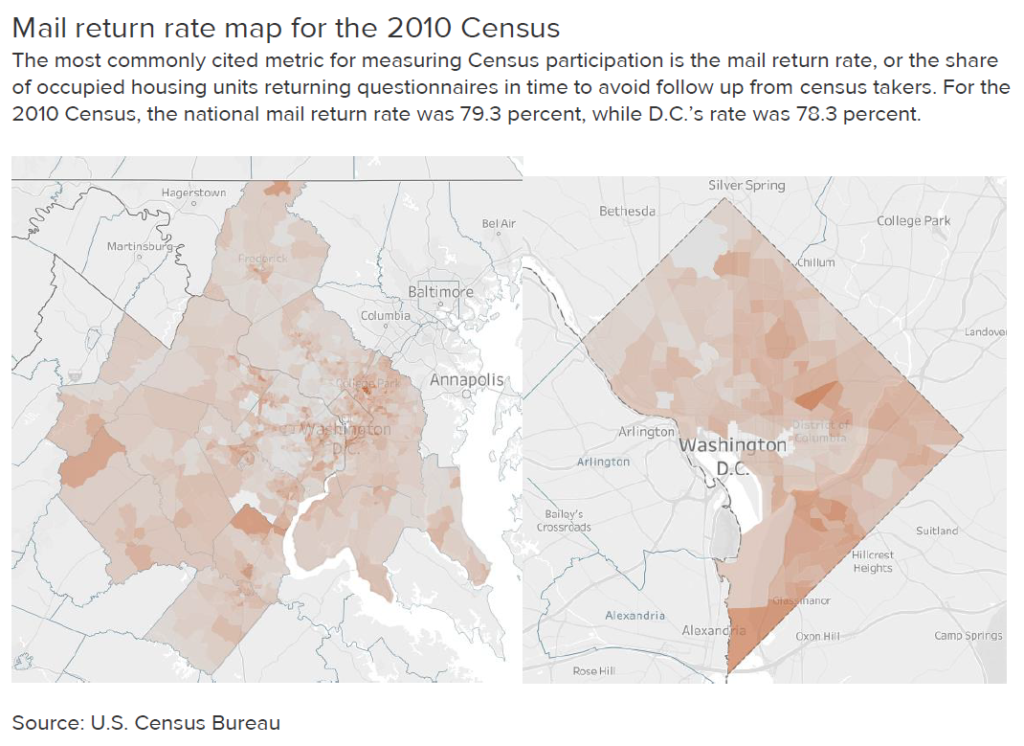
The most commonly cited metric for measuring Census participation is the mail return rate, or share of occupied housing units returning questionnaires in time to avoid follow up from enumerators.[2] Nationally, the U.S. recorded a final mail return rate of 79.3 percent for the 2010 Census, while the District’s rate was 78.3 percent. The Center for Urban Research at CUNY has created a national Hard-to-Count map that highlights parts of the country with particularly low mail return rates for the 2010 Census at the tract level. Several neighborhoods in D.C. and the metropolitan area registered particularly low mail return rates in 2010, including some with rates below 50 percent.
Using the same mail return rate data, the maps below show a more detailed view of individual neighborhoods where residents were least likely to mail back their questionnaires. In D.C., areas with notably low response rates include Ivy City and surrounding neighborhoods, as well as much of Ward 8.
Mailed responses for the 2010 Census are a useful indicator of how the upcoming count might play out, but are subject to limitations. The District’s population has increased by 16.7 percent since 2010—accompanied by noticeable gentrification and neighborhood change—and the metropolitan area’s population has climbed 11 percent. In addition, a boom in new housing construction continues across much of the region, presenting a challenge for Census and local officials who must be ready with up-to-date address information for newly constructed units before forms are mailed.
Which neighborhoods are likely to be especially hard to count in 2020
Residents might miss being counted in the census for a number of reasons. Some never receive questionnaires in the mail. Research suggests others maintain confidentiality concerns, distrust the federal government or don’t see how participating benefits their communities. Historically, residents of disadvantaged areas are among those most likely to be missed. Census Bureau coverage estimates suggest Black and Latinx residents were undercounted in the 2010 Census, while white residents registered a slight overcount.
Many local communities where enumerators have previously encountered difficulties are also home to large numbers of immigrants, a group that’s been the subject of much concern in the lead up to the decennial count. While the Census and other government surveys are confidential (and individual census records aren’t released publicly for 72 years), many people are still wary of speaking to or sharing detailed personal information with census takers. This has been compounded in recent months by the Trump administration’s attempts to add a question about the respondent’s citizenship, which would likely have dissuaded some people from filling out their census forms. While the administration has ceded defeat in its effort to add a citizenship question, advocates and public officials contend the political climate and controversy over the question have already threated the integrity of the census.
Children under age 5 are also frequently undercounted, in part because respondents do not know they should include young children in their census responses, or because they do not feel comfortable sharing that information. Young children are especially likely to be missed if they are living in complex household arrangements or if they are not the biological or adopted child of the responding householder.[3]
Where people reside matters, too. Renters are one group among the most likely to be undercounted – especially if they move frequently – and those living in newly constructed buildings can be missed if census takers do not know a unit is occupied. People in overly-crowded homes are also often undercounted because the person filling out the form might omit some household members out of fear their landlords will take action against them. By contrast, neighborhoods with mostly single-family homes don’t present the same difficulties for enumerators.
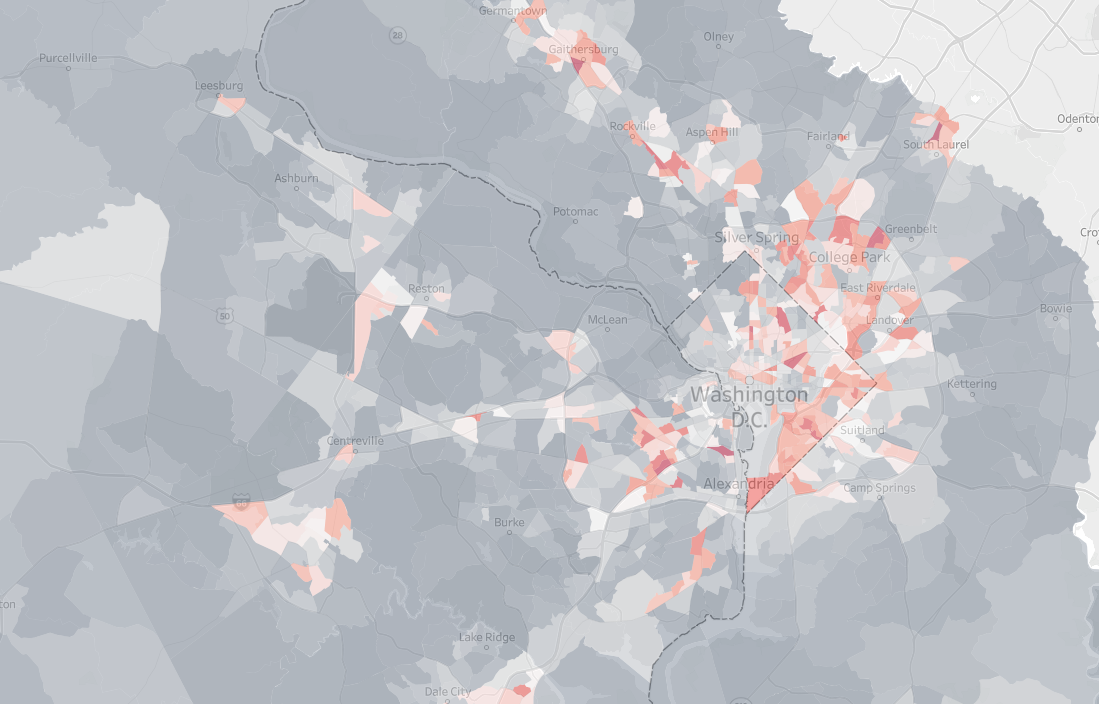
To identify hard-to-count neighborhoods, defined as census tracts, I adopted a methodology developed by the California Department of Finance’s demographic research unit. This approach utilizes 14 demographic, housing, and other measures correlated with undercounts or omissions for all tracts within the Washington metropolitan area. (The California Hard-to-Count Index lists a brief explanation of why each variable was included here.) Tracts were then ranked on each measure for a total hard-to-count index. Click here for an interactive version of the map.
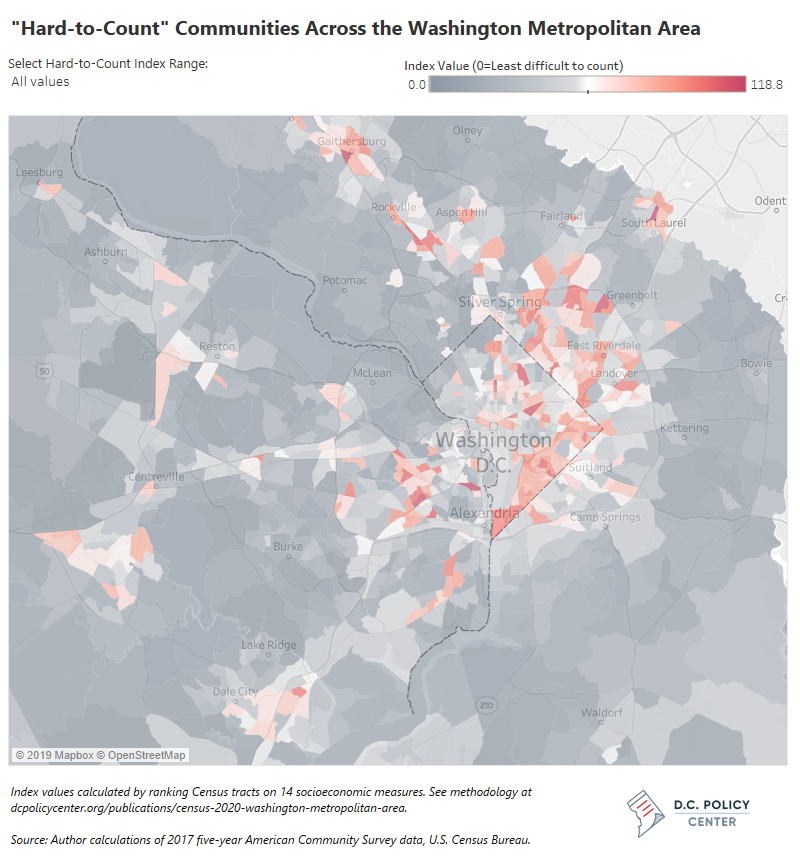
Click here for an interactive version of the map
For the most part, the map mirrors 2010 mail return rates: Much of Southeast and Northeast D.C., along with Prince George’s County and select parts of northern Virginia, recorded relatively high index values. These tracts are most commonly found in neighborhoods predominately made up of rental housing, with large percentages of either foreign born residents or low-income households.
For example, a narrowly-drawn census tract just south of the MARC station in Laurel, Md., consisting almost entirely of apartments recorded the highest hard-to-count index in the metropolitan area. Census estimates suggest many of its residents are poor, born outside of the U.S., or living in crowded housing units, all making it a neighborhood that could pose challenges for the 2020 count. Another tract registering about the same rate was the Arlandria neighborhood in Alexandria, where nearly half the population was born outside the U.S. and about a quarter of households identify as limited-English speaking.
Several D.C. neighborhoods aren’t too far behind. The tract recording the highest hard-to-count index in D.C. borders 14th Street in Columbia Heights. A third of its residents were born outside of the U.S. and many live in poverty; the rate of crowded households – 13 percent – is about the highest of any tract in the entire metropolitan area. Another neighborhood District officials may want to focus their efforts on is a tract comprising Ivy City that experienced a development boom in recent years. According to U.S. Census Bureau survey data, its poverty rate is one of the highest in the region. More than half of households there also lack a broadband Internet subscription, crucial given that Americans will be able to complete the 2020 Census online for the first time, allowing the agency to invest less in field operations than in prior censuses.
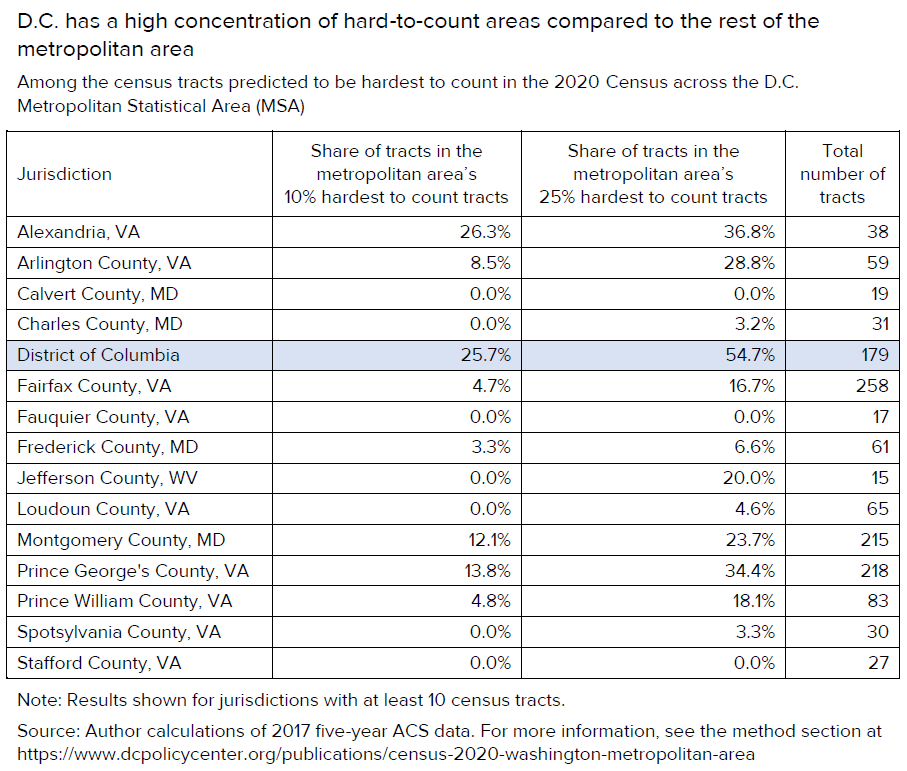
Hard-to-count areas are more common in D.C. than surrounding jurisdictions
Hard-to-count tracts are far more concentrated in the District than most elsewhere in the Washington metropolitan area. Approximately a quarter of D.C. tracts recorded hard-to-count index values in the top 10 percent of all in the metropolitan area, just behind Alexandria for the highest rate of any local jurisdiction. About 55 percent of the District’s tracts similarly ranked in the area’s top 25 percent of hard-to-count tracts, by far the highest in the metropolitan area.
Outreach efforts
Local governments in different parts of the country are pursuing a range of different initiatives to ensure their residents are counted. Many, for instance, are planning to deploy mobile kiosks residents will use to complete the Census in locations with heavy foot traffic. In May, Mayor Bowser launched the District’s Census campaign, while the fiscal 2020 budget includes $2.5 million supporting enumeration efforts. Local and regional foundations, research organizations, service providers and others are also coordinating their efforts to reach hard-to-count populations and ensure an accurate 2020 Census.
About the data
For our calculations of hard-to-count census tracts, we adopted a methodology used by the state of California’s census office. The methodology considers the following tract-level measures:
- Share of the population under age 5
- Share of housing units within a building with three or more units
- Share of households without broadband subscriptions
- Share of nonfamily households
- Share of households that are renter occupied
- Share housing units that are vacant
- Share of housing units that are crowded
- Foreign born share of the population
- Share of adults age 25 and up not graduating from high school
- Share of population with income below 150 percent of poverty level
- Share of households receiving public assistance
- Unemployment rate
- Share of households identified as limited-English speaking
- Share of population relocating from outside the county within the past year
All measures were calculated from the U.S. Census Bureau’s 2017 five-year American Community Survey estimates. Tracts were then ranked on each measure on how they compared to all of the nearly 1,400 tracts within the Washington metropolitan area. For each measure, the tract ranked with the highest percentage was assigned a score of 11, with lower scores to others down to the tract with the median ranking. All tracts with percentages less than the metropolitan area median were assigned scores of 0 for a measure. Scores were then added for all 14 measures for each tract’s total hard-to-count index. Indices ranged from 0 to 118.8, with a median value of 33.4.
For a tool with absolute values, instead of a metropolitan area index, see the Census Bureau’s Response Outreach Area Mapper (ROAM).
D.C. Policy Center Fellow Mike Maciag tells stories with data. Previously, he crunched numbers and wrote for Governing magazine on a variety of policy issues relating to state and local governments. He holds a master’s degree in public administration from George Mason University and undergraduate degrees in journalism and computer science from the University of Dayton. Follow him on Twitter at @mikemaciag.
Notes
[1] For an overview of Census undercounts, omissions, and errors, see Who Is Missing? Undercounts and Omissions in the U.S. Census (2019).
[2] Specifically, mail return rates refer to the number of completed survey forms returned divided by how many housing units received questionnaires, excluding duplicates, vacant units, and those with undeliverable addresses.
[3] Source: Preventing the Undercount of Young Children (O’Hare and Snellings), presented at the regional forum Interventions that Work: 2020 Census and Hard-to-Reach Communities in June 2019.