FOUR | HOW MUCH DOES THE DISTRICT OF COLUMBIA’S RENTAL HOUSING ADVANCE ECONOMIC DIVERSITY AND INCLUSION?
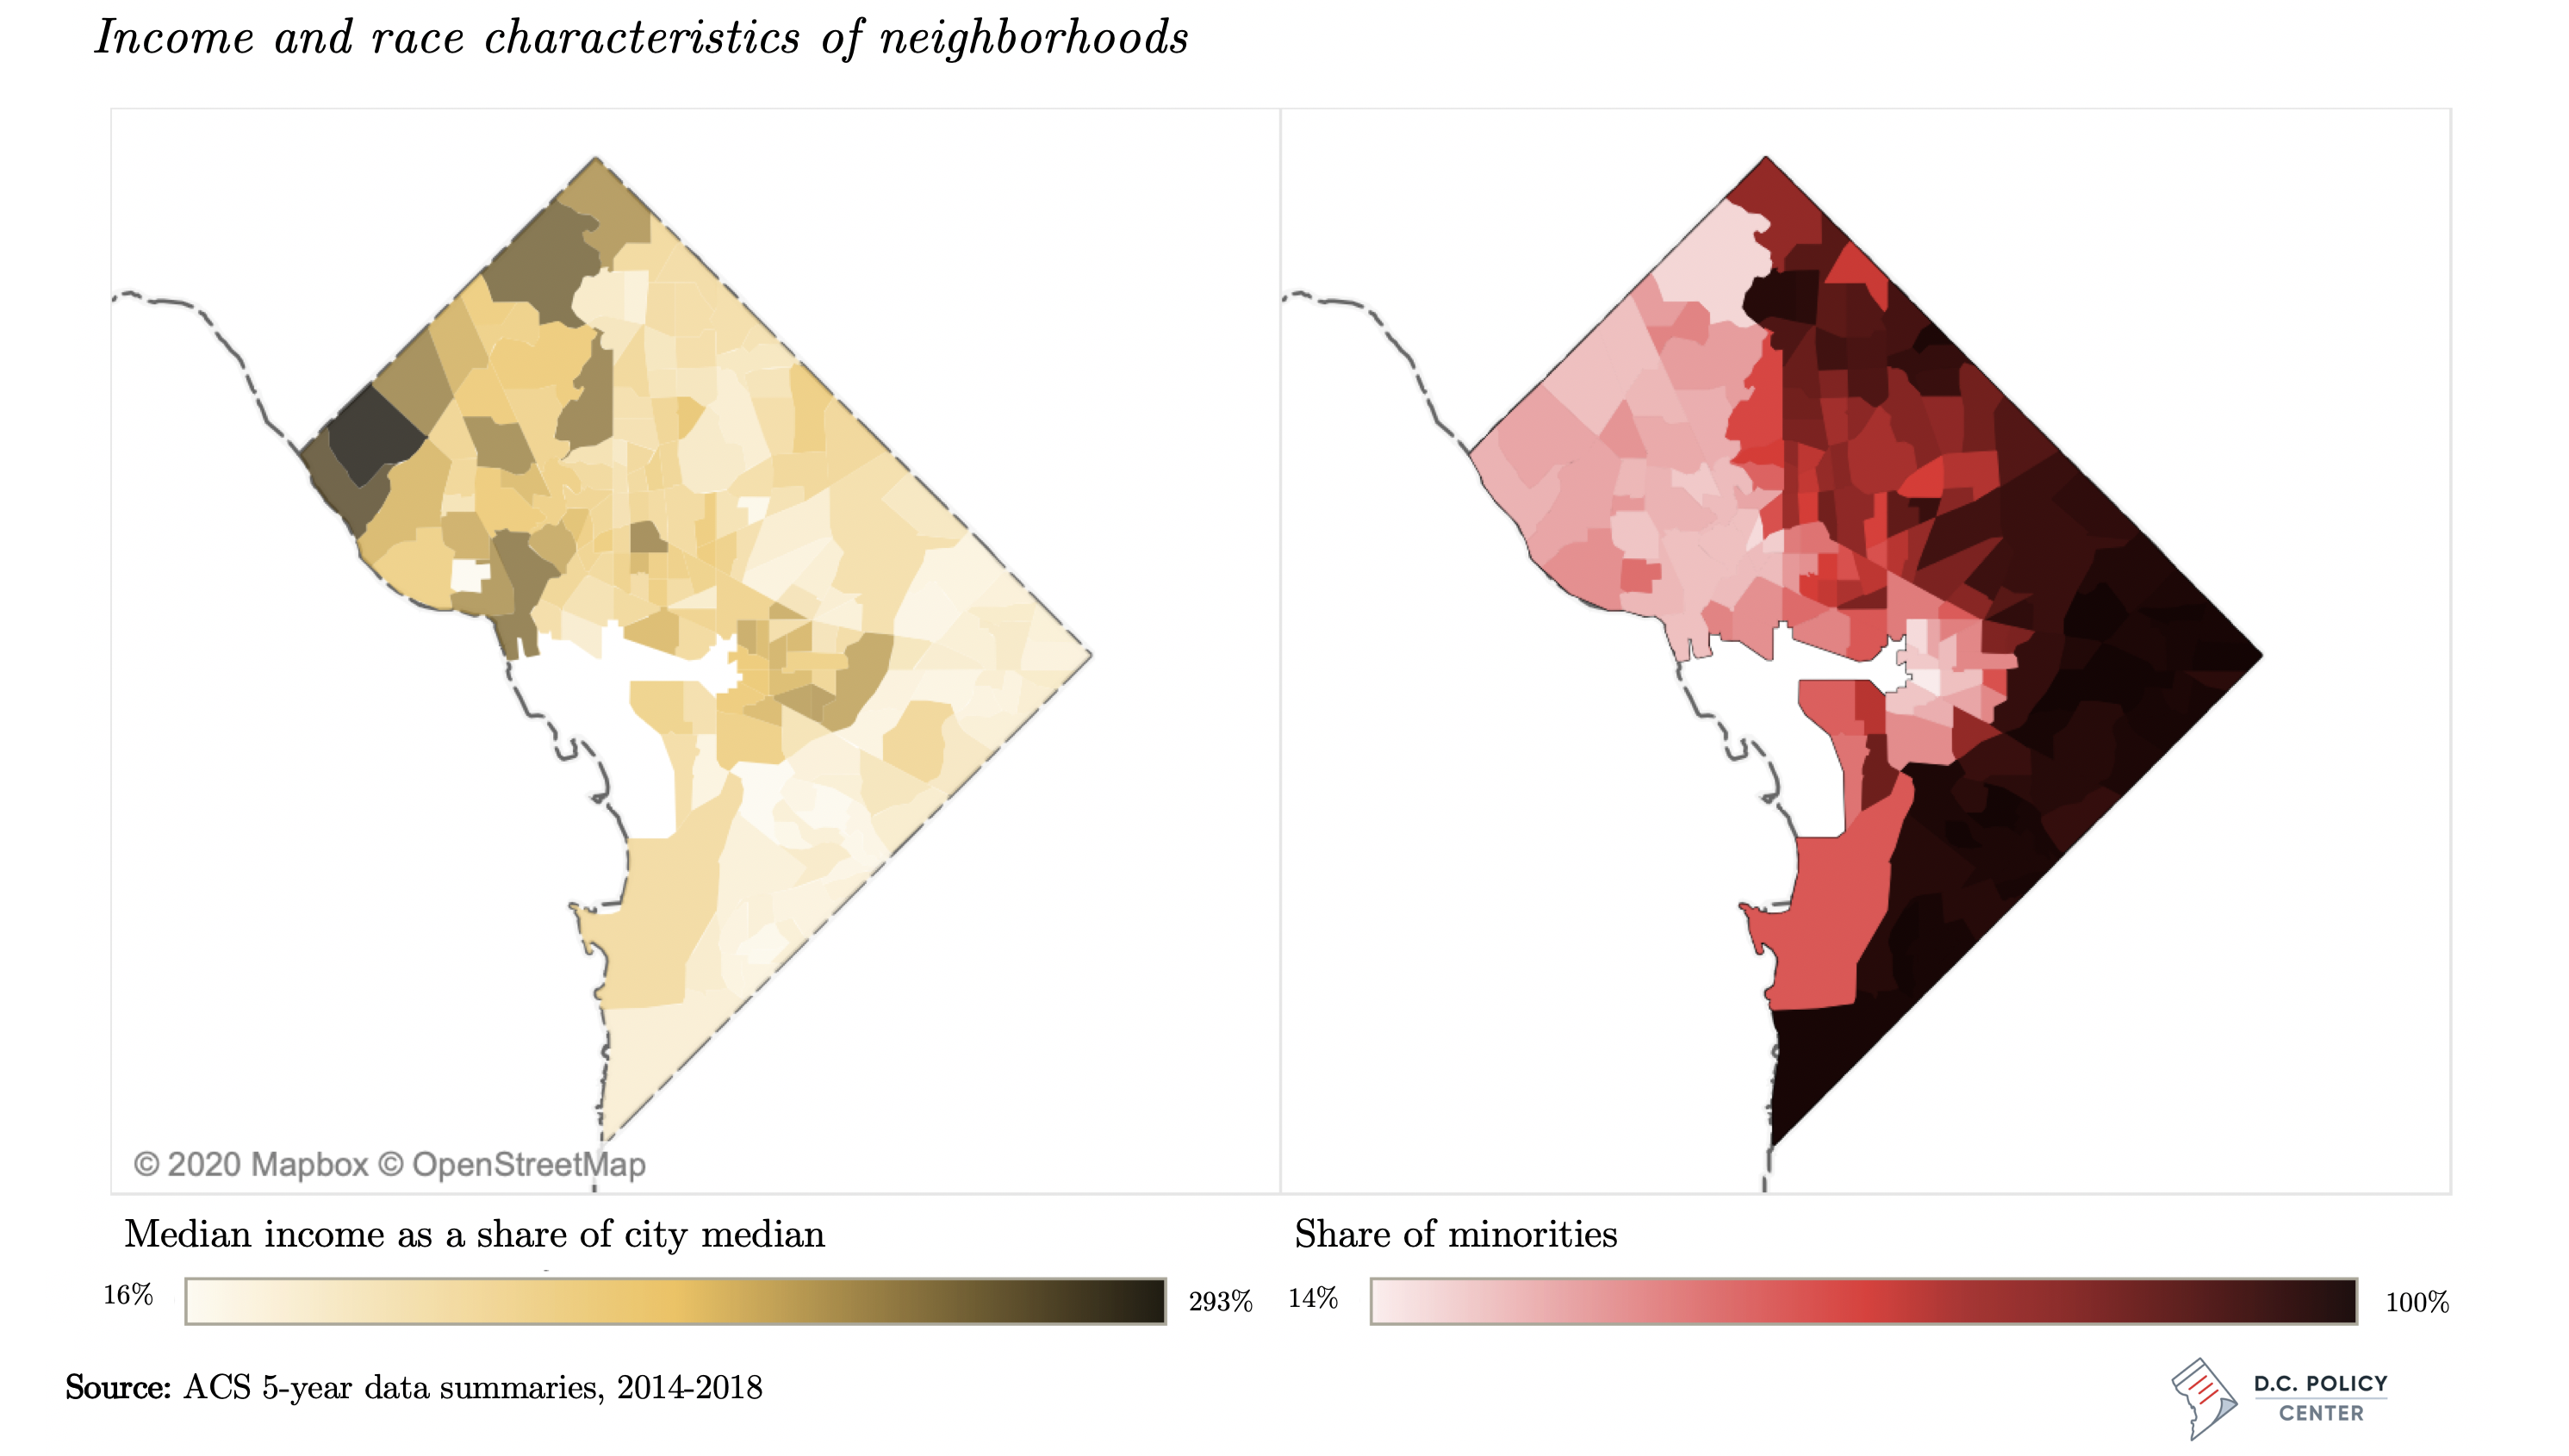
The District of Columbia is an economically segregated city where higher-income households and lower-income households typically live far away from each other. In previous research, the D.C. Policy Center linked the city’s economic segregation to its housing market: neighborhoods where housing is most affordable are separate and far away from neighborhoods where housing is most expensive.[1] This chapter examines whether rental housing is helping break the geographic link between housing costs and resident incomes by creating opportunities for lower-income residents to live in higher-cost (and often better-resourced) neighborhoods.
The financial barriers that households must overcome in order to rent a unit are lower than the financial barriers to buying, so rental housing is generally thought to serve those who have fewer means. But, as shown in the previous chapter, there is a substantial amount of pressure on the District’s rental market from high-income households. Where rents can rise, these households can bid them up. Rent-controlled units, which can be found everywhere in the District, and on balance have lower rents, can potentially be a means of creating more inclusive neighborhoods if they can serve lower-income residents. Shadow rental market units, on the other hand, provide a greater mix of rents across neighborhoods and unit sizes.
This chapter compares rent-controlled housing to the shadow rental market to examine the extent to which each contributes to creating economically diverse neighborhoods in the District of Columbia. This analysis shows that rent-controlled housing is still somewhat economically segregated. Across neighborhoods where rents are high, renters’ estimated rent burdens are relatively low, and where rents are low, renters’ estimated burdens are high. The shadow rental market does appear to distribute housing burdens more evenly across neighborhoods of a ward, and across the entire city, suggesting that it could be a greater source of economic inclusion.
The presence of rent-controlled housing is positively correlated with longer tenure and a smaller loss of residents of color, suggesting that rent-controlled stock, at some level, could be playing a role in mitigating displacement.
Is rental housing in the District a source of economic diversity?
Incomes and rents that prevail across rental apartments do not always move together in the District of Columbia. Renters’ household incomes are highest in Wards 2, 3, and 6, and lowest in Wards 5, 7, and 8. Rents—whether measured per square foot or per unit—also loosely follow this pattern, but the relationship between renter household incomes and rents is not particularly strong.
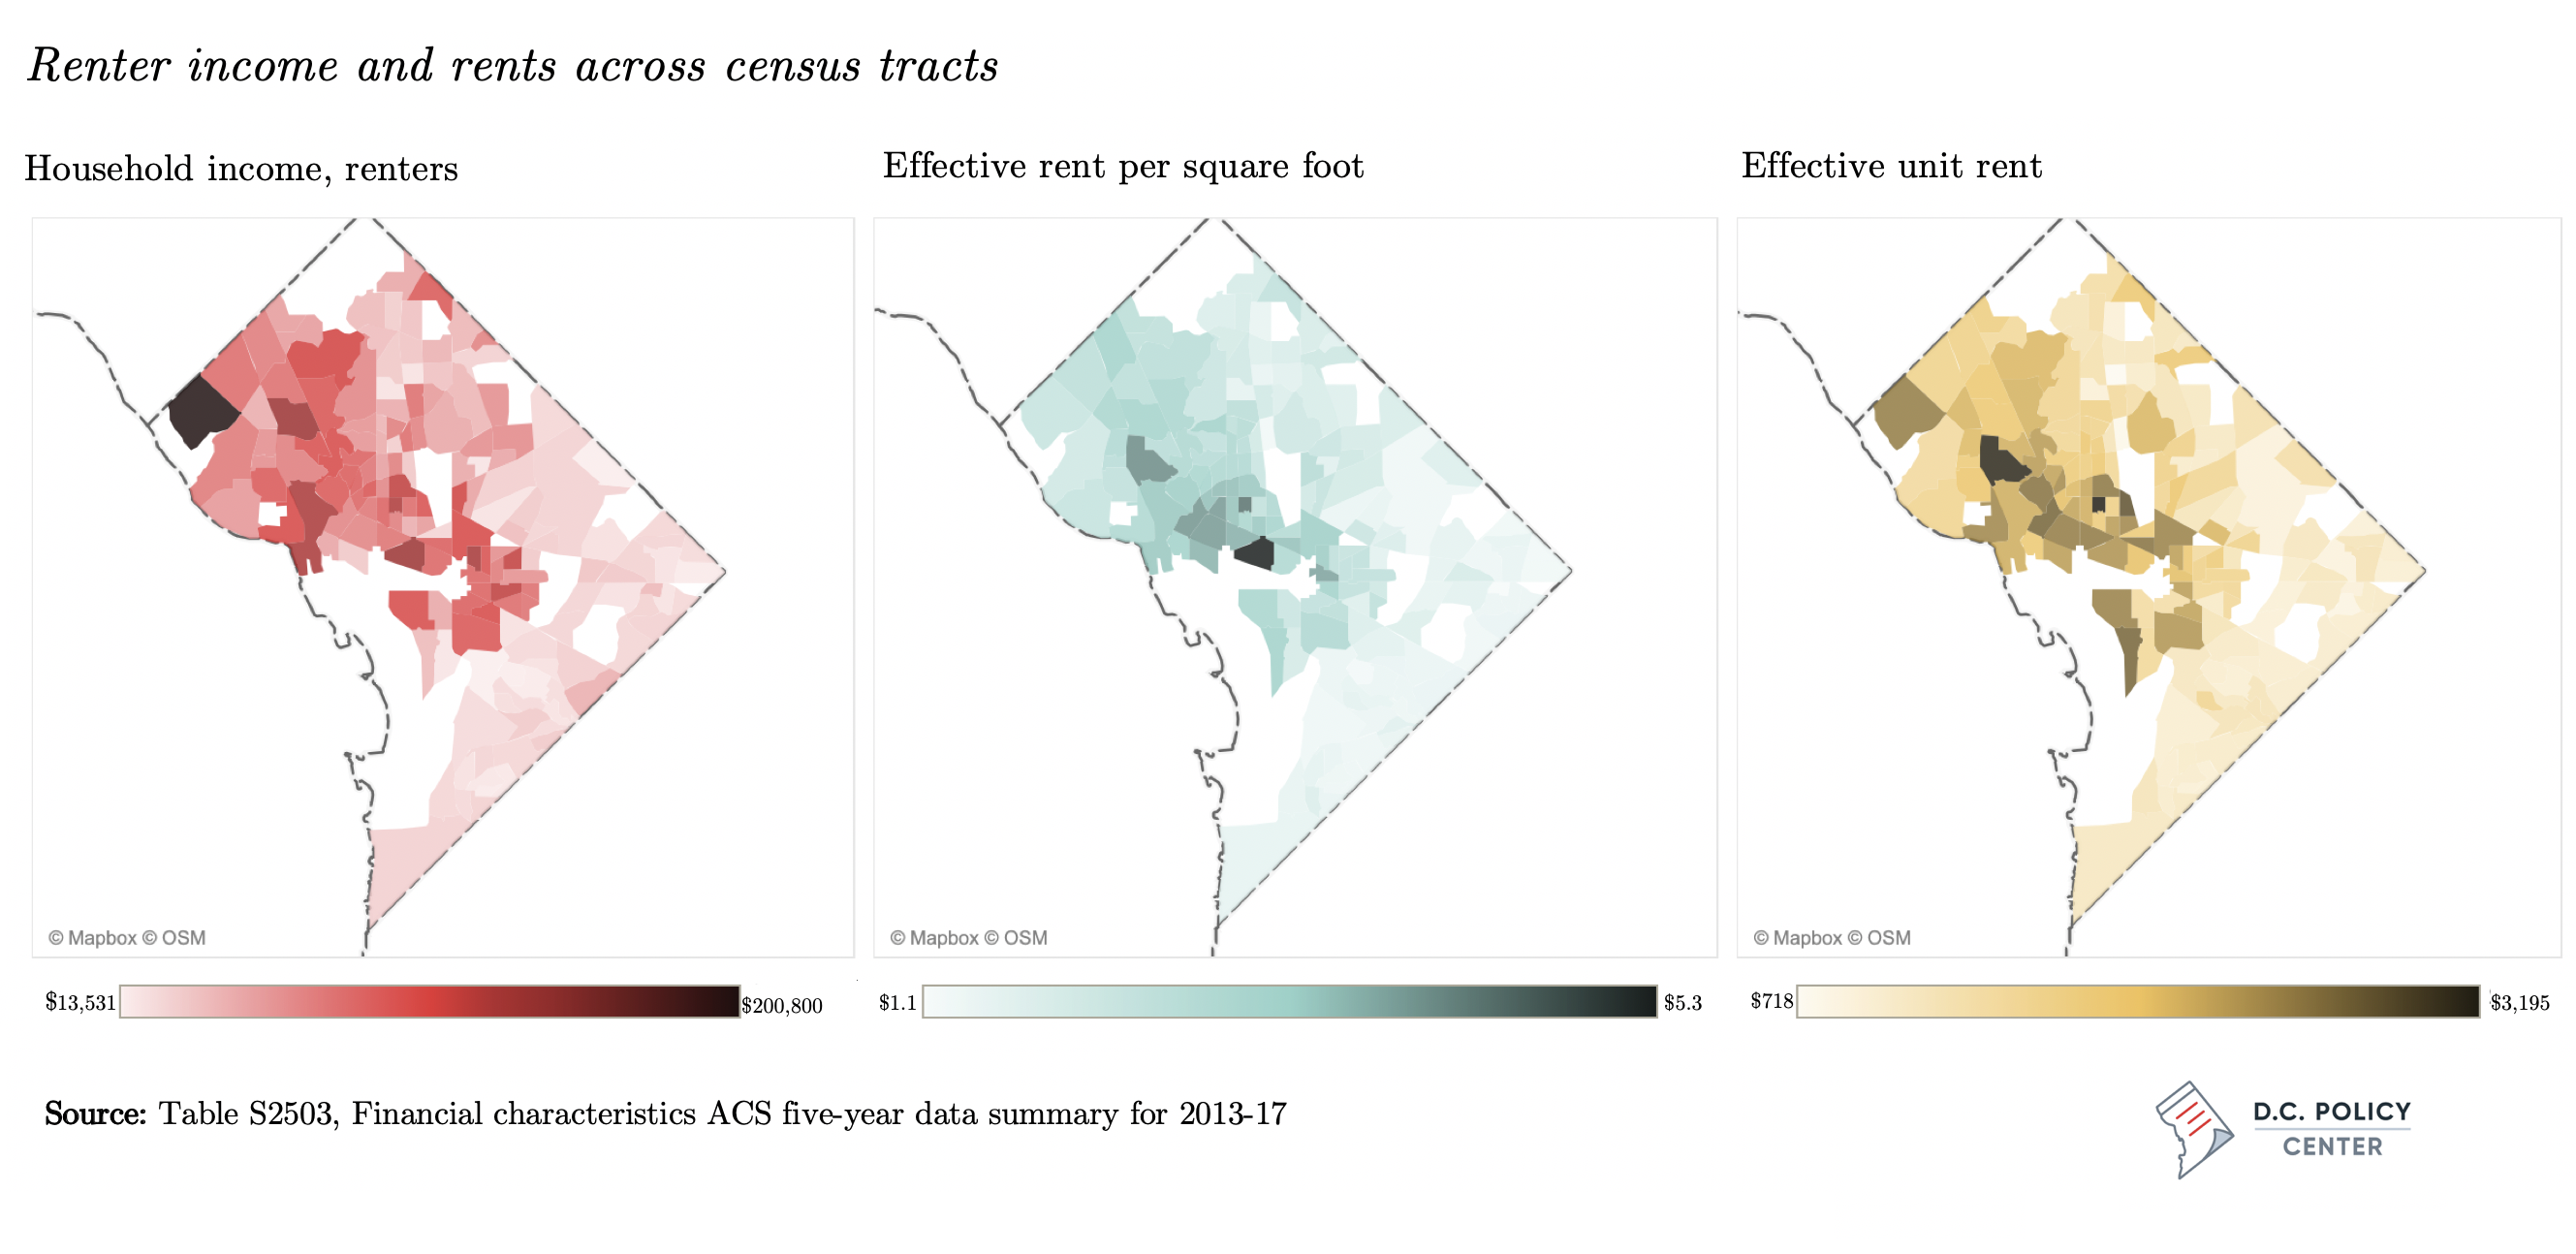
The correlation coefficient between renter incomes and effective rents per square foot is 0.56 when measured for buildings[2] and 0.68 when measured for census tract.[3] Similarly, the correlation coefficient between renter household income and unit rents is 0.59 when measured at the building level and 0.69 at the census tract level. The shadow rental market displays the same feature: the correlation coefficient between median renter income and the median rent measured across census tracts is 0.69. In comparison, incomes and home values are much more strongly related for homeowners: the correlation coefficient between household incomes for homeowners with a mortgage and housing value is 0.90 when measured at the census tract level.
Correlation coefficients for income, rents, and housing values
| Variable 1 | Variable 2 | Measured at the level: | Correlation Coefficient |
| Median renter household income | Average effective rent per sq. ft.in rental apartments | Building (for rents) | 0.56 |
| Median renter household income | Average effective rent per sq. ft.in rental apartments | Building (for rents) | 0.59 |
| Median renter household income | Median effective rent per sq. ft.in rental apartments | Census tract | 0.69 |
| Median renter household income | Median effective rent per unit in rental apartments | Census tract | 0.69 |
| Median renter household income | Estimated median rent in the shadow rental market | Census tract | 0.66 |
| Median homeowner household income | Median value for a home with a mortgage | Census tract | 0.90 |
Source: ACS Table 2503, Financial Characteristics, 2014-18 ACS Five-Year Estimates and CoStar.
Can this weaker relationship between rents and renter incomes across different neighborhoods be an indicator of greater income mixing across rental housing compared to owner-occupied housing? The answer is yes, if units with high rents and units with low rents can be found close to each other and serve renters of different income levels, thus creating economic inclusion. But this weaker link between renter incomes and rents could also simply be a consequence of rent control. Since rent control caps rent growth but does not have income targeting, higher-income households can as easily occupy lower-priced units, breaking the link between incomes and rents. This would not be an indicator of economic inclusion, just inflexible rents.
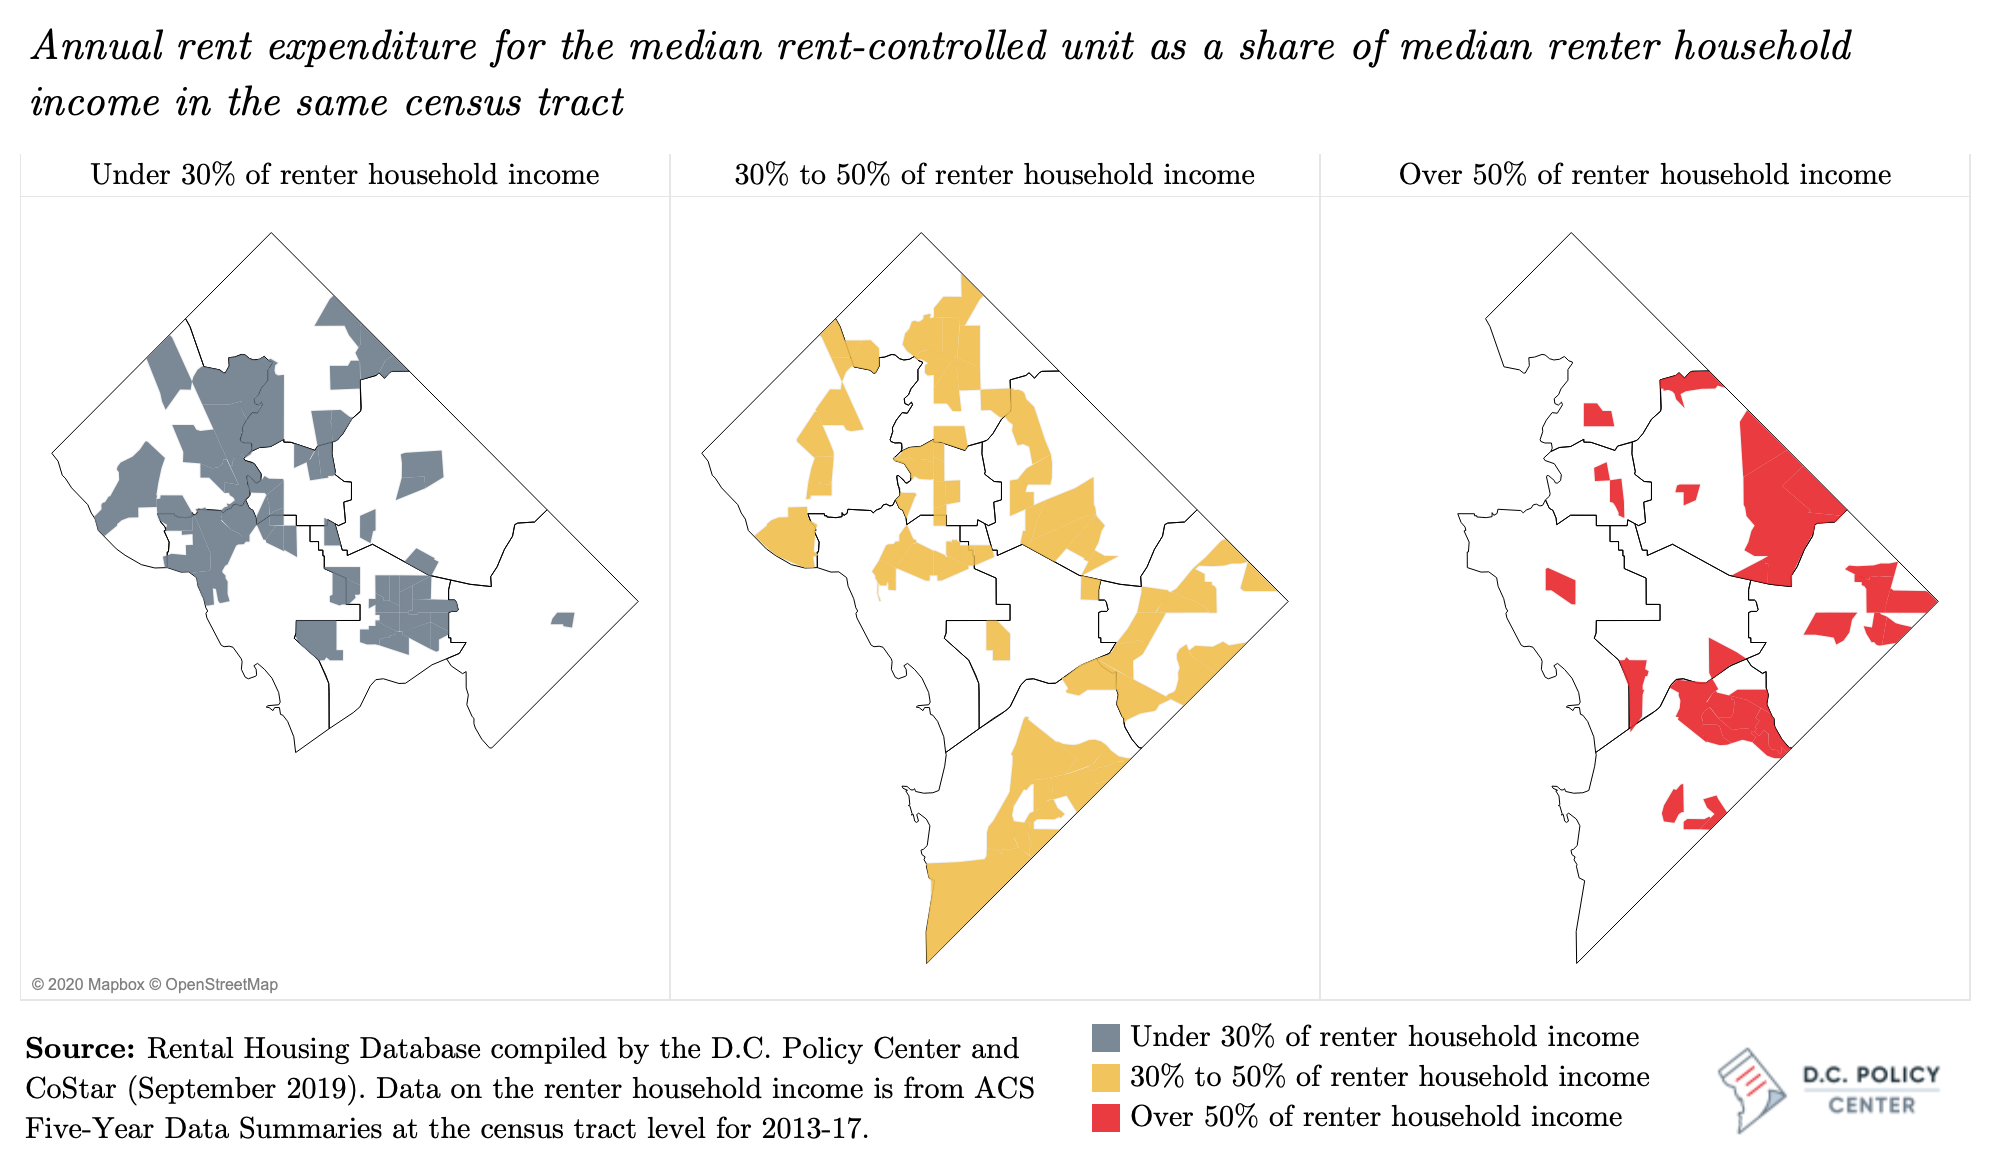
To the extent that renters of disparate income levels are still sorted into disparate neighborhoods, D.C.’s rental housing could be economically segregated. While this report does not have any direct evidence of such economic segregation (this would require household level income data, such as from tax returns, be linked to a D.C. address in a rent-controlled building), it indirectly gauges the existence of economic segregation by estimating rent burdens in high- and low-rent neighborhoods. A comparison of renters’ estimated burdens shows that across the District’s rent-controlled units, renters’ estimated burdens are higher in places where rents are lower, and renters’ estimated burdens are lower where rents are higher. Over one third of the census tracts with rent-controlled housing are in neighborhoods where the median renter income is high enough to keep rent burdens under 30 percent. But not even one of these tracts is in Ward 8, even though the median rent-controlled unit for all sizes in Ward 8 are affordable at under 50 percent of Area Median Income. In Ward 7, there appears to be only one such tract. In Ward 4, where the estimated rents in rent-controlled buildings are only about $200 more expensive, only in one tract estimated rent burdens were severe (exhausting over half of renter income), compared to 16 such tracts east of the Anacostia River.
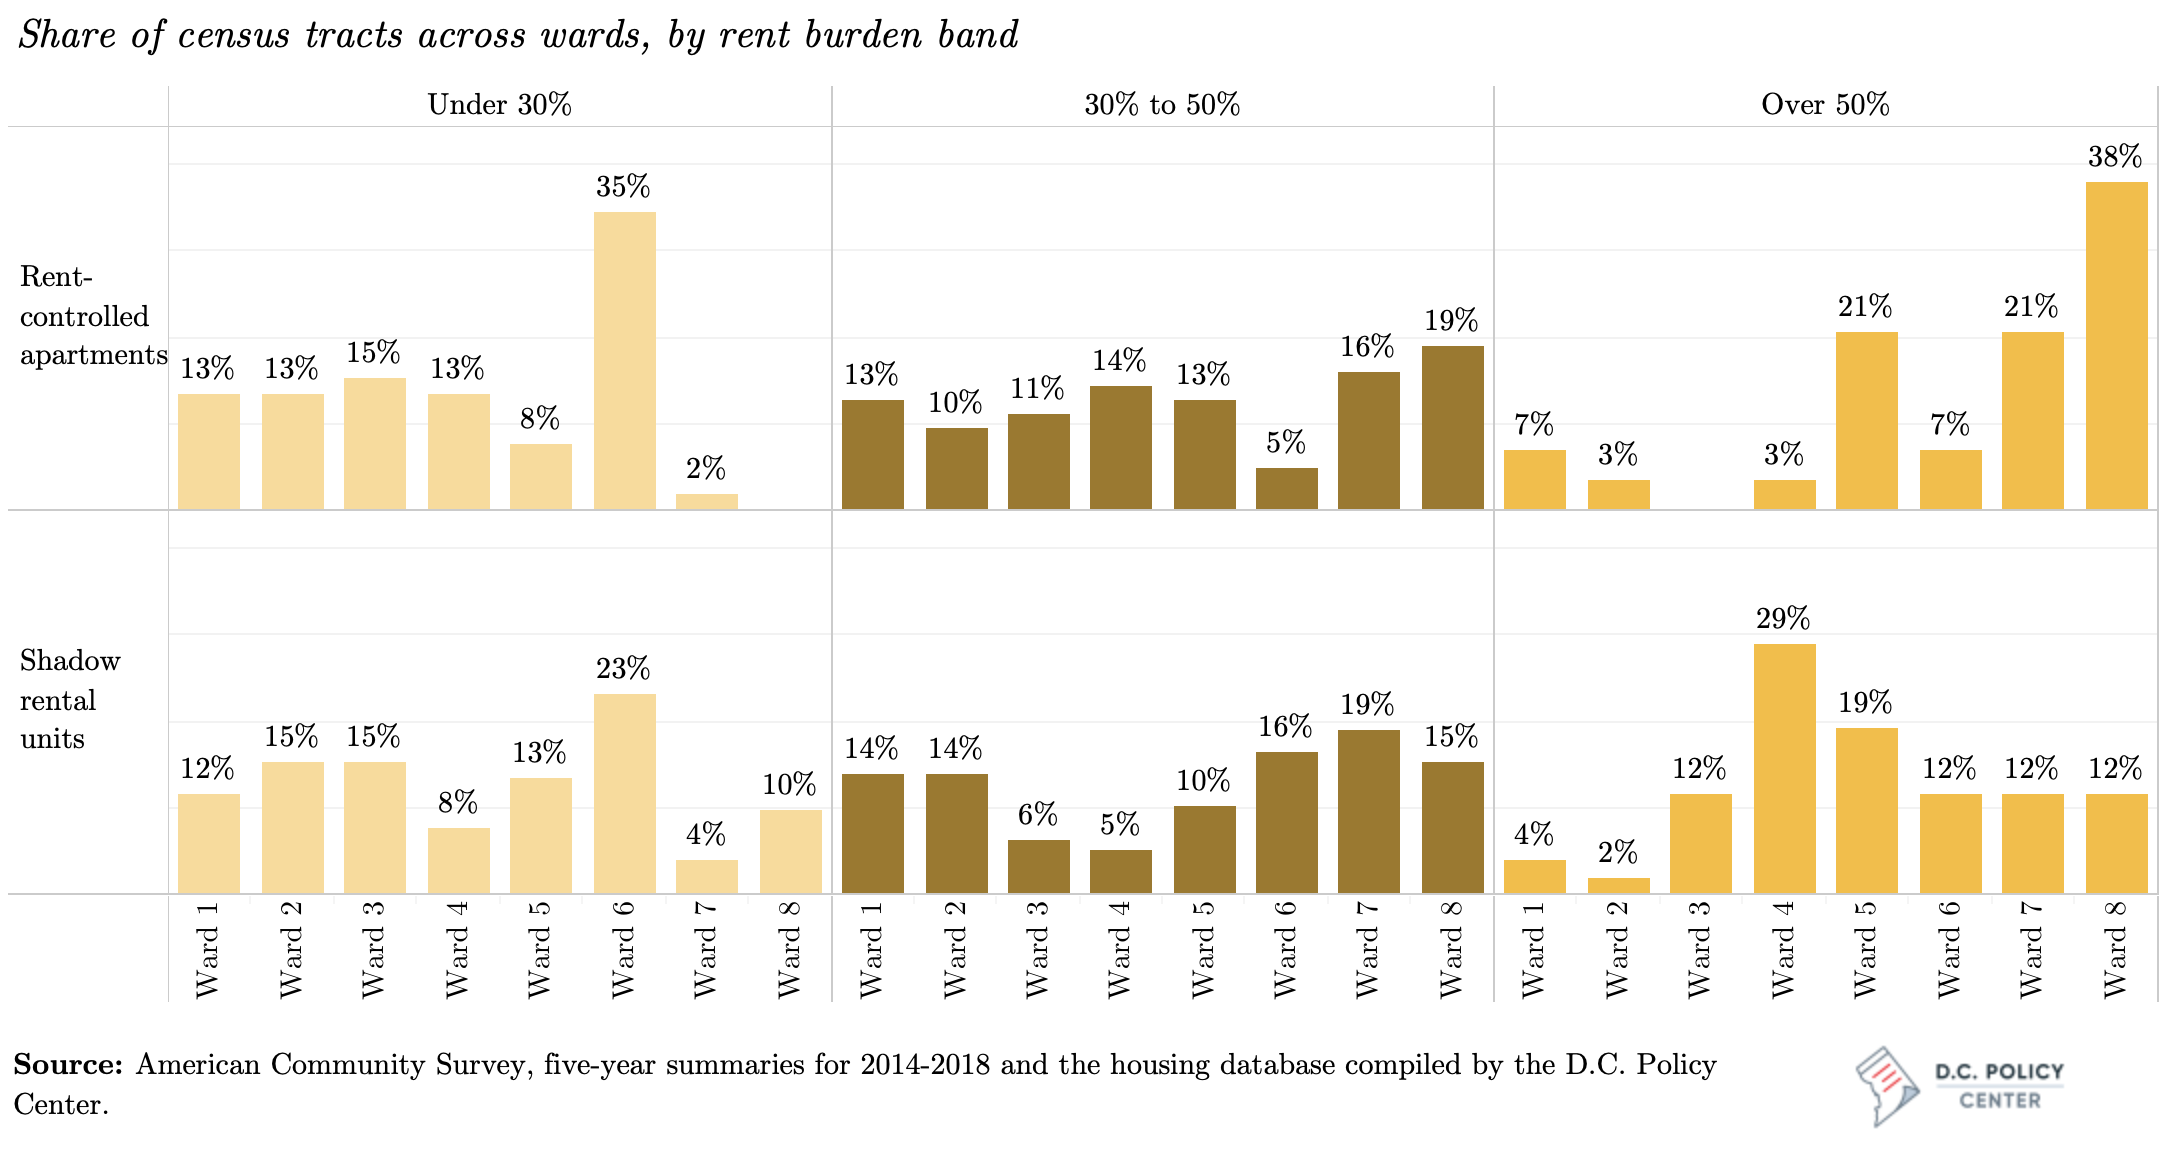
Units in the shadow rental market—though on average more expensive—have kept housing burdens lower in more neighborhoods across the District of Columbia. [4] An estimated 28 percent of tracts across the city have shadow rental units in which renters can live without being burdened, seven of those tracts are east of the Anacostia River (compared to only one for rent-controlled buildings), and five are in Ward 8 (compared to none). In Ward 4, in half the tracts with rent-controlled buildings, rent burdens are under 30 percent; for shadow rental units, this share is one in five.
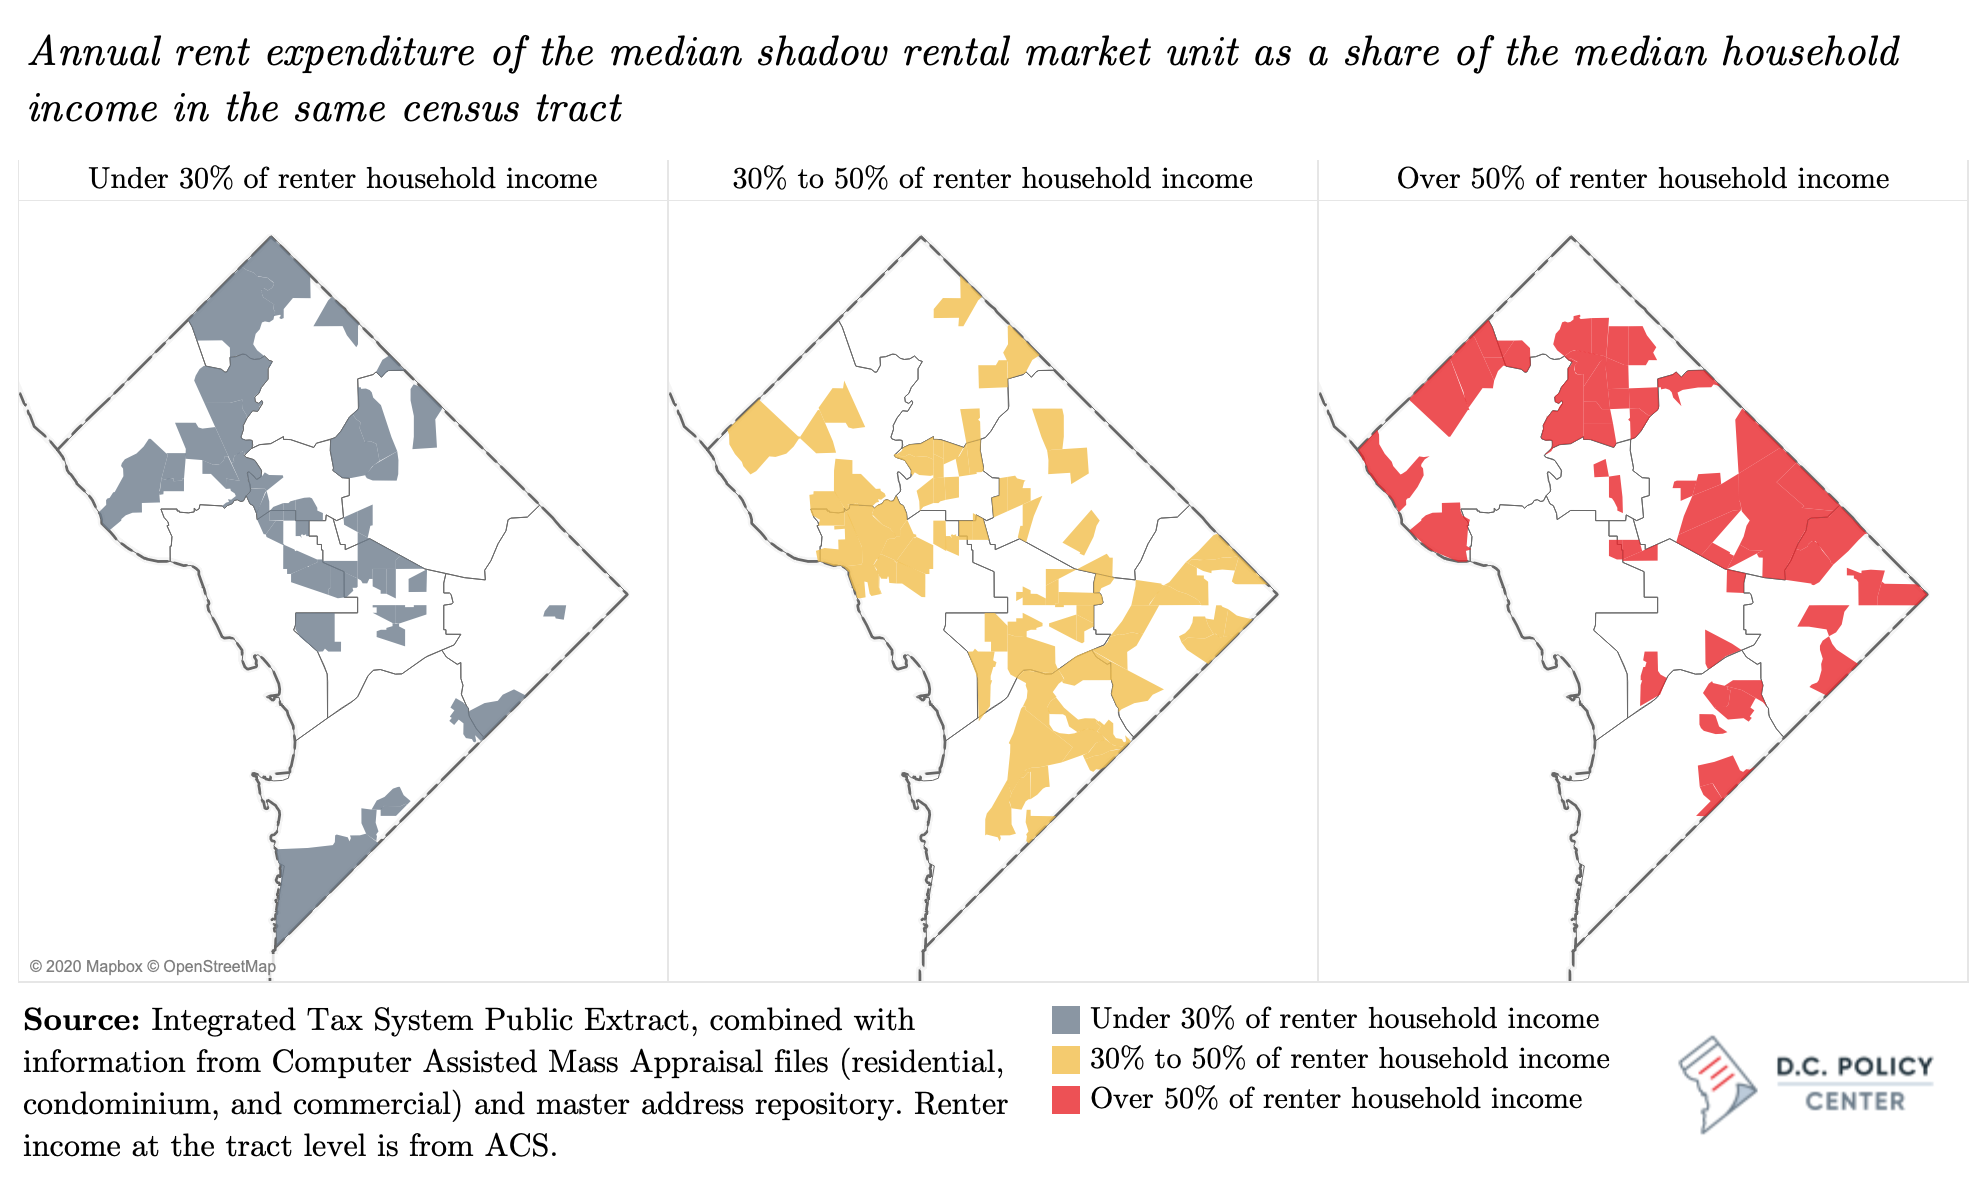
The shadow rental market also distributes estimated housing burdens more evenly across the city compared to the rent-controlled stock. Looking at the distribution of census tracts where median rents in rent controlled buildings would not burden the median renter in the same tract, this analysis finds 35 percent of such tracts are in Ward 6 (due to higher renter incomes and higher rents), while only 2 percent are in Ward 7, and none are in Ward 8 (in both cases, due lower incomes and lower rents). The shadow rental market creates a more even distribution of affordable tracts in the city with 4 percent in Ward 7 and 10 percent in Ward 8. Similarly, census tracts with extremely high estimated rent burdens—defined as those where the median rent is greater than 50 percent of median renter income—are concentrated in Wards 5, 7, and 8 for the rent-controlled stock (with none in Ward 3), and estimated burdens in the shadow rental market are much are more evenly distributed across the eight wards compared to apartments in rent-controlled buildings.
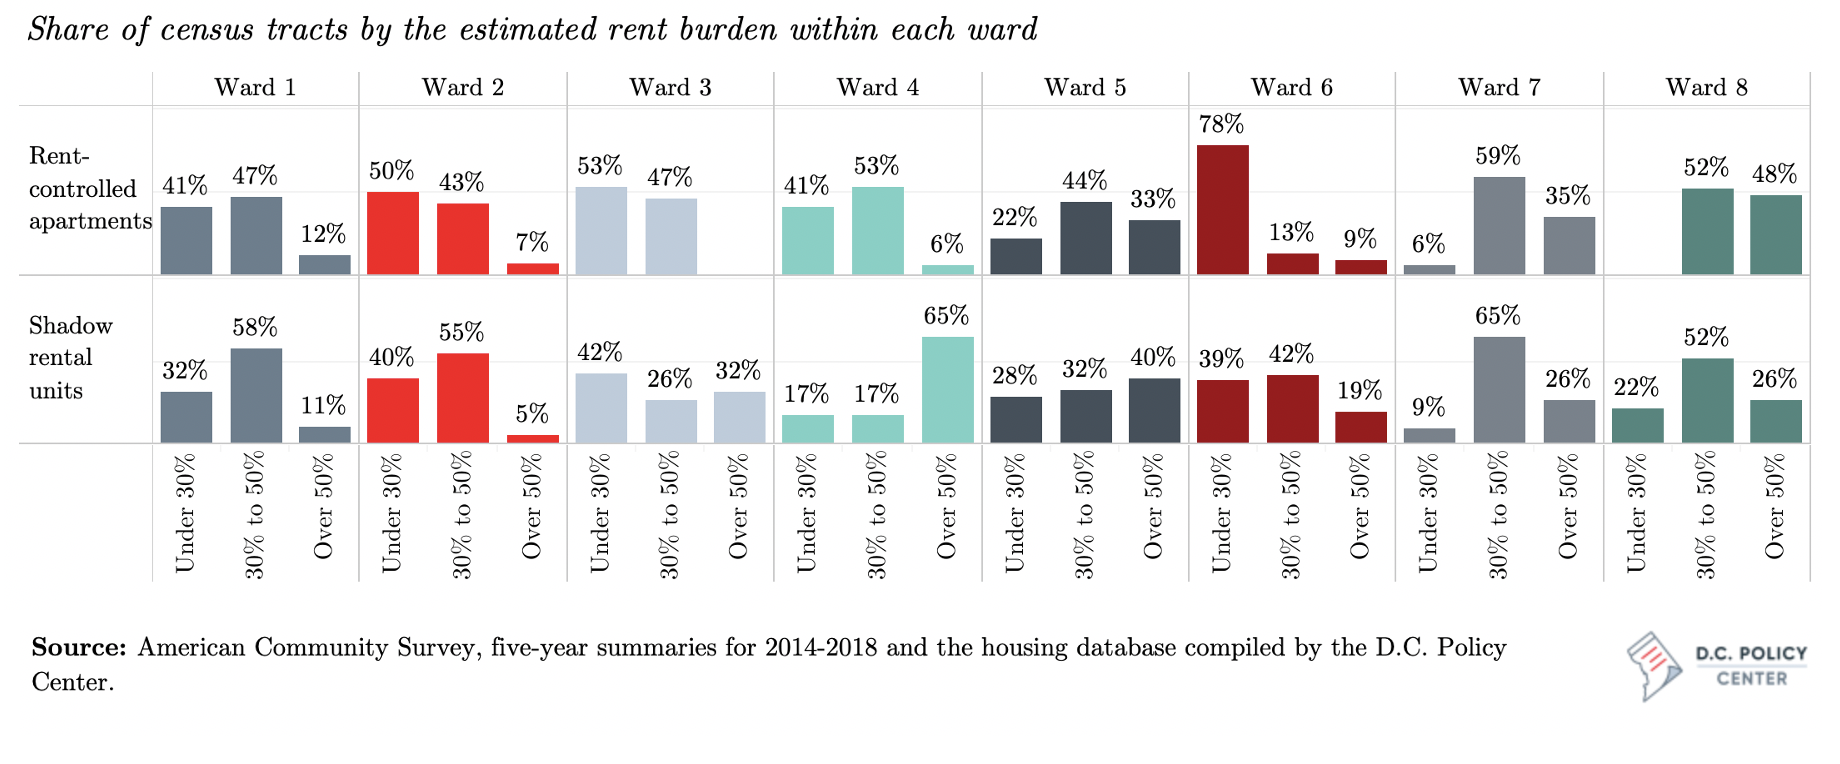
Census tracts are also more evenly distributed across different burden bands within each ward for the shadow rental market. Ward 8’s rent-controlled buildings offer the lowest rents in the city, yet, there does not appear to be any census tracts in this ward where the median renter income is sufficiently high to keep the rents affordable—that is, under 30 percent of household income (Figure27). But when looking at the city’s shadow rental units, 22 percent of the tracts in Ward 8 are affordable for the median renter. In contrast, in Ward 6, where rents in rent-controlled buildings are the highest in the city, the share of census tracts where this rent is affordable (equivalent to 30 percent or less of the median renter households) is 78 percent. The share for the shadow rental market is 39 percent.
Can rent-controlled housing help reduce the risk of displacement?
The concentration of low rents and high rent burdens in the same neighborhoods is a cause for concern, as additional increases in rents for rent-burdened households could result in displacement. One benefit of rent control to renters is that, by keeping rent growth predictable, it can allow renters to stay in the same unit over longer periods of time. This is particularly important in gentrifying neighborhoods with rapidly increasing housing prices.
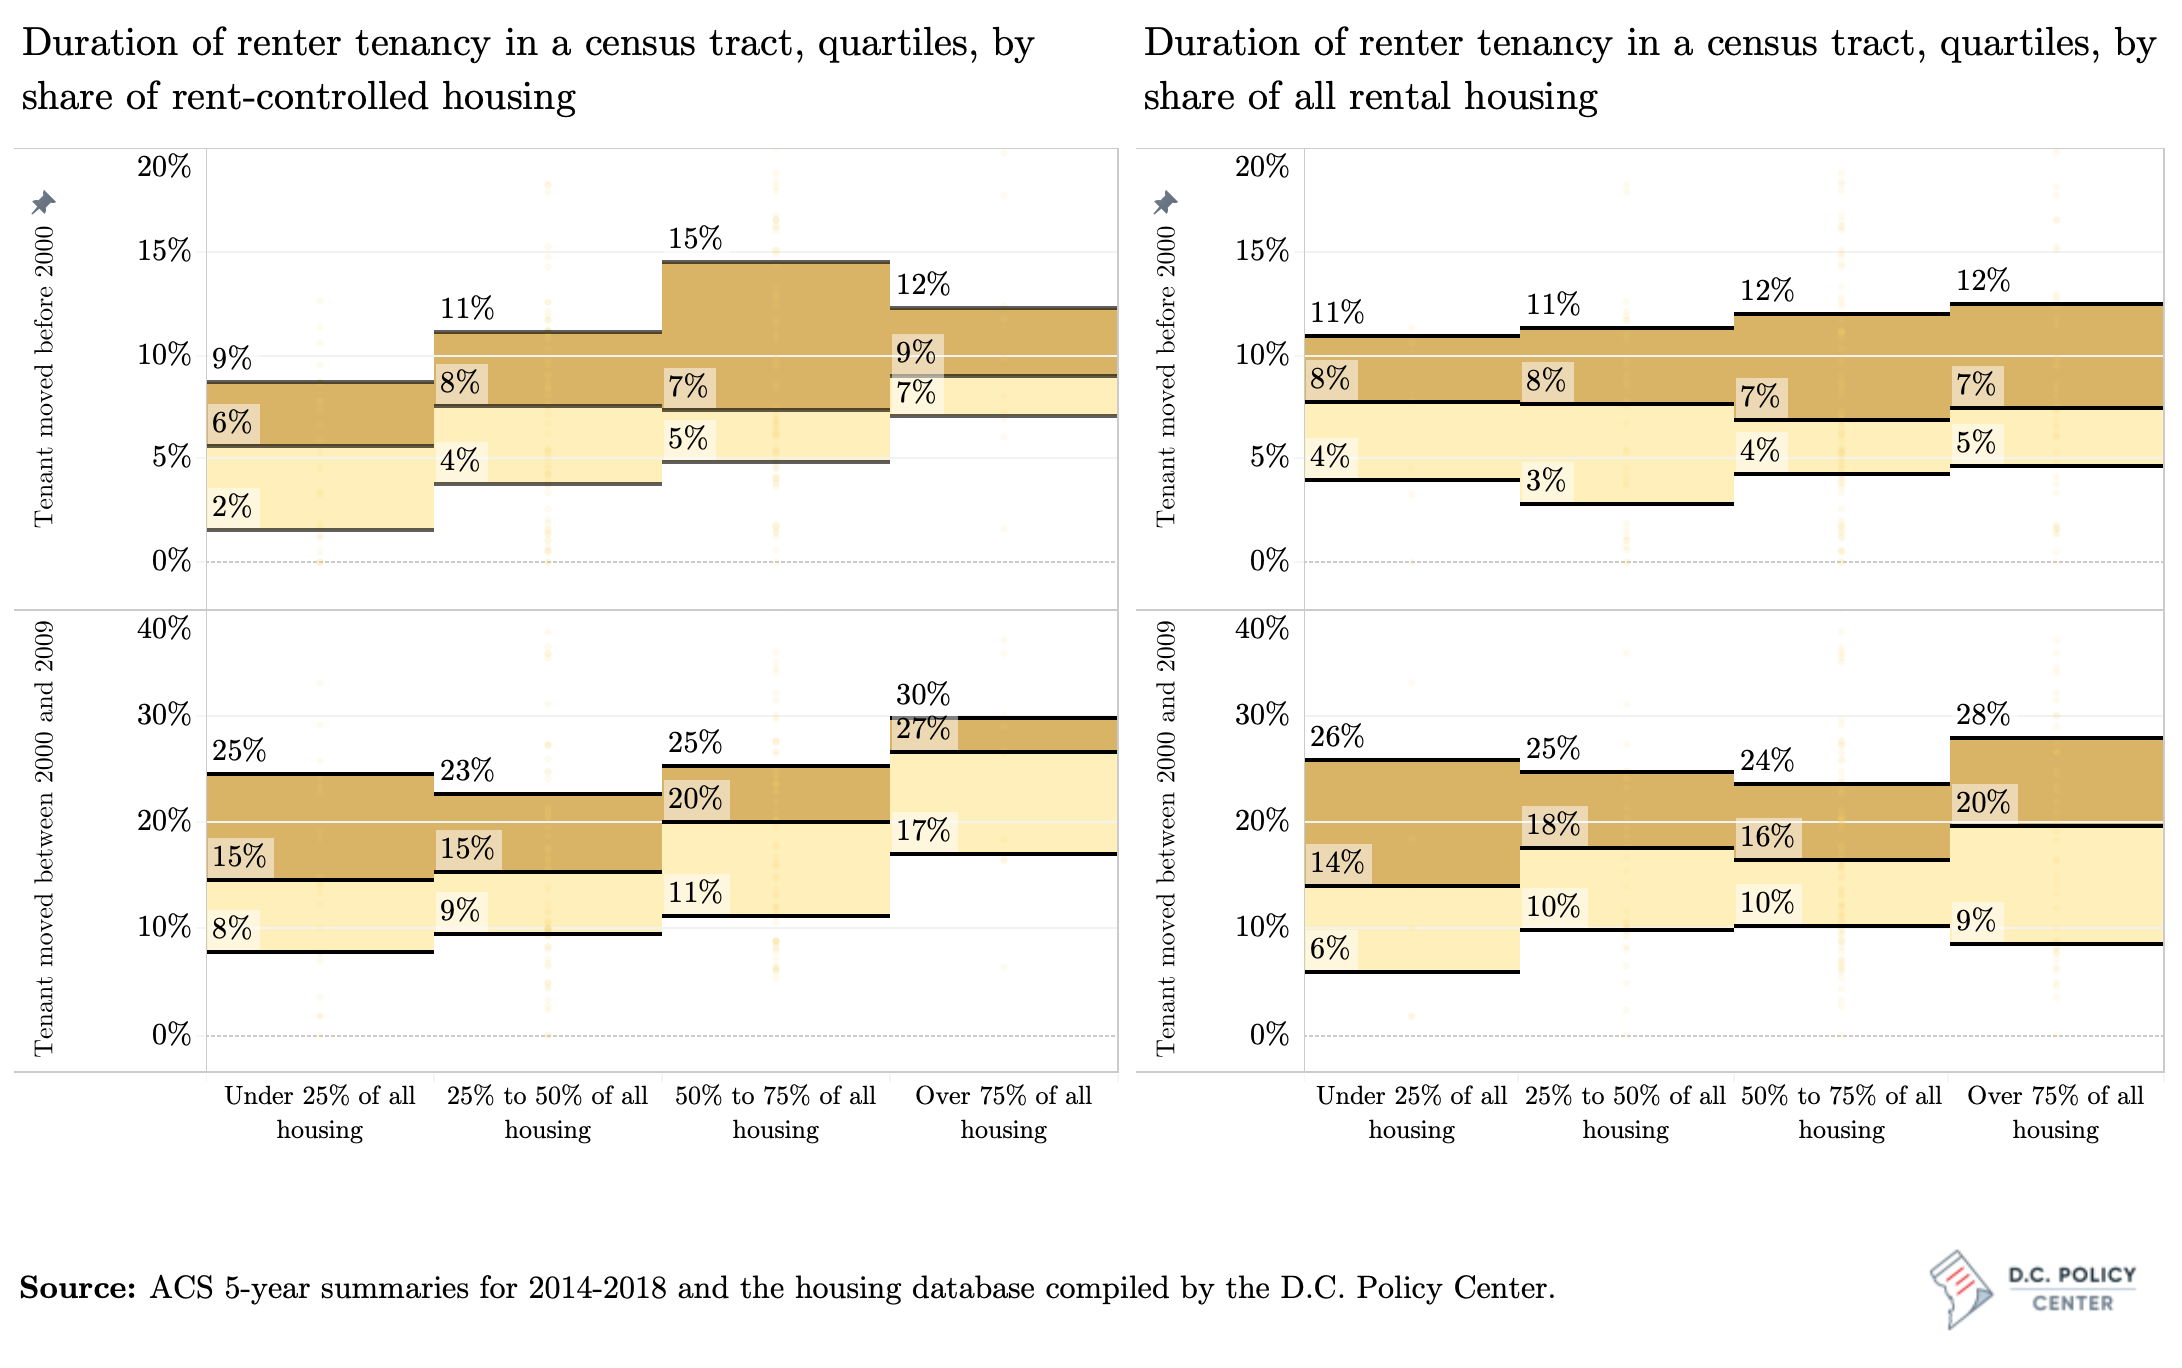
While direct evidence of increased tenure (at the household and unit level) is not available, indirect evidence—which links tenant tenure to the presence of rent-controlled units in the same census tract—suggests that more renters stay in place in census tracts where rent control units are a larger share of housing. Data from the five-year period between 2014 and 2018 suggest that an estimated seven percent of renters across the District reported moving into their current home sometime before 2000, the period before the city’s population boom. Another 20 percent of renters reported that they moved into their current unit sometime between 2000 to 2009, the period during which the District added 30,000 new residents but lost 38,000 Black residents.[5]
Comparing these reported tenancy durations to the share of rent-controlled units in a census tract shows that a strong presence of rent-controlled stock is positively correlated with a longer tenant tenure. Across tracts where rent-controlled units make up over 75 percent of the entire housing stock, nine percent of renters had moved into their unit before 2000. The same share is six percent for tracts where rent-controlled units make up less than one quarter of the housing stock.[6] For renters who moved in between 2000 and 2009, the probability of staying through 2018 is 12 percentage points higher in neighborhoods were the rent-controlled stock is at least three quarters of all housing stock, compared to census tracts where rent-controlled housing constituted less than one quarter of all housing.[7] This relationship does not extend to the entire rental stock. There does not seem to be any statistically significant relationship between tenancy duration and prevalence of all rental units (including non-controlled apartments and shadow rental market units). The variations of the concentration of all rental housing cannot at all explain the variations in tenant tenure. [8]
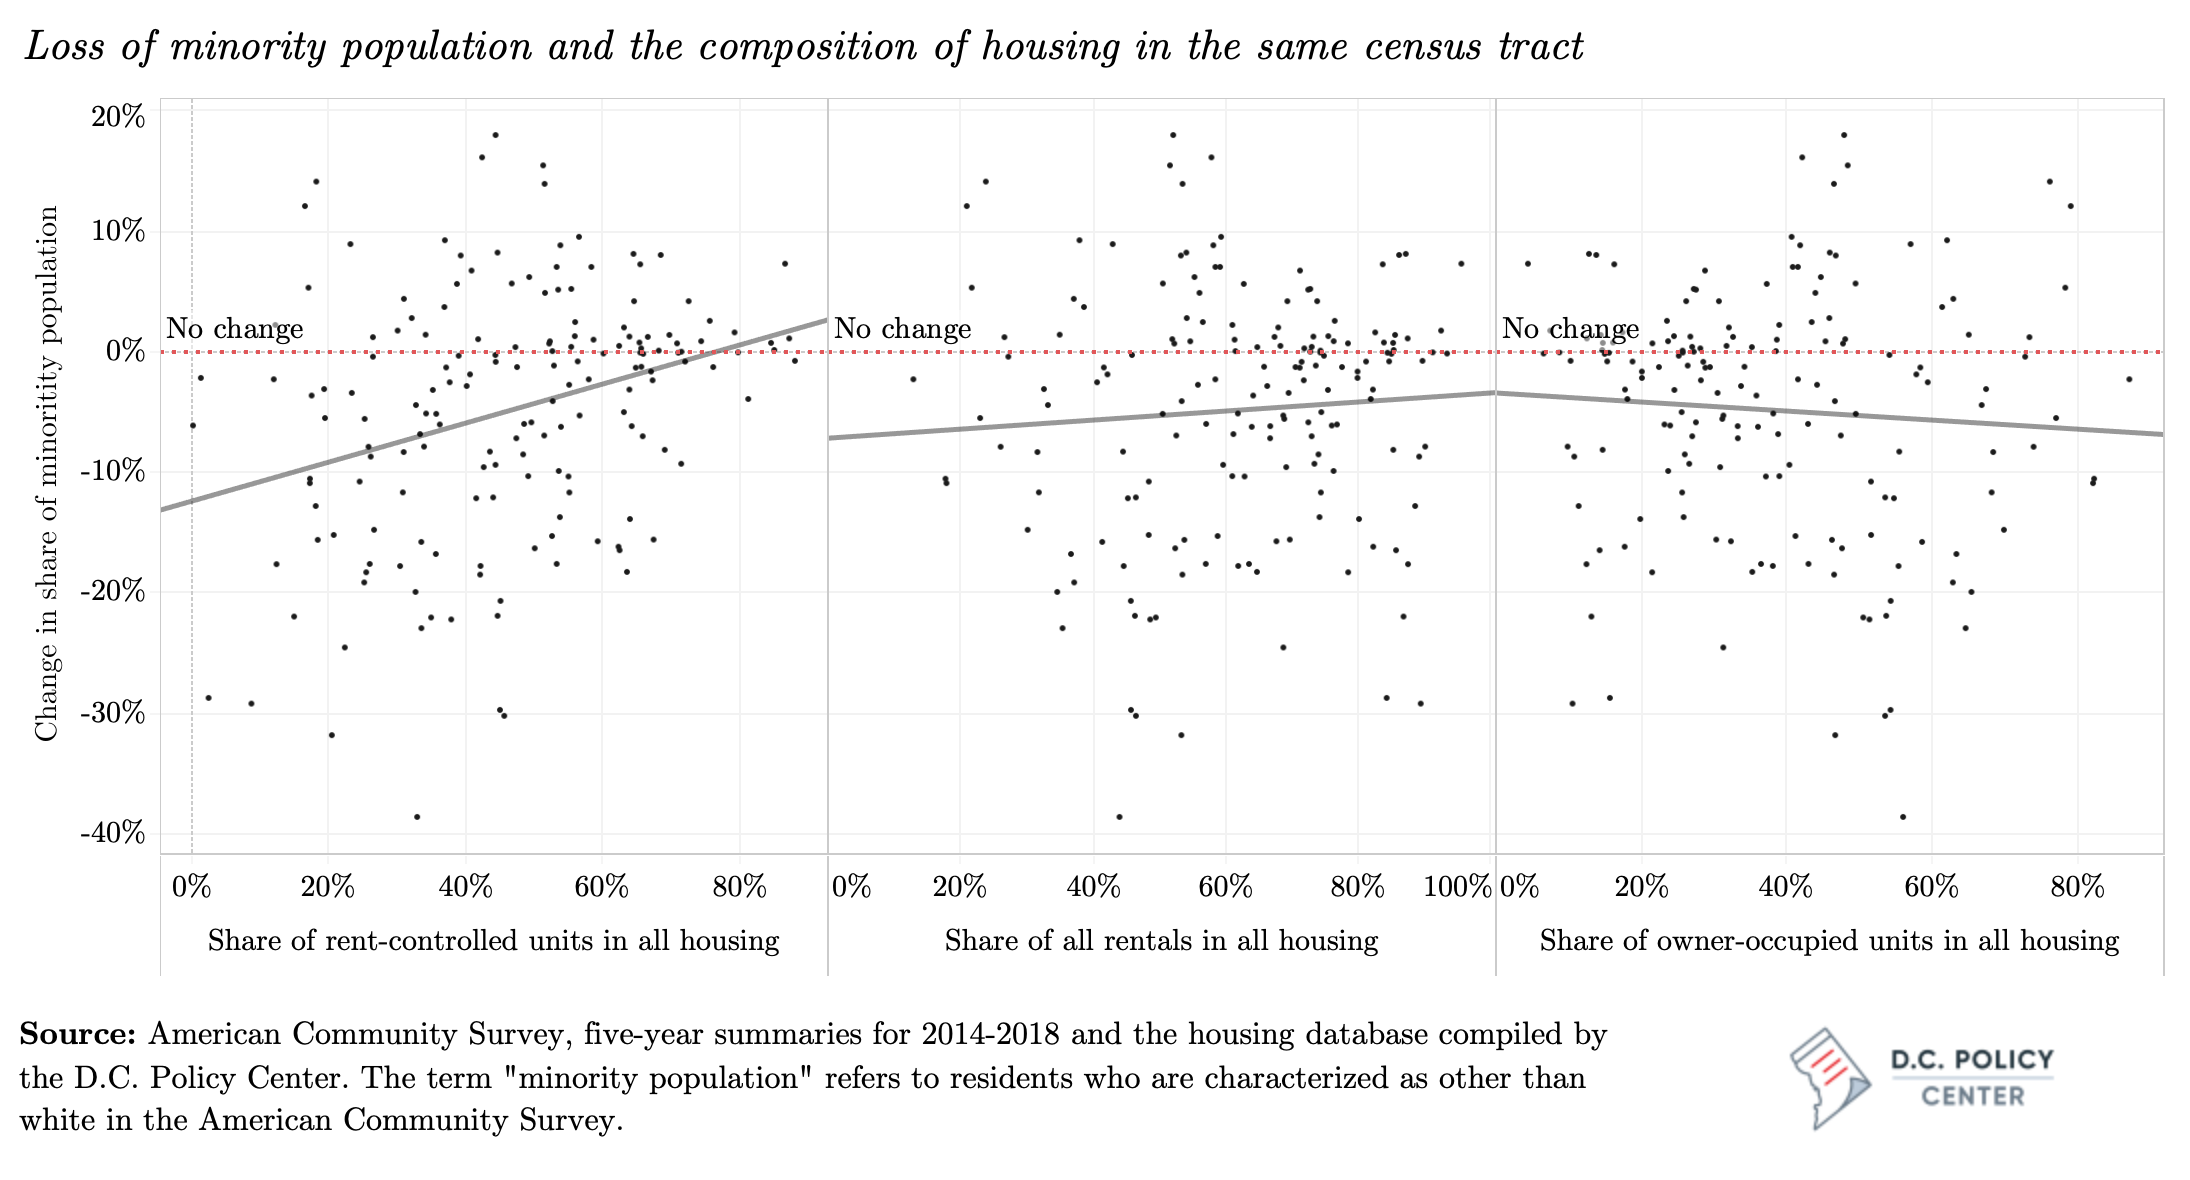
 A strong presence of rent-controlled units also is positively correlated with a smaller loss (and in a handful of tracts, a modest gain) of minority population in the same census tract. Between 2010 and 2018, the District’s minority population[9] increased by approximately 50,000 new residents (and its Black population increased by nearly 10,000),[10] but this overall growth does not mean that displacement of people of color has stopped. During this period, the share of people of color in the entire population increased only in 63 of 179 census tracts; in 113 tracts where population increased, the share of people of color declined. The median decline in these tracts was eight percentage points and the median change in the share of minority residents across all census tracts was negative two percentage points. The losses were less severe across neighborhoods with a larger presence of rent-controlled units. The model suggests that a 10-percentage point increase in the share of rent-controlled units in a neighborhood is associated with a 1.6 percent increase in the share of minority population.[11] This relationship is even stronger if the analysis excludes census tracts that have lost population.[12] The same model has no explanatory power when applied to the share of all rental housing and the share of owner-occupied housing (Figure 29, middle and left panels).[13]
As we have shown before, rent-controlled housing is everywhere, and it is much lower than other types of rentals or owner-occupied housing. Yet in its current form, rent-controlled buildings are not creating affordable rents in parts of the city where affordability is most needed for low-income residents. And even though presence of rent-controlled housing is positively correlated with staying in place, and less displacement for communities of color, rent-controlled housing is not an effective source of economic inclusion. This is a missed opportunity for the city.
In the next chapter, the report turns to an evaluation of a potential policy tool that can take advantage of the diversity in rent-controlled units to create affordable housing units, especially in parts of the city where it has been extremely difficult to produce publicly subsidized housing.
You’ve reached the end of Chapter 4.
<< Back: Chapter 3 | Next: Chapter 5 >>
Or return to the main publication page.
Notes
[1] Sayin Taylor, “Taking Stock of the District’s Housing Stock.”
[2] Information on the incomes of renters in each apartment building is not available. For this exercise, researchers instead used the renter income that prevailed in the same census tract as each apartment building.
[3] In this exercise, researchers correlate renter incomes in each census tract to the median rents that prevailed across all rental apartments in that census tract.
[4] This is partly because the shadow rental market has a larger footprint than rent-controlled units: We could find shadow rental market units in 170 of the 177 census tracts in the District, but only 143 tracts have rental apartments under rent-control. There is also more variety in quality, allowing a greater rent variation.
[5] Yesim Sayin Taylor, “Tax Practices That Amplify Racial Inequities: Property Tax Treatment of Owner-Occupied Housing,” (D.C. Policy Center, 2018).”
[6] Using a Wilcoxon-Mann-Whitney test, we find that this difference in median tenancy between tracts with under 25 percent and over 75 percent of their housing comprised of rent-controlled units, is statistically significant at the 5-percent level, but not at the 1-percent level.
[7] Similarly, this difference is statistically significant at the 5 percent level, but not at the 1 percent level.
[8] While Figure 25 shows that renters who moved into their unit between 2000 and 2009 are 6 percentage points more likely to still be in the same unit if their neighborhood is mostly made up of rentals, this difference is not statistically significant.
[9] To clarify, the term here refers to nonwhite population following how the U.S. Census Bureau uses the term. In the District, there is no majority population by race or ethnicity.
[10] This is a comparison of the single-year population estimate from ACS in 2010 (309,221 +/-0.4%) to the single-year population estimate for 2018 (319,777+/-0.6)
[11] This estimate is statistically significant at 0.1 percent. The model suggests that the variation in the share of rent-controlled units can explain about 10 percent of the variation in the change in the share of minorities.
[12] It should be noted that rent-controlled units are prominent in some neighborhoods where the share of monitories has been historically low. The model presented here is giving greater weight to these neighborhoods.
[13] The relationship between the share of all rentals in the entire housing stock and the change in the share of minorities is still positive, but not statistically significant; the sign switches for owner-occupied housing, but the model, similarly, lacks explanatory power.