
In the fall of 2022, public charter schools in D.C. will be able to opt into an at-risk priority in the common lottery, where students who are eligible for public benefits, are experiencing homelessness, are involved in the foster care system, or are overage in high school would have a higher chance of matching at a particular school. A July 2020 D.C. Policy Center report, At-risk priority in D.C.’s common lottery: Implications for access and diversity, found that this priority has the potential to increase match rates for at-risk applicants and improve diversity at a subset of public charter schools. This follow-up “At-risk application patterns in D.C.’s common lottery” report on application patterns for at-risk and not at-risk applicants informs how schools could implement an at-risk priority.
Below is the full report – you can also read the summary, download the PDF, or watch a recording of the release event and panel discussion.
The D.C. Council has passed legislation to allow (but not mandate) public charter schools to prioritize at-risk applicants in the common lottery. Charters could do so either by prioritizing an at-risk applicant pool over other student groups in the common lottery, or by reserving a certain share of their seats for at-risk applicants for a period of time. District of Columbia Public Schools (DCPS) has piloted an at-risk priority at one school already, as DCPS is able to implement the preference at this time without the need for additional legislation.
An at-risk priority could make a meaningful difference in access to seats for at-risk students and socioeconomic diversity, especially at public charter schools where waitlists are long, and the share of at-risk students is low. Under an at-risk priority, pre-kindergarten match rates for at-risk students are estimated to increase from four percent to as high as 42 percent for public charter schools with a low percentage of at-risk students and high waitlists. Consequently, the share of at-risk students for the incoming pre-kindergarten class at these public charter schools is estimated to increase from 11 percent to as much as 61 percent.[1] In short, at-risk applicants who rank these schools in the common lottery would have a better chance at a match. Giving more weight to at-risk applicants could also make schools implementing the at-risk priority more socioeconomically integrated by increasing their share of at-risk students and reducing their share of not at-risk students.
However, an at-risk priority policy, on its own, cannot achieve these results if at-risk students are not applying to these schools, or not applying in time to receive a match.
To get a better idea of what schools should consider, and how much this priority could change demographics of the students they serve, the D.C. Policy Center analyzed application data from three years of D.C.’s common lottery for at-risk and not at-risk applicants.
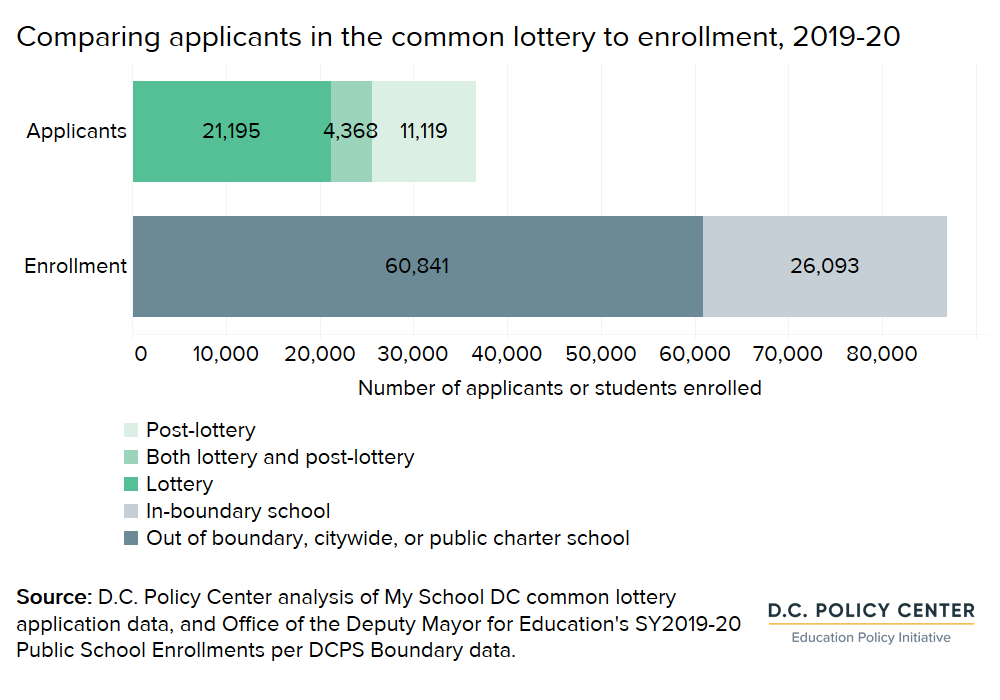
Many applicants participate in the common lottery: In school year 2019-20, there were 25,563 applicants during the lottery period[2] compared to the 86,934 students who were enrolled by October of the 2019-20 school year. Schools with high waitlists match all of their seats during the lottery period. This means that the 15,487 applicants who enroll during the post-lottery period[3] have a limited chance of obtaining seats at these sought-after schools – especially if they don’t have a preference such as a sibling attending the school to augment their chances.[4]
Our analysis finds three key patterns in lottery and school application data that help explain why most public charter schools with high waitlists also have low percentages of students who are at-risk. Schools considering implementing an at-risk priority should be aware of how these patterns may influence the effectiveness of an at-risk priority, especially effectiveness in increasing a school’s socioeconomic diversity. These patterns also show the reasons why the number of at-risk students who would receive a match in the common lottery due to an at-risk priority may be low.
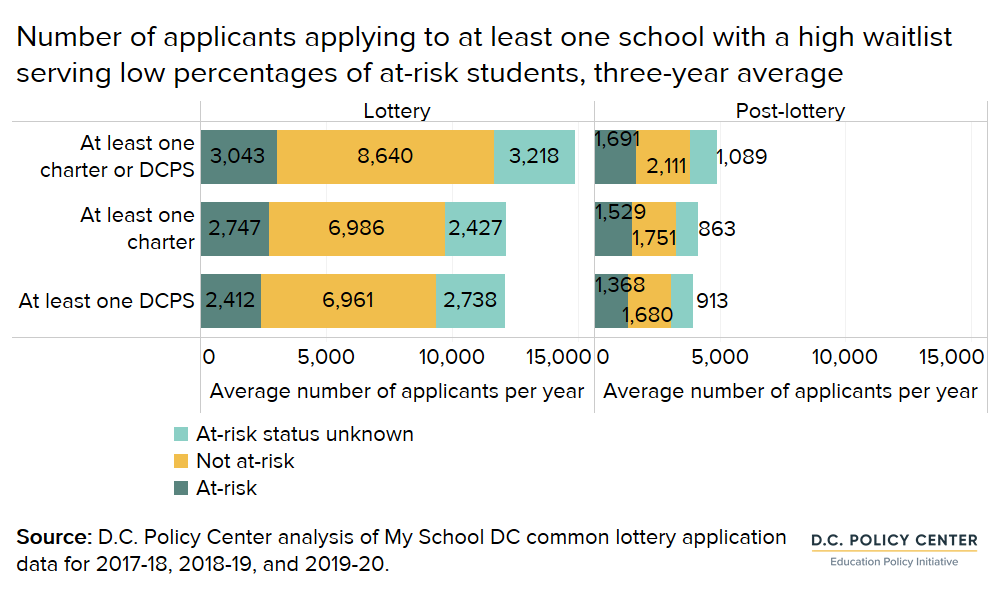
- At-risk students are less likely than their peers who are not at-risk to apply in the common lottery. They are especially less likely than their peers to apply during the lottery period – the time when most seats are matched at high-waitlist schools. Not at-risk applicants are the largest group of applicants during the lottery period: On average over the last three years, there were 24,192 applicants during the lottery period, and 11,807 were not at-risk compared to 7,978 who were at-risk.[5] In contrast, the share of at-risk students participating in the lottery is much lower than the share of at-risk students enrolled in public schools: over the same three years, the total public school enrollment consisted of 48 percent of students who were at-risk and 52 who were not at-risk (an almost even split). But in the lottery period, the number of not at-risk applicants on average in this three year period (11,807) significantly surpassed the number of at risk applicants (7,978). Because fewer at-risk students apply during the lottery period, they are less likely to match at schools with high waitlists that fill all their seats at this time. In contrast, at-risk students represent the largest group of applicants during the post-lottery period – a time when they are less likely to receive matches at high-waitlist schools. Out of 15,014 applicants during the post-lottery period, only 5,033 were not at-risk, while 7,358 were at-risk.[6] Fewer at-risk applicants submit applications to the common lottery overall, and when they do, just as many apply during the lottery period as during the post-lottery period, when it is too late to immediately gain access to any school with a significant waitlist (patterns in applications don’t suggest the reasons why at-risk applicants are more likely to apply after the deadline).
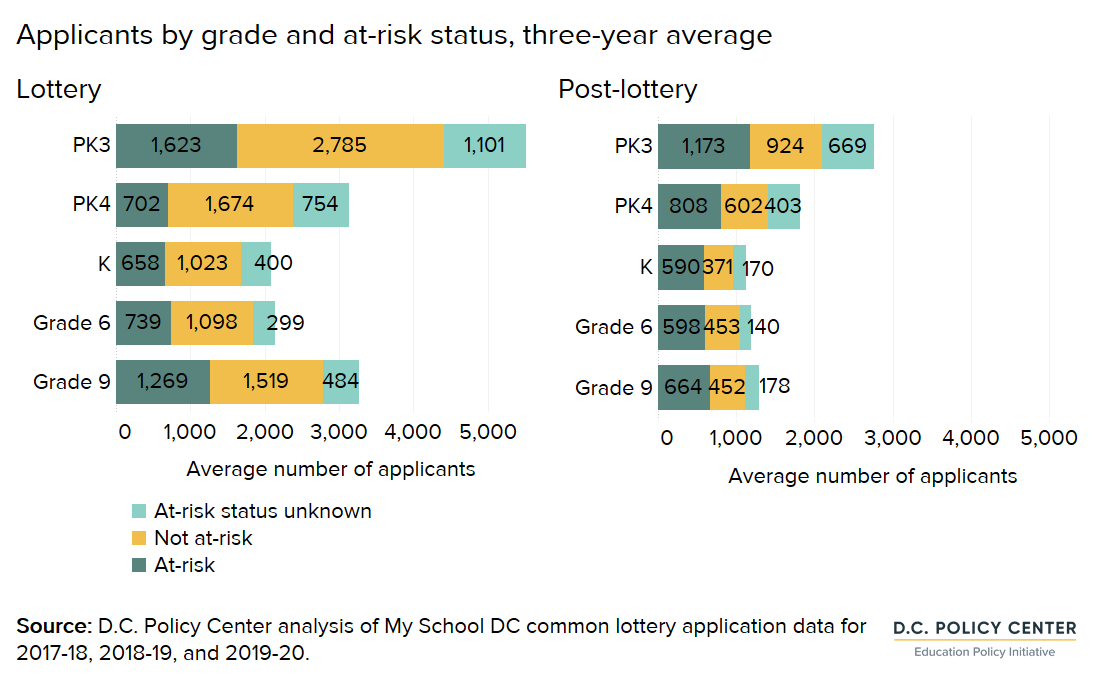
- Fewer at-risk students apply to the lottery than their not at-risk peers in the early grades, which can determine enrollment options for all eight years of elementary school, or in some cases, a middle and high school trajectory. During the lottery period – when most students match at schools with high waitlists — there are fewer at-risk applicants in PK3. Out of 5,509 PK3 applicants (on average over the last three years), 1,623 applicants were at-risk compared to 2,785 who were not at-risk.[7] By comparison, 47 percent of enrolled PK3 students were at-risk during the school year. Having more not at-risk applicants than at-risk applicants to the lottery period in PK3 means that students who are not at-risk are more likely to gain access in this early grade that determines future enrollment trajectories. By high school, the distribution of students applying during the lottery period has shifted to be more even: By grade 9, where waitlists are lower than PK3, there are almost equal numbers of at-risk applicants, with 1,269 on average compared to 1,519 not at-risk applicants out of a total of 3,272 applicants (on average over the last three years). However, at-risk students are still underrepresented in lottery applications compared to enrollment: In grade 9, at-risk students represent 64 percent of all students enrolled over the last three school years.
- Fewer at-risk applicants apply to schools that have high waitlists and serve low percentages of at-risk students. This analysis identifies schools that have high waitlists and serve low percentages of at-risk students if they are above the 75th percentile of waitlists[8] and below the 25th percentile of at-risk for all grades.[9] This list includes 45 schools (26 DCPS and 19 public charter schools) in 2019-20, for example. On average, 14,901 applicants out of 24,192 total applicants applied to at least one of these schools over the past three years during the lottery period. During the lottery period, not at-risk applicants to these schools outnumber at-risk applicants by almost three to one, and there are 2,747 at-risk applicants to at least one of these schools. This would be enough at-risk applicants to mean that a school implementing an at-risk priority could see a difference in socioeconomic diversity.
This analysis looks in more detail at both individual applicants and the applications they submit to D.C.’s common lottery, showing patterns in who participates in the common lottery by at-risk status, lottery deadline, applicant ward, and grade of application, as well as the extent to which they apply to schools with high waitlists serving low percentages of at-risk students.
Background
In D.C., 45 percent of public school students are currently considered to be “at-risk of academic failure,” defined as qualifying for public benefits (Temporary Assistance to Needy Families, TANF, or Supplemental Nutritional Assistance Program, SNAP), experiencing homelessness, being involved in the foster care system, or over-age in high school (older than the expected age for their grade). Schools receive additional funding for each at-risk student, in part to help close achievement gaps between at-risk students and other students. During the 2018-19 school year, half of not at-risk students met or exceeded expectations on the state assessment compared to one in five at-risk students.[10]
D.C. has a common lottery to match students to a school they rank, including their in-boundary District of Columbia Public Schools (DCPS) option if they are seeking pre-kindergarten seats. An estimated 30 percent of PK3 to grade 12 students attend their in-boundary DCPS school,[11] where they have a guaranteed seat beginning in kindergarten. The remaining 70 percent of students have used the common lottery at some point to enroll at a DCPS school as an out of boundary student, at a citywide DCPS school without boundaries, or at a public charter school (45 percent of all PK3 to grade 12 students are enrolled at public charter schools).
This study finds that at-risk applicants are less likely to use the common lottery than other applicants, and that they are likewise less likely to apply to schools that have high waitlists and serve low percentages of at-risk students. And compared to their peers who are not at-risk, at-risk applicants have lower match rates to the schools they rank in the common lottery (aside from their in-boundary DCPS option) if these schools serve a low percentage of at-risk students and have high waitlists. Sibling preference at many schools in the common lottery means that schools are likely to maintain existing demographics even if an at-risk preference is added, given that schools with a low percentage of at-risk students tend to enroll siblings who also are likely not to be at-risk. For example, a D.C. Policy Center analysis of lottery data from a subset of public charter schools with high waitlists found that siblings were matched to about a third of open seats in the entry grade of pre-kindergarten.[12] These patterns mean both that there are fewer at-risk applicants to these schools than not at-risk applicants, and that at-risk applicants have lower match rates at these schools, maintaining existing demographics and not increasing socioeconomic diversity.
New at-risk priority policy
To mitigate these outcomes, the D.C. Council has passed an optional priority for at-risk applicants to apply to public charters in the common lottery, by adding a preference that would rank at-risk applicants ahead of other applicants, or by reserving a certain share of seats for at-risk applicants. A lottery preference for at-risk students would give at-risk applicants a better chance at a match in the common lottery by placing them at or near the top of the match list, similar to the existing option for sibling preference that most schools offer. Such an at-risk preference would mean that, after accepting all applicants with any higher-priority groupings, the school would fill all remaining seats with at-risk students if the number of at-risk applicants exceeds the number of remaining seats. Reserving seats for at-risk students would mean that schools (particularly those with a low percentage of at-risk students) could keep a portion of their seats specifically for at-risk students until a certain date, such as the beginning of the school year. The share of seats ultimately allocated to at-risk students under each policy option depends on the ratio of applicants with other preferences (primarily siblings) to the number of open seats – for example, in an extreme situation where the number of siblings and seats are equal, reserving seats for at-risk students will have a bigger impact for at-risk applicants.
An at-risk priority in the common lottery has the potential to improve access to schools that are top choices for at-risk students and increase school-wide socioeconomic diversity.[13] A recent My School DC (MSDC) study, Giving At-Risk Students Preference in a Unified Lottery for Public Schools, found that even the strongest version of this policy (placing at-risk students above siblings) would only change results for eight percent of at-risk applicants.[14] A D.C. Policy Center report, At-risk priority in D.C.’s common lottery: Potential implications for access and diversity, followed up on this study and found that at-risk applicants who would benefit from the priority are likely to be concentrated at a subset of public charter schools that currently serve low percentages of students who are at-risk. The analysis showed that the at-risk preference would make a meaningful difference in access and socioeconomic diversity at a subset of public charter schools with high waitlists serving low percentages of at-risk students (not across all schools), even if it were placed below the sibling preference.[15] That is, at-risk students who apply to these schools would have a better chance at a match, and these schools could become more socioeconomically integrated by increasing the percentage of at-risk students and reducing the percentage of not at-risk students.
Approach
As this study will show, how at-risk applicants currently apply to schools through the common lottery has implications for how much diversity and match rates would improve under an at-risk priority. The report will look at the extent to which patterns in common lottery applications from at-risk and not at-risk applicants reinforce existing demographics at schools with high waitlists that serve low percentages of at-risk students, and how these patterns might influence the implementation of an at-risk priority.
Identifying differences in applicant patterns for at-risk students has the potential to inform public charter schools who opt into any at-risk priority in D.C., and to provide additional understanding of why socioeconomic diversity hasn’t increased at some schools. This analysis examines how participation varies across applicants by at-risk status, lottery or post-lottery period, home ward, and grade of application as well as where they submit applications.
Data and methodology
In addition to publicly-available data on enrollment, program offerings, school ward, and waitlists, this study uses de-identified applicant-level data shared by MSDC and enrollment of at-risk students by grade and ward shared by the Office of the State Superintendent for Education (OSSE). Under a data sharing agreement with the D.C. Policy Center, MSDC provided applicant-level data for three years of the common lottery (2017-18, 2018-19, and 2019-20) that included school rankings, student grade, student ward, date of application as before or after lottery deadline, and students’ at-risk status for those who enrolled in D.C.’s public schools.
The analysis presented in this report uses MSDC common lottery data, which provide detailed application-level information by school, lottery or post-lottery time of application, grade, ward of student, and at-risk status. Each application identifier corresponds to a student. In order to calculate the number of applicants we aggregated the data by the unique application ID, while each separate entry was included to calculate the number of applications. Program offering information from EdScape and school ward information from the Office of the State Superintendent of Education (OSSE) school report card data were matched to the main MSDC dataset using OSSE school codes.
The analysis focuses on a subset of schools with high waitlists – those with waitlists in the 75th percentile or higher – serving low percentages of at-risk students – those with a percentage of at-risk students served in the 25th percentile or lower. The numbers of applicants who are at-risk and not at-risk are compared to enrollment in these categories using data requested from OSSE on enrollment by at-risk status, ward, and grade over the three school years of the common lottery data. In almost all calculations, three years are averaged.
This analysis answers the following questions:
- Who participates in the common lottery, by at-risk status, lottery deadline, applicant ward, and grade of application? How does participation compare to enrolled students by at-risk status?
- How many applicants apply to schools with high waitlists serving low percentages of at-risk students, by at-risk status?
Limitations
There are some limitations to this study. First, it is limited to preferences indicated by common lottery applicants, not all enrolled students, and does not examine post-enrollment decisions like midyear withdrawal or entry. Applicants include all pre-kindergarten students entering D.C.’s schools for the first time, as well as applicants to a public charter school, a citywide DCPS school, or a DCPS in-boundary school as an out-of-boundary student.
Many students participate in the common lottery each year. In school year 2019-20, there were 36,682 applicants to the common lottery (most during the lottery period) compared to the 86,934 students who were enrolled by October of the 2019-20 school year. However, the majority of students have used the common lottery at some point – in addition to any student who has enrolled in pre-kindergarten since the common lottery began, 70 percent of students attend a DCPS school as an out of boundary student, a citywide DCPS school without boundaries, or a public charter school.[16] This means that it is important to understand the common lottery as it determines school enrollment at some point for the majority of public school students in D.C.
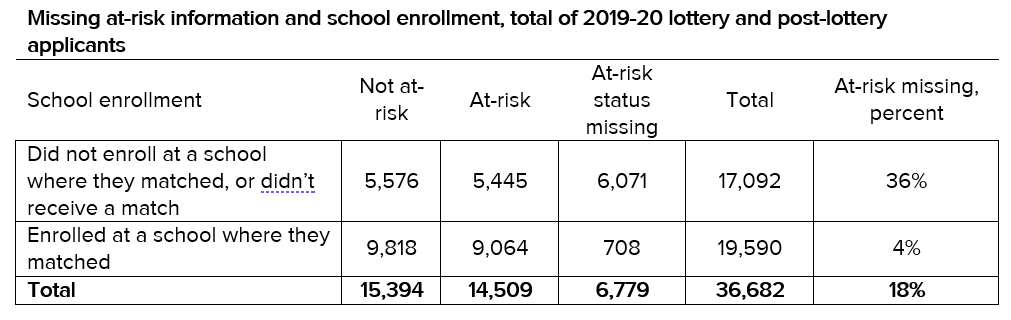
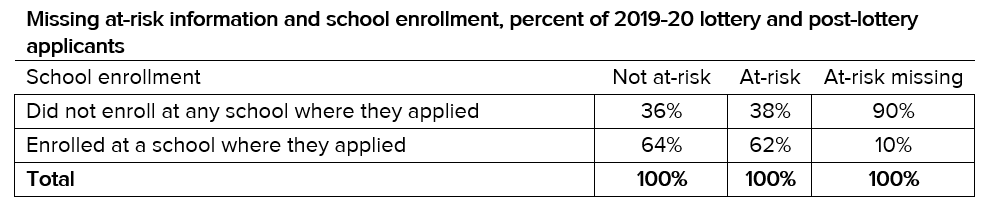
Another limitation of this study is that 18 percent of applicants are missing data on at-risk status across the three years of data. However, this limitation is of little importance for the focus of this study, which is students who applied and eventually enrolled. At-risk information is more likely to be missing for students who didn’t enroll at any school where they applied: 36 percent of applicants who didn’t enroll have missing at-risk status compared to 4 percent who did enroll. When at-risk status is missing for those who did not enroll at a school where they applied, it could be because they are not in the system at all – they may attend private school, homeschool, or childcare; they could have moved out of state; or they may have disengaged from high school, among other options.[17] When at-risk status is missing for those who did enroll, this could be because their names or birth dates didn’t perfectly match with enrollment information. Due to technical issues, the information from enrollment audit on at-risk status didn’t merge with information from lottery application.
However, at-risk status is not systematically different for those who enrolled or didn’t enroll among the students for whom it is reported. Excluding students for whom there is no at-risk status data, the split between at-risk and not-at-risk is stable. That means post-enrollment, as more students receive the at-risk or not-at-risk identifiers because they enter the enrollment database, there isn’t a large swing one direction or the other for at-risk status. Among not at-risk applicants, 36 percent didn’t enroll at a school where they applied, and 64 percent did enroll. This is similar for at-risk applicants, of whom 38 percent did not enroll at a school where they applied, and 62 percent did enroll. The at-risk status missing category has the biggest swing, with 90 percent of these applicants not enrolling at a school where they applied, and 10 percent enrolling. This could indicate that the missing values aren’t biased toward excluding at-risk students. Still, it is important when interpreting these findings to keep in mind that at-risk status is missing for 18 percent of applicants.
Applicant analysis
Understanding who participates in the common lottery by at-risk status will explain why certain schools keep serving low percentages of at-risk students, and what schools should consider if they opt into an at-risk priority. These findings show the distribution of applicants by at-risk status and lottery or post-lottery period, grade, and student ward.
Who participates in the common lottery during lottery and post-lottery periods
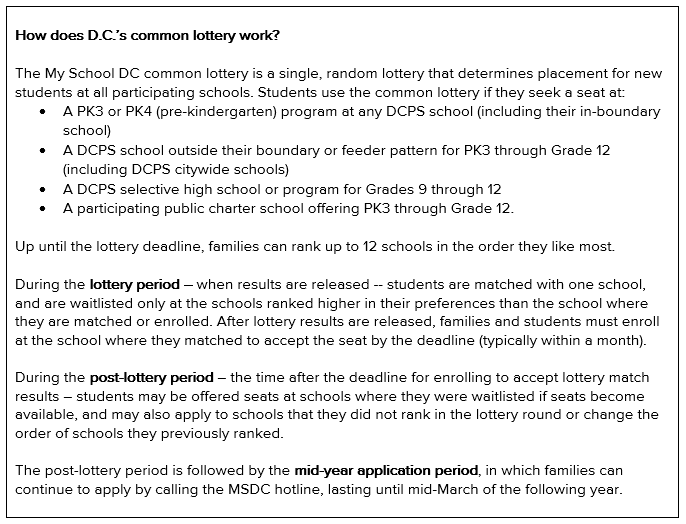
There are two periods of application for the common lottery in D.C., and at-risk applicants are less likely to apply in the first period before the lottery deadline, when schools with waitlists match all their seats. The first period, called the lottery period, begins in December and ends with lottery deadlines in early February for high schools and early March for other grades. The post-lottery period begins after the February or March deadline up to early October of 2019. The post-lottery period is followed by the mid-year application period, in which families can continue to apply by calling the MSDC hotline, lasting until mid-March of the following year.
In this analysis, lottery applicants are defined as those who apply before the lottery deadline, and post-lottery applicants are those who apply after the deadline for the lottery. Applicants can also participate in both lottery and post-lottery periods if they submit applications during both time periods.
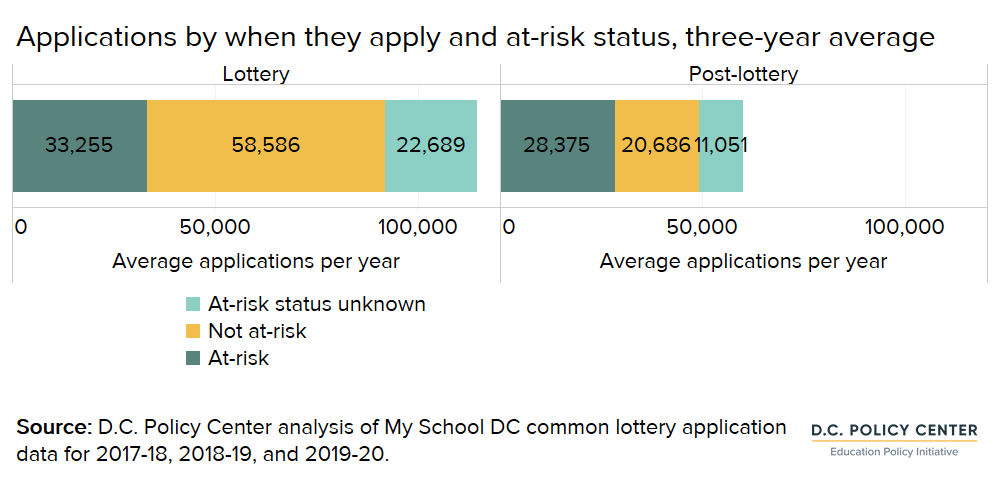
Number of applicants during lottery and post-lottery periods
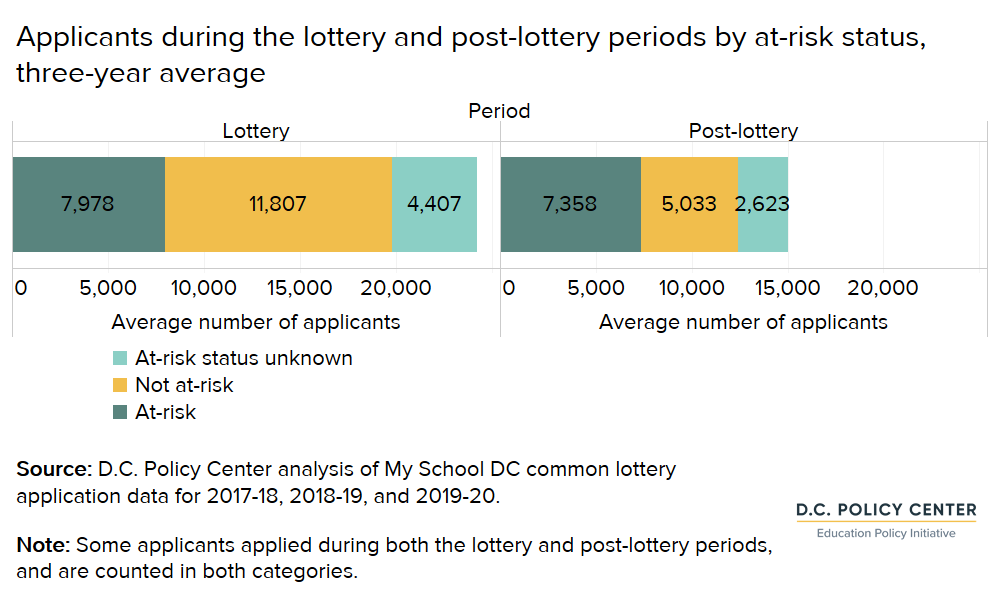
There are more applicants during the lottery period than the post-lottery period, and most of these lottery period applicants are not at-risk. For the three years in our sample, for every 100 lottery applicants, there are 62 post-lottery applicants, and not at-risk applicants outnumber at-risk applicants during the lottery period by an average of 3,829. However, during the post-lottery period, this distribution is reversed: At-risk applicants outnumber not at-risk applicants by an average of 2,324 applicants. On average, there were 24,192 applicants during the lottery period, and 11,807 were not at-risk compared to 7,978 who were at-risk. There are fewer applicants overall during the post-lottery period, at 15,014 across the three years, and only 5,033 of these were not at-risk compared to 7,358 who were at-risk. At-risk applicants make up a smaller share of the lottery period applicant pool, when matches at schools with waitlists are made, and a larger share of the post-lottery pool.
Applicants during lottery and post-lottery periods compared to enrollment
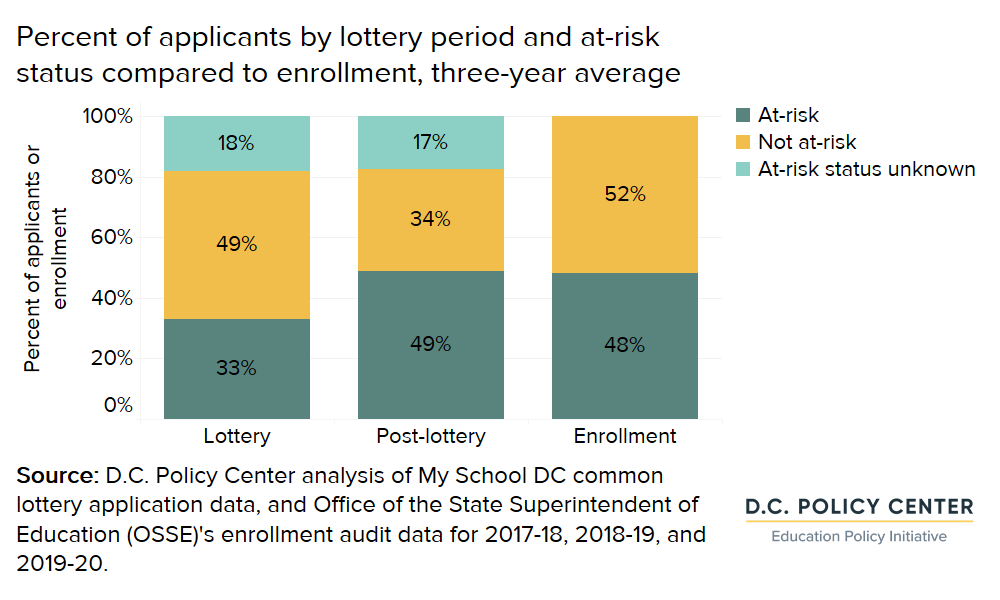
Relevant for this analysis, at-risk applicants comprise a lower share of the applicant lottery pool than not at-risk students: 33 percent on average in the three years of our sample data. This shifts for the post-lottery period, when 49 percent of applicants are at-risk on average across three years. Across these three years, at-risk enrollment represents an average of 48 percent of students. This means that at-risk applicants are slightly less likely to apply during the lottery period compared to how many at-risk students there are, and slightly more likely to apply during the post-lottery period factoring in the unknown applicants.
Who participates in the common lottery, by grade
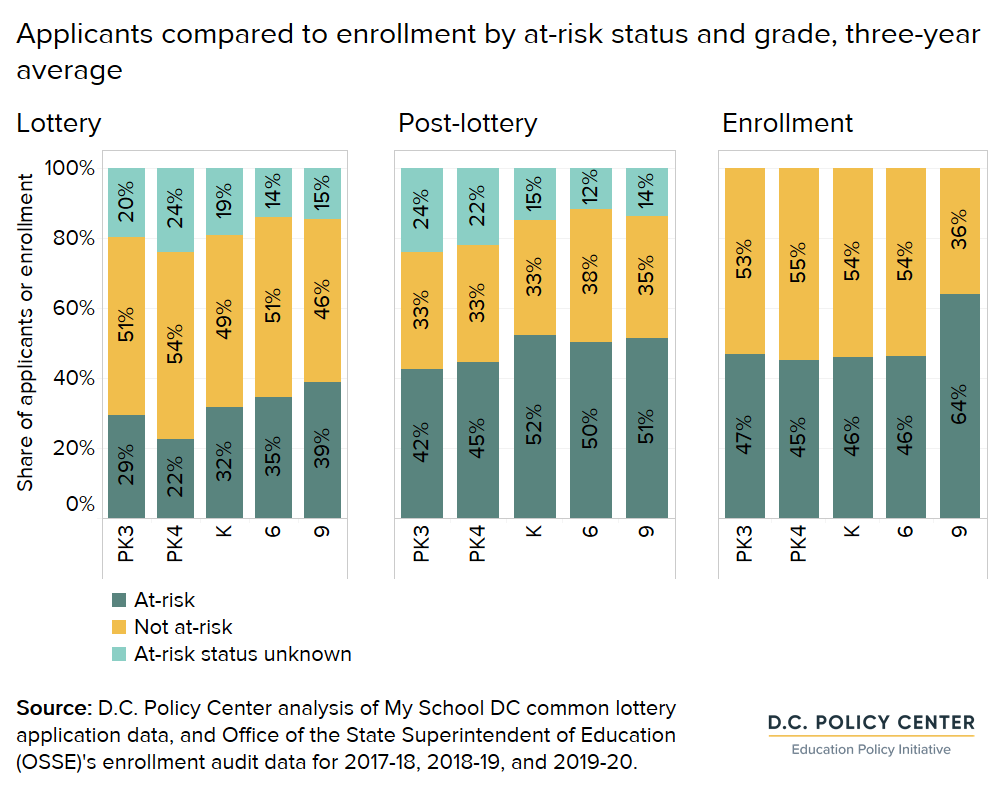
At-risk applicants are also less likely to apply in the early grade of PK3, the entry grade for most students that usually sets their school course for at least elementary school and the grade that has the most available seats as an entry grade. PK3 is also a critical year to consider for an at-risk priority as more seats are matched through sibling preference, which reinforces existing demographics at a school, and this could determine a student’s school enrollment for up to eight years.[18] Additionally, in some cases, one’s elementary school also opens up middle and high school feeder pattern options. And all students applying for a seat in PK3 or PK4 for the first time must use the common lottery, making these grades especially important to understand for at-risk students.
Applicants by grade in the lottery period
By grade, the earliest grade of pre-kindergarten for three-year-old children (PK3) is also the most common grade for applicants, representing 22 percent of all lottery applicants in 2019-20, for example. There are also larger than average numbers of applicants in PK4, kindergarten, grade 6, and grade 9 – all of which are common entry grades. The grades with higher number of applicants have been consistent over the last three years. There are more not at-risk applicants participating in the lottery in early grades, and more at-risk applicants participating in the lottery in later grades. There are fewer at-risk applicants in PK3, with 1,623 at-risk applicants on average, compared to 2,785 not at-risk applicants in PK3.[19] By grade 9, there are almost equal numbers of at-risk applicants, with 1,269 on average, compared to 1,519 not at-risk applicants.
Applicants by grade compared to enrollment
At-risk applicants tend to be a lower percentage of lottery applicants in early years (29 percent of applicants in the entry grade of PK3 on average), and a higher portion of the applicant pool in older years (39 percent of applicants in grade 9 on average).[20] This is aligned with an albeit-larger increase in the percentage of enrolled at-risk students: from 47 percent in PK3, to 64 percent in grade 9 on (average over the past three years). Students not considered at-risk represent a higher percentage of lottery applicants in early years (51 percent in PK3) and a lower percentage in older years (39 percent in grade 9), when they decrease to 36 percent of students.
Where do applicants live?
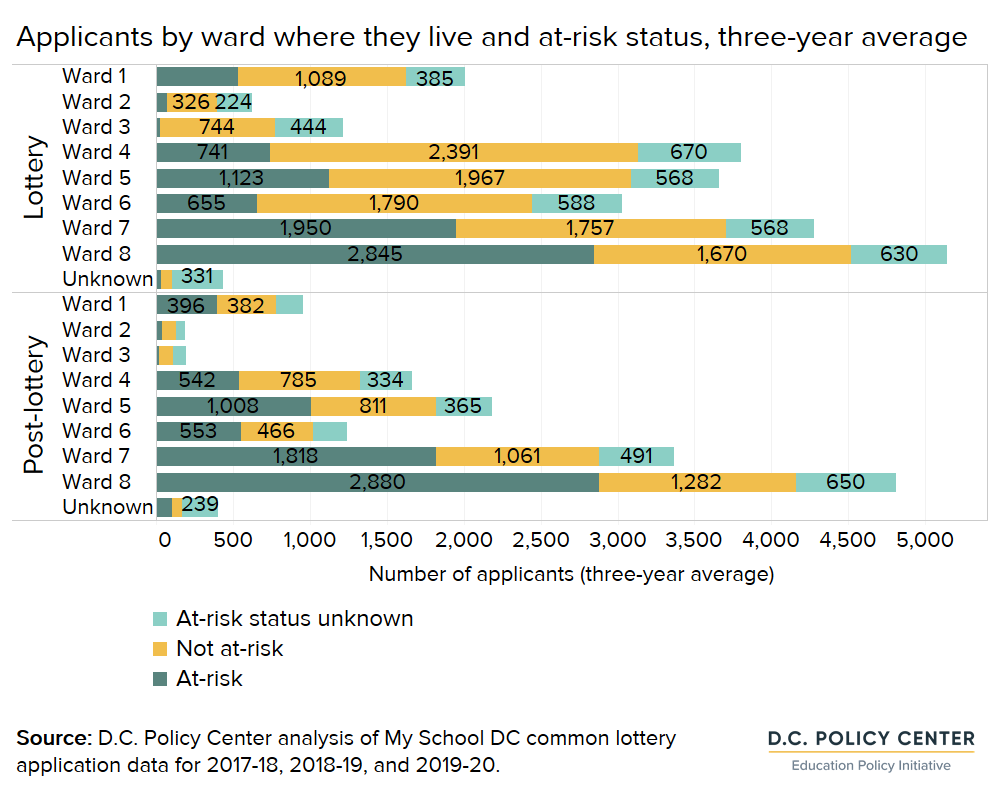
Regardless of at-risk status, Wards 7 and 8 are home to the greatest numbers of applicants to the common lottery. This is aligned with where the greatest number of enrolled students live, and relevant for an at-risk priority in the common lottery given that most schools with high waitlists serving low percentages of at-risk students are located in other wards.
Applicants by ward of residence
There are a few different patterns to note by ward. In Wards 7 and 8, where there are the most lottery applicants, at-risk applicants outnumber not at-risk applicants, and the number of applicants by at-risk category is similar across the lottery and post-lottery periods.
However, Wards 1, 4, 5, and 6 look quite different. In these wards, not at-risk applicants greatly outnumber at-risk applicants in the lottery round – and there are far fewer not at-risk applicants in the post-lottery round. In Wards 2 and 3, there are fewer applicants than other wards, and most of them are not at-risk in either rounds.
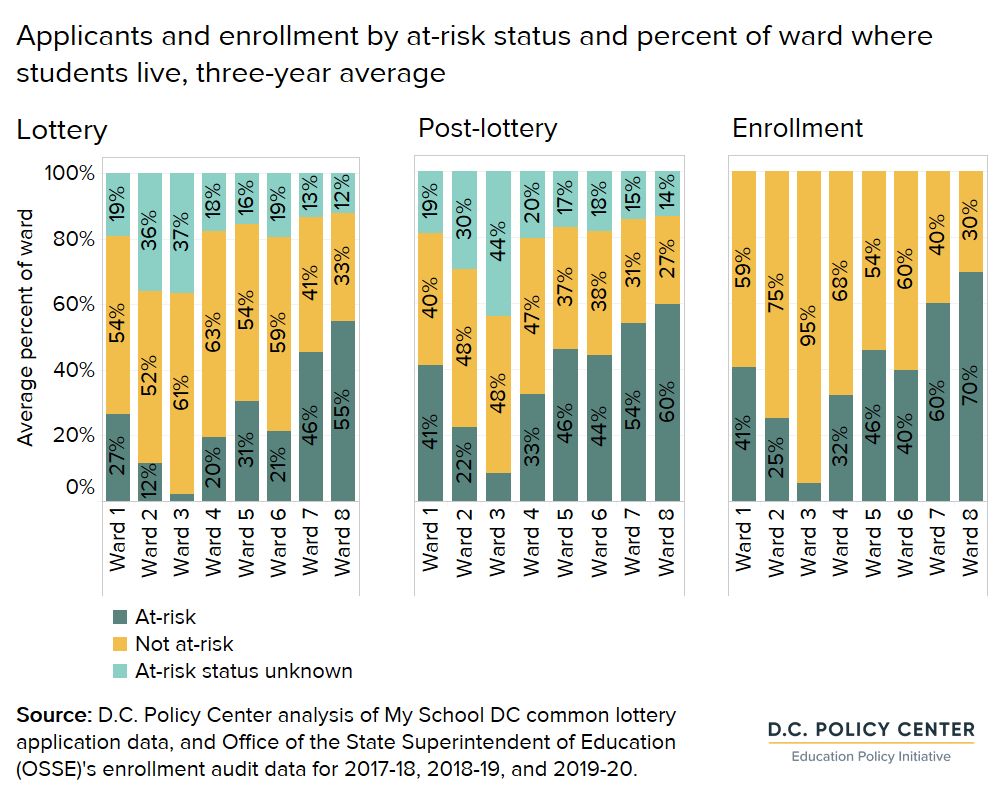
Applicants by ward compared to enrollment
In Wards 7 and 8, the percentage of not at-risk applicants is a little higher than the percentage of not at-risk students enrolled, meaning that not at-risk applicants in these wards may be a little overrepresented in the lottery. With 12 and 13 percent of applicants missing an at-risk status in these wards, respectively, this may indicate that not at-risk applicants in Wards 7 and 8 are more likely to apply in the lottery than their at-risk counterparts.
Application analysis
The previous section analyzed applicants, or individual students. This section looks at applications, or the schools to which those applicants apply. Each applicant may apply to up to 12 schools.
A school can receive an application from a student who has ranked other schools, and therefore also created applications with those other schools. On average over the last three years, 174,643 applications were submitted by applicants during the lottery and post-lottery periods, meaning that unique applicants applied to multiple schools. Most (66 percent) of the applications were submitted during the lottery period, and not at-risk applicants submitted the highest share of applications, at 45 percent of applications.
During the lottery period, at-risk applicants are likely to apply to fewer schools than their peers who are not at-risk: a median of three schools for at-risk applicants compared to four schools for not at-risk applicants. This is especially true in the early grades, where not at-risk applicants apply to a median of five or six schools in PK3, PK4, and kindergarten, compared to three schools for at-risk applicants.
During the post-lottery period, applicants apply to fewer schools (median of two schools). This is the same for not at-risk and at-risk applicants.
Applications to high waitlist and low at-risk schools
To get a sense of how an at-risk priority might be implemented, this analysis looks at a subset of schools that have high waitlists and serve low percentages of at-risk students. When a school has a high waitlist, it means that applying through the common lottery does not guarantee a seat. When a school serves a low percentage of at-risk students, it is less socioeconomically diverse. We identified long waitlists as those in the 75th percentile or higher (those with 292 applicants or more in 2019-20), and a low percentage of at-risk students as being in the 25th percentile or lower (29.1 percent of students at-risk or lower in 2019-20) in each year.
In 2019-20, 45 schools met our criteria for high waitlist and low at-risk schools: 26 DCPS schools and 19 public charter schools. Most of the high waitlist low at-risk DCPS schools (17 out of 26) were located in Wards 3 and 6, and most of the public charter schools (16 out of 19) were located in Wards 4 and 5. Only one school that meets these criteria is in Ward 7 and none were in Ward 8 – the wards with the largest number of public school students. In total, 21 percent of schools fell into this category. Many offered specialized programs: 8 schools have dual language/immersion, for example.[21]
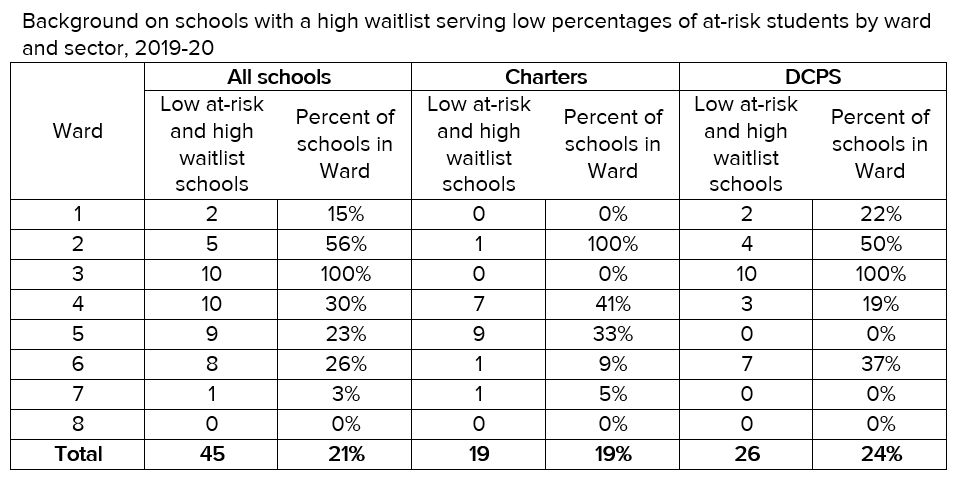
Many applicants apply to least one of these schools with high waitlists serving low percentages of at-risk students, especially during the lottery period. On average, 14,901 applicants applied to at least one of these schools over the past three years during the lottery period, out of an average of 24,192 lottery applicants overall: over half of all applicants apply to one of these 45 schools. During the lottery period, not at-risk applicants outnumber at-risk applicants by almost three to one. Applicants apply to public charter schools and DCPS schools in this category in almost equal numbers.
Within public charter schools that could opt into an at-risk priority if approved by the D.C. Council, the majority of applicants (58 percent) are not at-risk during the lottery period. There are fewer applicants to at least one these schools during the post-lottery period (4,891 on average), when all seats have been matched. However, there are enough at-risk applicants for a priority to make a difference. During the lottery period when an at-risk priority could make the most difference, 2,747 at-risk applicants apply to at least one of these 19 public charter schools, which is an average of 145 at-risk applicants per public charter school with a high waitlist serving a low percentage of at-risk students. This is a high enough number to make a difference in shifting demographics even if all schools opt in the same year – the average number of open seats at this subset of public charter schools is 88.
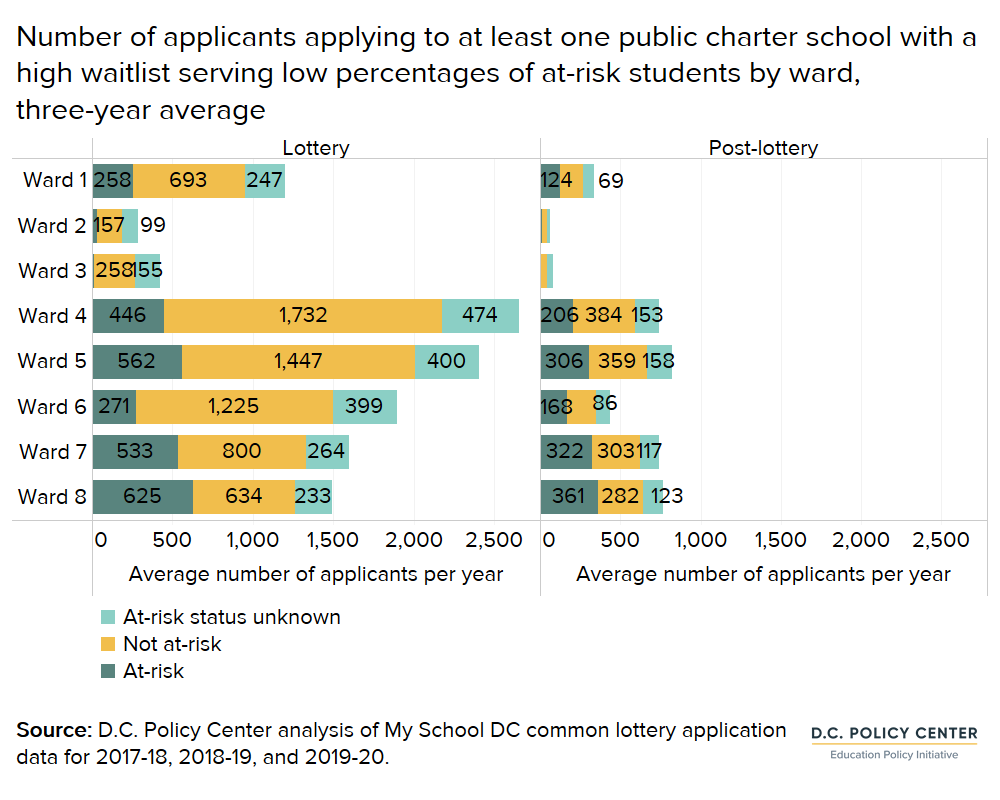
Focusing on public charter schools with high waitlists serving low percentages of at-risk students that may opt into a potential at-risk priority, Wards 4 and 5 are home to the highest numbers of applicants to these schools. These are also the wards where most of these schools are located (16 public charter schools with high waitlists serving low percentages of at-risk students are in Wards 4 and 5).
Outcomes for at-risk students at schools with high waitlists serving a low percentage of at-risk students
This study focuses on application patterns, but it is also important to consider learning outcomes at schools that applicants rank. At-risk students do rank the schools with the highest waitlists serving low percentages of at-risk students. On average, learning outcomes in terms of growth and proficiency are better for at-risk students at schools with a low percentage of at-risk students and a high waitlist. For example, 31 percent of at-risk students meet or exceed expectations in English Language Arts (ELA) at schools with high waitlists serving a low percentage of at-risk students, compared to 21 percent for all at-risk students.
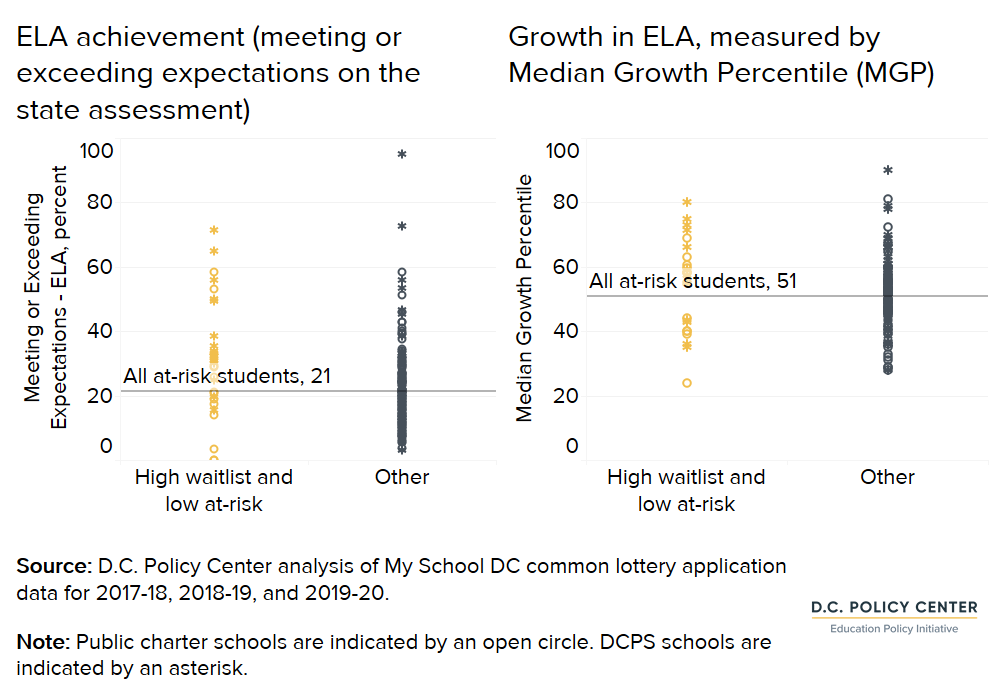
But some of these schools are not achieving the best results for at-risk students. As shown in the graphs below, several of these schools with high waitlists serving low percentages of at-risk students have outcomes that are below the city average for their at-risk students in achievement and growth (seven public charter schools and two DCPS schools for achievement, and five public charter schools and four DCPS schools for growth).[22] If these schools seek to serve more students who are at-risk, they should improve their supports for at-risk students. This could include strategies identified by EmpowerK12 that “bold” schools in D.C. use to close achievement gaps, such as frequent and intentional use of data, collaboration across classrooms and schools, creating a warm socio-emotional environment, or holding high expectations.[23]
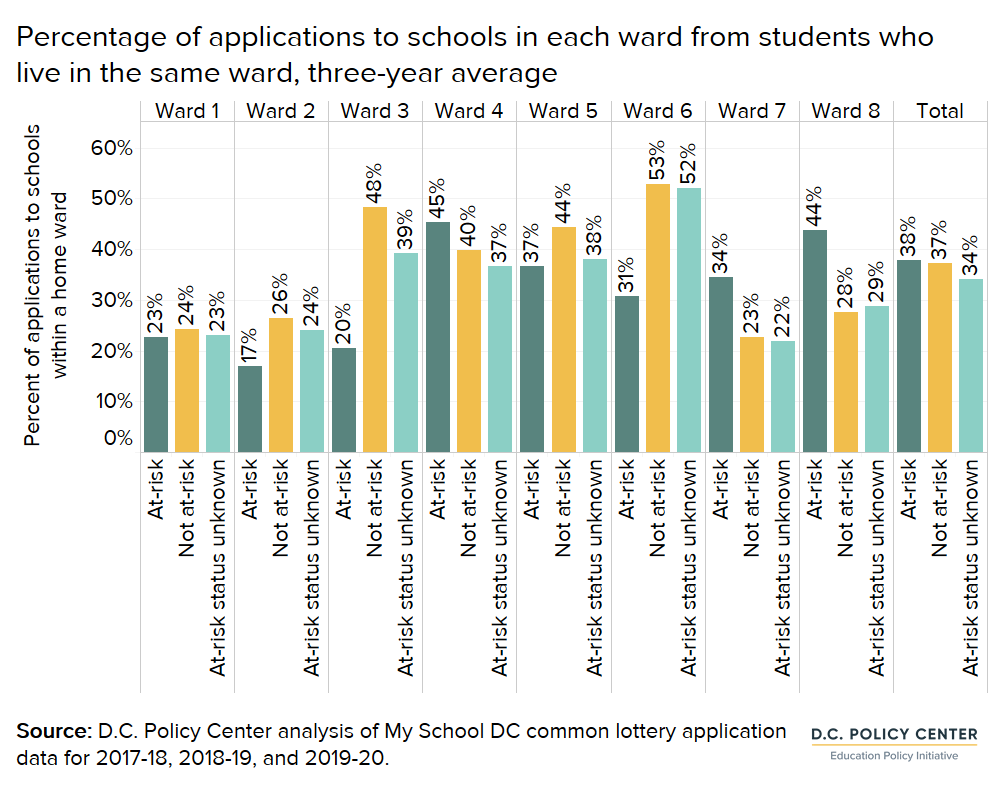
Applications by location, close to home
Given the concentration of schools with high waitlists serving low percentages of at-risk students, it is important to consider that 36 percent of applications to all schools are to schools within a student’s home ward. During the lottery period, this is similar for applications from at-risk applicants, where 38 percent are to schools within a student’s ward, and applications from not at-risk applicants, where 37 percent are to schools within a student’s ward. However, this distribution varies by ward. In Wards 7 and 8, applications from at-risk applicants are more likely to be within their home ward than for not at-risk applicants in the same wards, which could be related to commuting issues (only one of the 45 schools was located in Ward 7 or 8 in school year 2019-20, for example). This could mean that at-risk applicants in Wards 7 and 8 are less likely to rank schools farther from home, which could influence the extent to which an at-risk priority impacts at-risk students in Wards 7 and 8 where many at-risk students live. In Wards 3 and 6, by comparison, at-risk applications are less likely to be within a student’s home ward. Wards 4 and 5, where many of the high waitlist schools serving low percentages of at-risk students are located, have similar splits for applications from at-risk and not at-risk applicants.
Implications for an at-risk priority
The extent to which this policy makes a difference in access for at-risk students and socioeconomic diversity depends on how at-risk applicants apply to the common lottery. Divergent patterns in applications across at-risk and not at-risk students result in fewer at-risk applicants to high waitlist schools than not at-risk applicants, and lower numbers of at-risk students matching at these schools. That is, schools that implement this policy should take into consideration these divergent patterns to avoid maintaining existing demographics.
Socioeconomic diversity at D.C.’s public schools has not improved in recent years. Although many schools have between 50 and 70 percent of students who are at-risk, there is a subset of 19 schools where less than 10 percent of students are at-risk.[24] The applicant data show that there are enough at-risk applicants to these schools to take steps toward improving socioeconomic diversity if this policy is implemented well.
What does this mean for schools?
- All but one of the public charter schools with high waitlists serving low percentages of at-risk students are located west of the Anacostia River. For this policy to have an effect across the city, this could mean that both more outreach and supports are needed to reach students living in Wards 7 and 8.
- At-risk students apply through the lottery in lower proportions compared to total enrollment (even in pre-kindergarten), but they do apply intensively during the post-lottery period. Schools implementing the priority as a preference will need to make sure at-risk applicants apply by the lottery deadline, and those implementing the priority by reserving seats will need to keep those seats open for a longer period.
- If some schools adopt an at-risk preference, and others don’t, schools that don’t implement the priority could also see a shift in enrollments given that there are enough at-risk applicants applying to one of these high waitlist schools. They may see a decrease in at-risk applicants matching, but an increase in not at-risk applicants matching (who no longer match at the other schools), for example.
What does this mean for common lottery applicants?
- At-risk applicants apply through the lottery in lower proportions than at-risk students in total enrollment (even in pre-kindergarten), so not at-risk students are more likely to gain access to schools with high waitlists due to their higher participation rates. This may change with an at-risk priority that shifts matches to at-risk students.
- Currently, there are 19 public charter schools with high waitlists serving low percentages of at-risk students where this policy might make a difference to improve match rates for at-risk applicants or increase socioeconomic diversity. Most of these schools (16 out of 19) are in Wards 4 and 5.
- Among applicants living in Wards 7 and 8 (where most at-risk students live), at-risk applicants are less likely to apply to public charter schools with high waitlists serving low percentages of at-risk students, compared to not at-risk applicants. Given that most of these public charter schools with high waitlists serving low percentages of at-risk students are in Wards 4 and 5, this means that a lower percentage of at-risk applicants living in Wards 7 and 8 is likely to benefit from this policy – or that if they do, they will have to travel farther.
What questions remain?
- The application data can’t show why at-risk students are more likely to miss the lottery deadline, which could inform how schools target their outreach to recruit more at-risk students through this priority.
- The application data also don’t explain why at-risk or not at-risk applicants apply to the schools they do, and whether at-risk applicants would prefer these high waitlist schools if they had a better chance at a match.
The common lottery in D.C. has been a mechanism for allocating seats in D.C.’s public schools since the 2014-15 school year, with one of the purposes to simplify the application process to DCPS schools as an out-of-boundary student, public charter schools, or pre-kindergarten. This analysis shows that at-risk students are less likely to use the common lottery, especially before the lottery deadline. These patterns have implications for how seats are allocated, especially at public charter schools with high waitlists, and for what to expect with an at-risk priority.
Acknowledgements
The author is grateful to Education Forward DC and the Walton Family Foundation for their generous support of the Education Policy Initiative and this report. The author is grateful to Aryan Bocquet, Matt Chingos, Jenn Comey, Rebecca Lee, Arthur McKee, Cat Peretti, Jon Valant, Betsy Wolf, and Michelle Yan for providing useful comments as well as My School DC and the Office of the State Superintendent who shared data to enable this analysis. At the D.C. Policy Center, Tanaz Meghjani and Sunaina Kathpalia supported this analysis.
The views expressed in this paper are those of the author and should not be attributed to members of the D.C. Policy Center’s Board of Directors or its funders. The research, analysis, and policy recommendations published by the D.C. Policy Center staff and independent experts are not determined by the D.C. Policy Center’s Board of Directors or its funders.