Within schools, student diversity is low in the District of Columbia. The 2018 D.C. Policy Center report, Landscape of Diversity in D.C.’s Public Schools, looked at data from the 2016-17 school year and found that there was less racial, ethnic, and socioeconomic diversity in District of Columbia Public Schools (DCPS) and public charter schools in D.C. than would be expected given student demographics. This analysis updates these findings for the 2018-19 school year, finding that diversity at the school level has not changed much since 2016-17.
There continues to be less racial and ethnic diversity than socioeconomic diversity in D.C.’s schools. At the median school in 2018-19, almost all students represent the same race – 88 percent of students are Black. Socioeconomically, 67 percent of students are from a similar socioeconomic background (measured by whether or not a student is at-risk) at the median school. This means students are more likely to be around others from a different socioeconomic group than other races or ethnicities. Some schools do stand out with a racially, ethnically, and socioeconomically diverse student body, especially in Wards 1 and 4.
Racial and ethnic diversity in D.C.’s schools, 2018-19
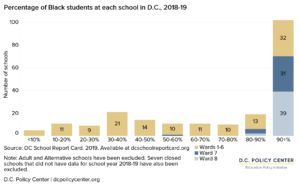
Racial and ethnic diversity in D.C. public schools[1] is low. In school year 2018-19, the District’s public school population is 67 percent Black.[2] Within that context, 102 out of 220 schools have a student body that was at least 90 percent Black. Seventy of these 102 schools are in Wards 7 and 8. Amid a District-wide public school student population that is 12 percent white, 13 schools have a majority-white student body.
For this analysis, we calculated racial and ethnic diversity scores for the 2018-19 school year (the most recent year of available data).[3] Scores are based on the size of the majority group at each school to show student exposure to other racial and ethnic groups.[4] Students are identified as belonging to one of the four following groups: Black, Latinx, white, or other. At each school, one of these four groups is established as the plurality group. The diversity score is the sum of the percentages of students in the remaining groups, or the share of the school’s non-plurality groups. The larger the sum, the more diverse the school. This gives a sense of the extent to which different groups are represented, which increases the potential for interaction between groups.
The chart below shows that many schools have a very low score of less than 5 percent. This means that at these schools, 95 percent of students are from the same race or ethnicity (usually Black). At the median school in 2018-19, 88 percent of students are from the same race or ethnicity and Black, meaning that the school has a diversity score of 12 percent (the percent of students from other groups) and serves a majority of Black students.
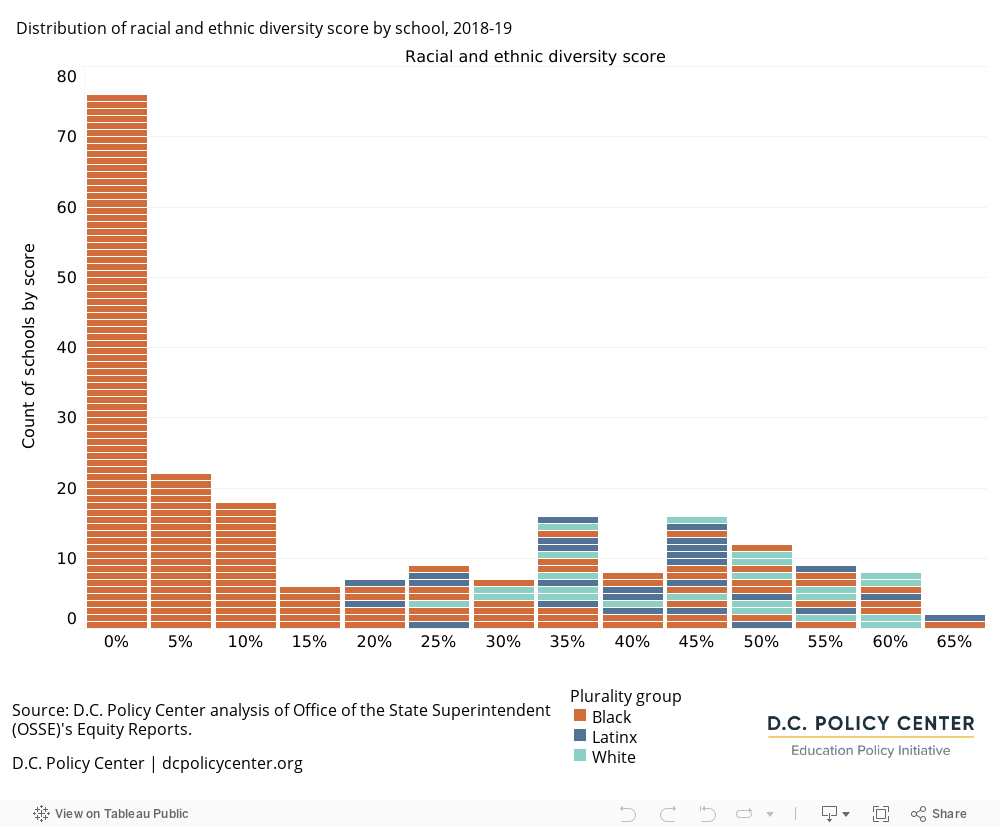
Racial and ethnic diversity increased a little since 2016-17, when the median school had a lower racial and ethnic diversity score of 10 percent and 69 percent of all students in D.C. were Black.[5] However, there is still less racial and ethnic diversity at individual schools than the potential given student demographics. If all students attended school in equal proportions, 67 percent of students would be Black at each school. Many of the schools with the highest racial and ethnic diversity scores have a majority of Latinx or white students.
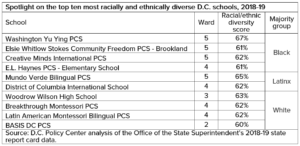
The analysis identifies the 55 most racially and ethnically diverse schools as those with scores in the top quartile (above the 75th percentile). These schools have a racial and ethnic diversity score of 40 percent or higher, and no single group represents more than 60 percent of the student population. They are also more likely to be majority Latinx or white than all schools. About a third of the most racially and ethnically diverse schools are located in Ward 4, and only one is located in Ward 7 or 8. About half of these schools are DCPS and half are public charter schools. The top ten most racially and ethnically diverse schools are listed below the chart.
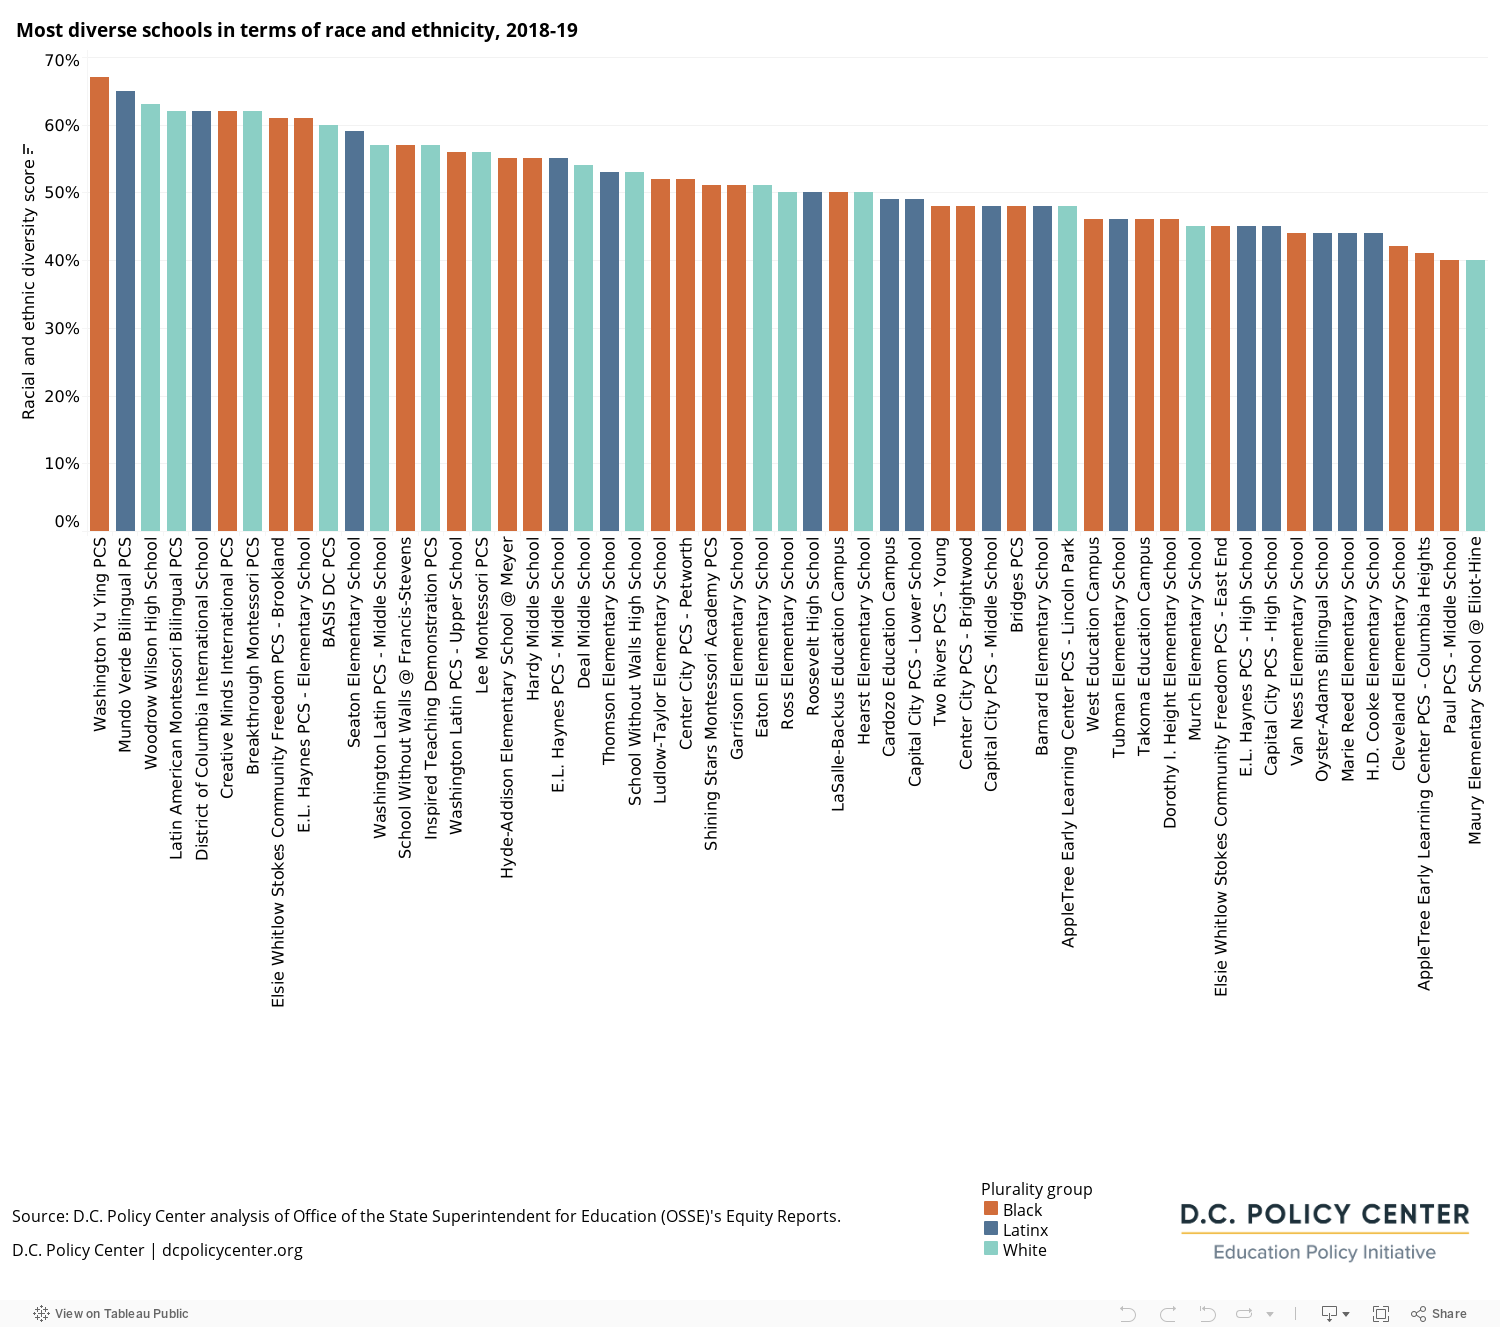
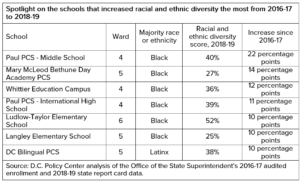
Seven schools have increased their racial and ethnic diversity score by at least 10 percentage points in the last two years, meaning that the student groups are now more equally represented. They are mostly located in Wards 4 and 5, and almost all have a majority of Black students.
Socioeconomic diversity in D.C.’s schools, 2018-19
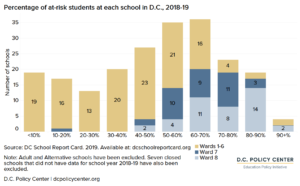
About half (45 percent) of D.C.’s public school students were considered to be “at-risk” for academic failure in school year 2018-19 (a local statutory designation covering students receiving public benefits, experiencing homelessness, being in the foster care system, or being over-age in high school). Schools in D.C. are more likely to have students from a mix of socioeconomic backgrounds (represented by percentage of at-risk students) than they are to have students from a mix of racial or ethnic backgrounds. Even so, 19 schools had a low concentration (less than 10 percent) of at-risk students.
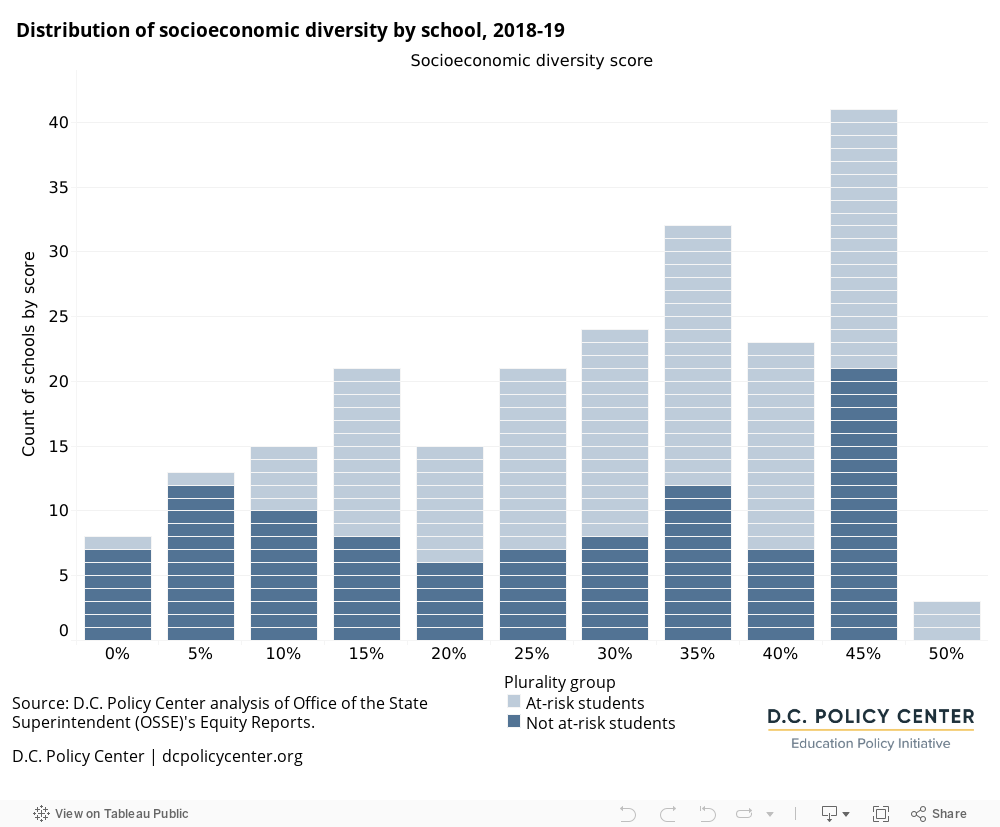
Similar to the racial and ethnic diversity score, the socioeconomic diversity score shows how exposed students are to those of a different group than themselves. Students are identified as at-risk or not at-risk. At each school, one of these two groups is established as the plurality group and the diversity score is the percentage of students in the other group that is a smaller percentage of the student population. The larger the score, the more diverse the school. This gives a sense of the extent to which these different groups are balanced in one school, which increases the potential for interaction between groups.
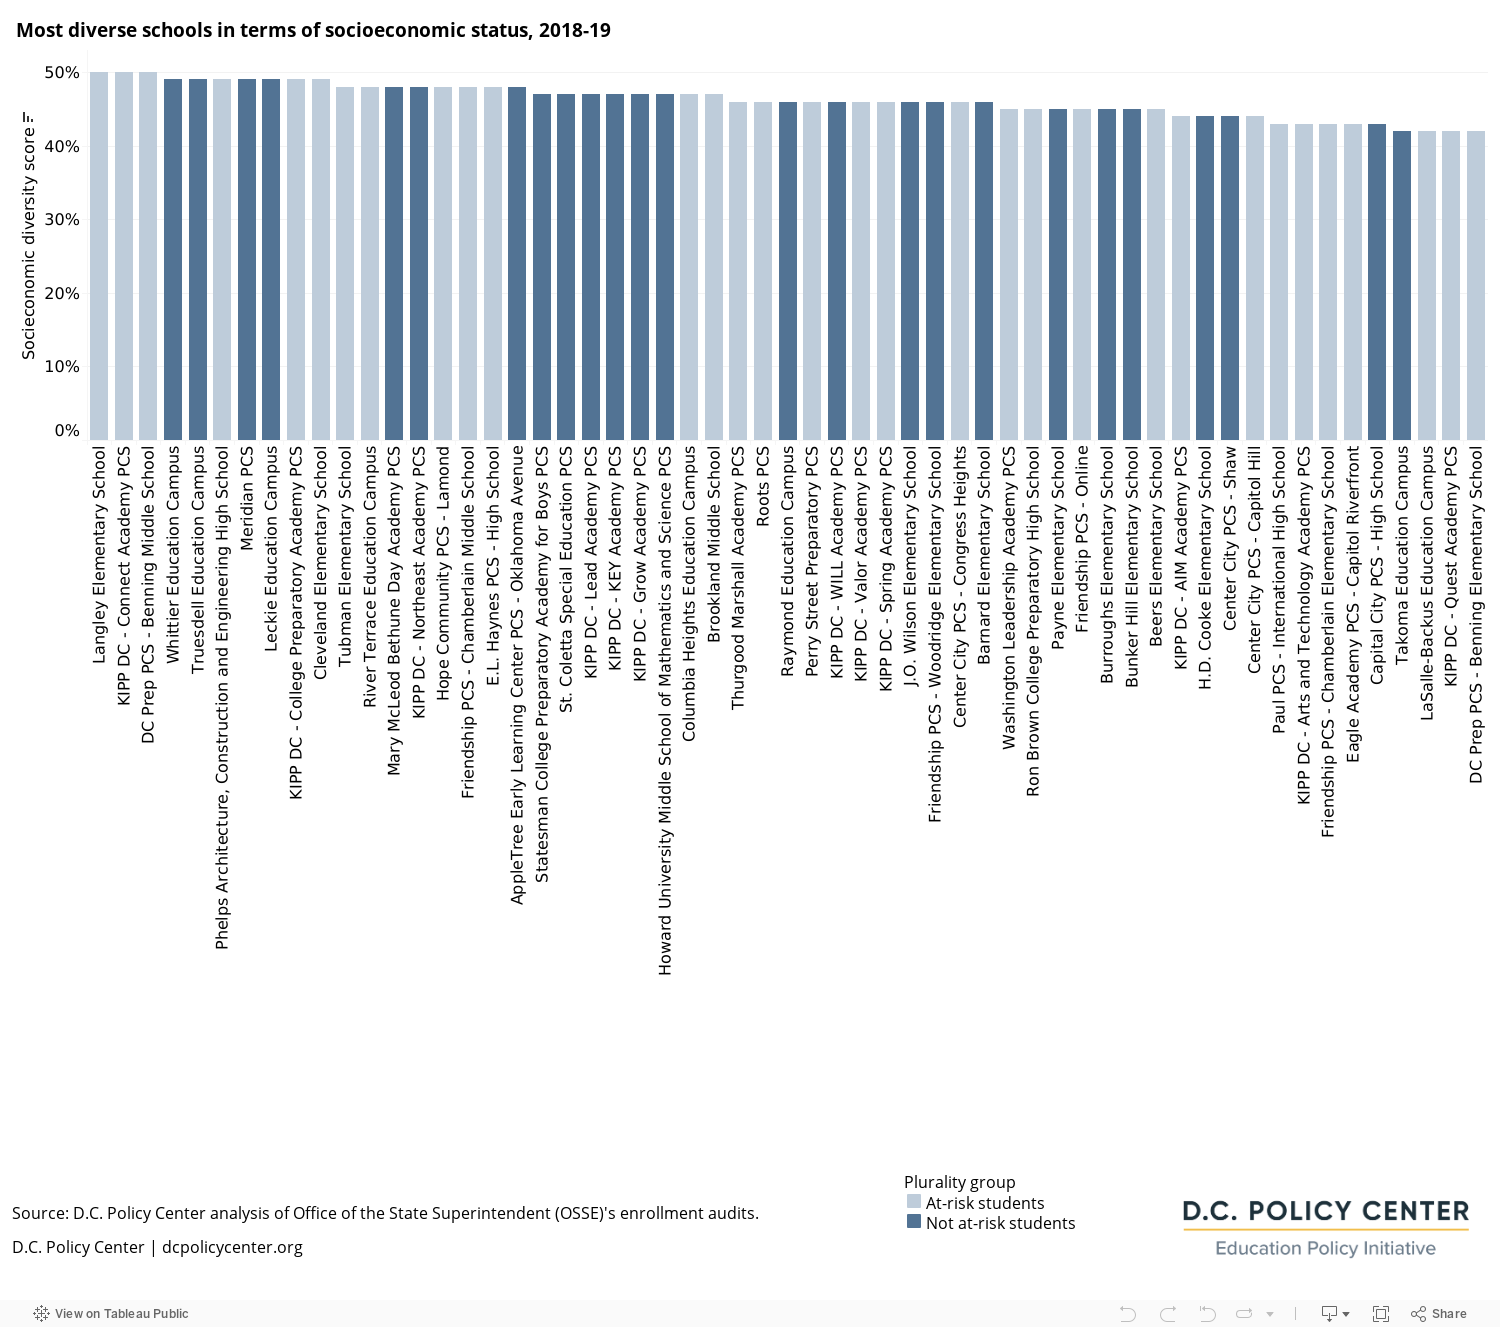
The socioeconomic diversity scores are much higher at many schools than the racial and ethnic diversity scores, in part because there are only two groups that are almost equally represented in the population. The median diversity score is 33 percent, meaning that 33 percent of students are at-risk, and the remaining 67 percent are not at-risk. This is a bit lower than the median score of 34 percent in 2016-17 when a higher percentage of students (47 percent) were at-risk on average in the student population. Eight schools have very low socioeconomic diversity scores of 4 percent of less, and all but one of these schools has a majority of not at-risk students.
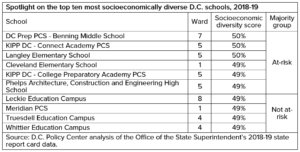
This analysis also identifies the 57 most socioeconomically diverse schools below as those with scores in the top quartile (above the 75th percentile). These schools have a socioeconomic diversity score of 42 percent or higher, meaning that between 42 and 50 percent of students are at-risk or not at-risk at each school. Schools in Wards 1, 4, and 5 are more likely to be the most socioeconomically diverse. Sixty-three percent of the most diverse socioeconomic schools are public charter schools, and the remaining 37 percent are DCPS. The top ten most socioeconomically diverse schools are listed below the chart.
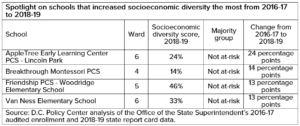
Just four schools increased their socioeconomic diversity score from 2016-17 by at least 10 percentage points. All of these are elementary schools that have a majority of students who were not at-risk in 2018-19, and two of these schools had fewer than 10 at-risk students in 2016-17.
Overlap in racial and ethnic and socioeconomic diversity
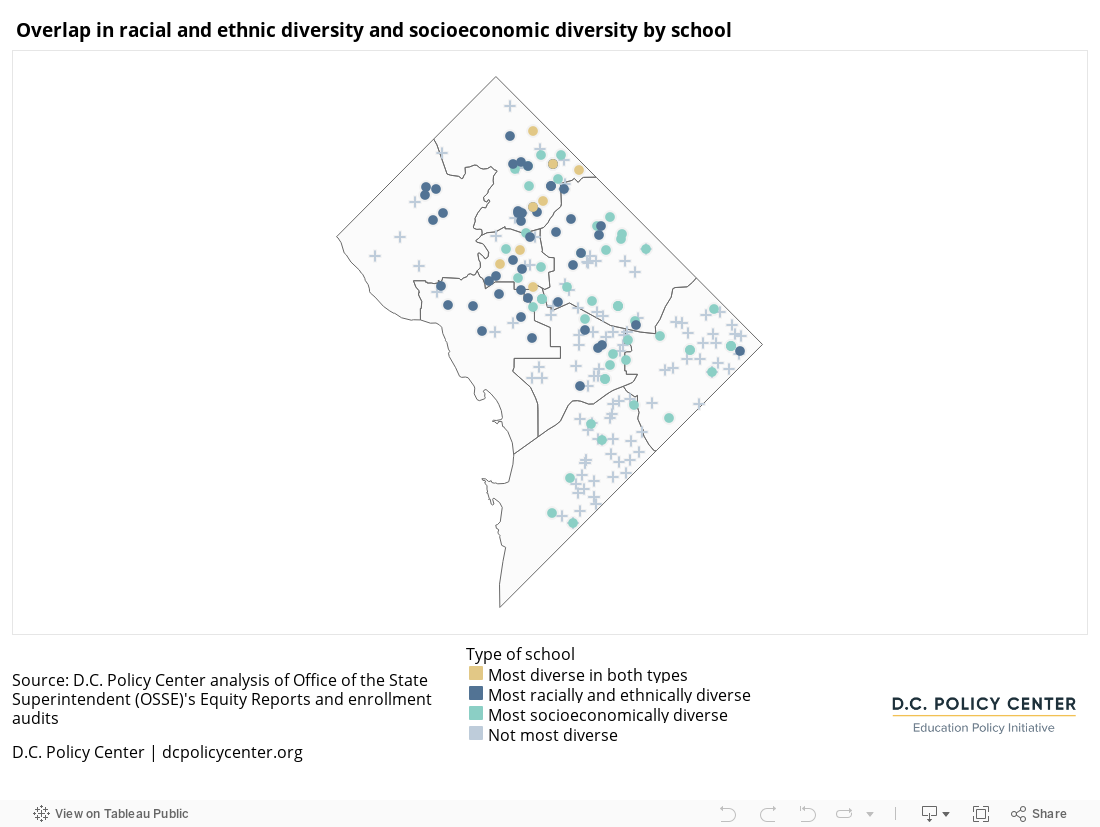
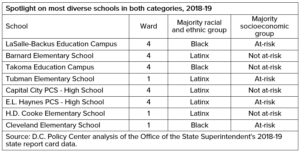
Similar to the 2016-17 school year, there isn’t much overlap in racial, ethnic, and socioeconomic diversity within individual schools. Just eight schools (indicated by yellow dots in the map below and listed in the following table) are the most diverse in both categories. All of these schools were in Wards 1 and 4, and none have a majority of students who were white. Six out of the eight schools were DCPS. Across the city, there is more socioeconomic diversity in the east with concentrations in Wards 7 and 8, and there is more racial and ethnic diversity in the west with concentrations in Wards 2 and 3.
Diversity in D.C.’s schools has not changed much in the past two years, but it may be about to shift at certain schools. The COVID-19 pandemic has created uncertainty about the next school year: Schools are still deciding the extent to which they will offer in-person learning, and families are deciding whether students should return in-person if it is an option – and how they will balance child care with jobs if students stay home for virtual learning. As schools and families are making these decisions, signs are that enrollment in DCPS and public charter schools will be lower than usual for the fall of 2020. There has been an increase in inquiries for enrolling at private schools in the area, which could mean that students from families with higher incomes may be more likely to exit public schools and decrease the potential for diversity at some schools. When and if students do return to school in-person, some may be less likely to make long commutes on public transit to reduce health risks – and in a segregated city, this may reduce diversity if students attend school closer to where they live.
At the same time, increased calls for racial justice could make school integration a higher priority for some families. In addition, the D.C. Council is considering an at-risk priority in the common lottery, which has the potential to increase socioeconomic diversity at some public charter schools. Given all of these shocks to how families and students make decisions about where to attend school, following how diversity shifts in D.C.’s schools will be critical in the coming years. Even if schools become more diverse, true integration within a school requires more than just bringing students together in the same physical space.
About the data
Underlying data on student demographics are from the Office of the State Superintendent of Education (OSSE)’s state report card for 2018-19. To access the data on diversity scores for each school, click here.
Chelsea Coffin is the Director of the Education Policy Initiative at the D.C. Policy Center.
Tanaz Meghjani, Education Analyst, and Sunaina Kathpalia, Research Assistant, contributed to this analysis at the D.C. Policy Center.
Feature photo from Elvert Barnes (Source).
Notes
[1] Here and throughout, public schools refer to both District of Columbia Public Schools (DCPS) and public charter schools.
[2] Office of the Deputy Mayor for Education. 2018-19. Public school enrollment by race and ethnicity. Available at: https://edscape.dc.gov/page/pop-and-students-public-school-enrollment-by-race-and-ethnicity
[3] The analysis has not been carried out for the 2017-18 school year.
[4] For more information, see Landscape of Diversity in D.C.’s Public Schools.
[5] Office of the Deputy Mayor for Education. 2018-19. Public school enrollment by race and ethnicity. Available at: https://edscape.dc.gov/page/pop-and-students-public-school-enrollment-by-race-and-ethnicity