
Breaking the scarcity-subsidy cycle: A new housing vision for the District of Columbia explores current housing conditions in the District of Columbia, outlines challenges to housing growth and affordability, and concludes with a series of 25 recommendations for a vibrant, inclusive housing ecosystem for all of D.C. Read the complete report below or download the PDF copy.
Executive summary
Washington, D.C. has a housing affordability problem, but the underlying issue is larger than affordability alone. The city has built a housing system that produces too little housing, in too few places, at costs that rise faster than incomes and public revenues. Over time, the policy response has been to rely increasingly on subsidies to offset rising costs. Subsidy programs have helped many households, but it has not changed the underlying forces that have created D.C’s affordability crisis. The result is a scarcity–subsidy cycle: policy constrains supply, limited supply raises housing costs, and government responds with larger and more complex subsidies.
Demographic and market changes have made that cycle harder to sustain. The conditions that supported housing growth over the past two decades have weakened. The development pipeline is thinning, permit activity has dropped sharply, interest rates remain elevated, and the city faces greater fiscal pressure. At the same time, other metropolitan areas have reduced friction in their housing systems and are better positioned to absorb demand.
This report argues for a new vision for housing policy in D.C. The District should first make it easier and cheaper to build and operate housing at scale across the city. After expanding housing supply, it should use preservation tools and operating subsidies to create affordability where it is most needed. Durable affordability for all income levels will be created from abundant supply, lower production costs, and better-targeted subsidies.
The problem
The District’s current housing system is the product of decades of policies with overlapping effects. Zoning, historic preservation, tree protections, building codes, energy mandates, utility rules, permitting processes, tax assessments, and rental regulations were created individually. Together, they operate as a system that slows construction, limits where housing can be built, and raises both development and operating costs.
D.C. uses several subsidy programs to try to create affordable housing within this limited housing market. The Housing Production Trust Fund, Low Income Housing Tax Credit, Housing Choice Vouchers, Local Rent Supplement Program, Inclusionary Zoning, and PUD-based public benefits all play a role, but they can only create limited affordable housing in a market that is not expanding. As a result, they become more expensive as scarcity worsens. They often produce housing in a limited geographic area rather than where opportunity is greatest, and their administrative processes create long delays and financial burdens on housing providers. Our suggested reforms are designed to reduce per unit costs, target subsidies to need, and scale programs across the city.
Why this matters now
Changes in economic and demographic conditions have made regulatory frictions more likely to stall or prevent housing growth. In 2025, only 1,372 multifamily units were permitted, down from 5,000 to 8,000 annually just a few years earlier. In January 2026, only one multifamily building pulled a permit, for 30 units. This is a housing problem which culminates into an economic growth problem, reducing the city’s competitiveness and fiscal capacity. A city that cannot add housing at scale will struggle to retain families, attract workers, support employers, and sustain public commitments.
The new vision
The proposed housing vision begins with a simple premise: the District should stop treating high housing costs as a fixed condition and start treating them as the predictable result of policy choices. If the city wants more affordability, more inclusion, and more fiscal sustainability, it must make housing production easier, cheaper, and more geographically broad.
Cities that allow more housing to be built across many neighborhoods and typologies experience slower rent growth, more naturally occurring affordable housing, and greater long-term affordability. D.C. must pivot from scarcity management to cost reduction and supply expansion.
The fiscal potential is equally consequential. Each new housing unit generates roughly $15,500 in combined annual tax revenue. At scale, growth becomes self-reinforcing: more residents support more local businesses and transit use; more revenue supports better services; and a stronger, more diverse housing market reduces the city’s dependence on subsidies.
A well-functioning housing system would have several features. Housing production would be legal and feasible across more neighborhoods, including high-opportunity areas. Incremental and moderate-density housing would be allowed by-right in more places. Regulatory systems would be aligned so they do not work against one another. Public subsidies would complement a functioning market rather than substitute for one. And households would have meaningful neighborhood choice instead of being limited to a small number of growth areas. This is the through-line of the paper’s four pillars for housing reform and their implementation.
The reform agenda
Pillar I: Unlock housing supply across the entire city
- Expand multifamily zoning from 26 to roughly 50 percent of residential land
- Eliminate minimum parking requirements
- Adopt a uniform citywide minimum lot size of 1,400 square feet for all single-family zones
- Allow building heights up to the limits of the federal Height Act
- Reform zoning to allow ADUs and small apartments
Pillar II: Reduce costs by modernizing codes, environmental rules, and permitting
- Make permitting faster and more predictable
- Expand third-party permit review low-risk projects
- Remove local building code amendments that create cost without safety gains and use IEBC for existing buildings
- Restore a simplified energy code compliance path for small buildings and limit mandatory application of the Green Construction Code to buildings over eight stories
- Restructure BEPS to calibrate targets by building age and financial capacity
Pillar III: Modernize landlord-tenant relations, tax assessments, and preservation programs
- Shorten eviction timelines
- Fix tax assessments for affordable housing
- Rebalance public space and utility exaction rules
- Reform the PUD process
- Align historic preservation with housing goals
- Modernize historic tree laws
- Create a standing housing feasibility review board
Pillar IV: Align subsidies with sustainable, high-value public outcomes
- Use preservation as primary affordability strategy
- Use rent-buy downs to create affordable housing across the city
- Fix IZ program to increase efficiency and production
- Reform LRSP to improve targeting and costs
- Condition local housing subsidies on regulatory reform
- Restructure governance to reflect housing as economic development
The choice in front of the District
The District does not have to choose between market production and affordability, or between growth and inclusion. It does have to choose whether to continue operating a housing system that makes affordability expensive and scarce, or to build one that makes affordability easier to sustain.
The current system asks subsidies to compensate for policy-induced scarcity. The proposed system would reduce that scarcity directly. It would produce more homes, in more places, at lower cost, while reserving public resources for the households and neighborhoods that need them most. That is the practical test for housing policy in the next several years: whether the District can move from managing scarcity to building capacity.
Section 1. Introduction
Washington, D.C. is entering a period of profound transition. For roughly two decades, the city benefited from a favorable alignment of job growth, population gains, and accessible capital. Between 2000 and 2020, the District added more than 84,000 housing units, increasing the housing stock by 30 percent.[1] That expansion helped absorb demand and kept price growth below that of peer cities such as New York, Boston, San Francisco, and Los Angeles.[2]
The headline numbers, however, obscure what kind of growth occurred. New housing was highly concentrated: ten census tracts out of 433 accounted for nearly one-third of all units built across the city.[3] Production also clustered in a narrow set of building types that are primarily smaller units in large, amenity-rich multifamily buildings located near transit or in areas that had been rezoned for higher density.[4]
These outcomes reflect the city’s land use rules and housing regulations. Much of the District’s zoning limits density across the majority of residential land. The permitting and approval process favors large projects that can absorb the costs of delay and complexity. Building codes impose fixed costs that are easier to manage at large scale. Development has occurred where it is allowed and in forms that are most financially feasible.
Even during a period of sustained expansion, housing supply did not fully meet demand. Between 2012 and 2022, housing costs continued to outpace income growth,[5] and affordability emerged as a central constraint for households, employers, and the city’s long-term competitiveness. The policy response increasingly relied on subsidies to offset these pressures. Public spending on housing rose substantially, exceeding $1 billion annually, including $727 million in direct subsidies.[6] These investments played an important role in maintaining access for lower-income residents, but over time, they also became embedded in the system as substitutes for structural reform.
The conditions that once sustained the District’s housing market are weakening. Permitting activity declined sharply, signaling the end of the recent supply cycle. As of end of 2025, there were 46 multifamily buildings under construction, expected to deliver 4,677 units.[7] Beyond that pipeline, the expected supply in coming years is markedly worse.[8] In 2025, only 1,372 multifamily units were permitted,[9] down from an annual range of 5,000 to 8,000 just a few years earlier. In January of 2026, only one multifamily building pulled a permit for 30 units. Higher interest rates, sustained construction cost pressures, and slower revenue growth have limited the city’s ability to rely on subsidies to offset constrained supply.[10]
At the same time, the District operates in a more competitive regional and national landscape. Several metropolitan areas including Minneapolis, Portland, Houston, and Charlotte have adjusted land-use frameworks, reduced regulatory friction, and allowed more flexible housing growth. The effects are visible in comparative outcomes: regions that have consistently expanded supply have seen more moderate rent growth and greater residential mobility, while higher-cost, lower-growth markets (including the District) experienced decreased affordability, reduced economic diversity, and increased housing insecurity.
D.C. is now at a decision point. The current system does not produce the volume or diversity of housing required to meet demand, nor does it align with the city’s broader objectives for economic competitiveness, fiscal sustainability, and inclusion. A shift is required to create a housing system that is able to add and preserve units across neighborhoods, price points, and building types in a more predictable and responsive way.
This report provides the analytical foundation for that shift. It traces the development of the District’s scarcity–subsidy cycle, explains the structural barriers to housing production embedded in zoning, building codes, environmental requirements, and administrative processes, and documents how these factors affect costs and outcomes. It then presents 25 policy recommendations designed to better align housing production, public investment, and long-term economic performance. Taken together, these elements define a new vision for the District’s housing system that builds housing capacity, rather than manages housing scarcity.
Section 2. The scarcity-subsidy cycle: How D.C. built a high-cost, low-yield housing ecosystem
The District’s housing affordability crisis is caused by a self-reinforcing system of its own creation. For decades, D.C. policies have constrained the production of new housing, increased building and operating costs, and then expanded subsidies to offset the prices produced by these policies. Together, these elements create the scarcity-subsidy cycle that shapes the city’s housing outcomes.
The effects extend beyond higher costs.[11] The regulatory framework influences where housing is built, in what form, and at what pace.[12] It reduces the market’s ability to adjust to changes in demand, leading to persistent underproduction, rising prices, and development patterns that shift housing farther from jobs and transit.
Public spending reflects scarcity-driven high costs. Annual housing expenditures now exceed $1 billion, yet affordability remains limited and disparities across neighborhoods persist. The scale of public investment has grown alongside the constraints that necessitate it. This section examines how this cycle operates, why it has proven durable, and how it affects both market behavior and the use of public resources.
Scarcity by design: How the District constrains supply
Zoning, building codes, historic preservation, environmental requirements, utility rules, tax policy, and rental regulations were each adopted to address specific concerns at particular moments in time. Taken together, they now operate as an integrated framework that slows down the pace of construction, limits where housing can be built, and increases costs.
Many of these policies were developed under conditions that differ significantly from today’s environment. The Tenant Opportunity to Purchase Act (TOPA), adopted in 1980 in response to widespread condominium conversions during a period of limited new construction,[13] has since expanded in scope to apply to a broad range of transactions,[14] including recapitalizations of existing affordable housing. This has introduced additional time and uncertainty into routine financial and ownership processes.[15] In the same decade, D.C. enacted rent control. D.C.’s rent control policy originally included mechanisms that allowed housing providers to adjust to rising costs,[16] although some of those mechanisms have been narrowed over time.[17] The economic burden has proven unbearable in some cases: District’s rent-controlled stock has declined from roughly 115,000 units in 1985 to fewer than 80,000 units today.[18]
Other requirements such as Inclusionary Zoning and a range of social and environmental mandates were layered onto the system during a period characterized by low interest rates, stable construction costs, population growth, and access to public financing and tax-abatements.[19] Those economic and demographic conditions supported compliance at the time,[20],[21] but no longer exist today.
The cumulative effect of these policies is a system that is less flexible and more difficult to navigate. Land use rules constrain development across much of the city. Building requirements add costs that can be challenging to absorb, particularly for smaller projects. Permitting processes introduce delay and uncertainty. Rental regulations shape the risk environment for housing providers, with particular burdens on smaller owners of older, naturally affordable buildings. Tax assessments often do not reflect income restrictions, creating a disconnect between liabilities and operating capacity.
In this environment, individual issues can have system-wide consequences. A single delay, cost increase, or regulatory hurdle can alter project feasibility, postpone reinvestment, or shift development decisions elsewhere. Over time, these dynamics affect not only new construction, but also the maintenance and preservation of the existing housing stock.
Rising costs, rising subsidies: The city attempts to mitigate the consequences
Over time, the District has expanded a complex system of housing subsidies to mitigate the effects of regulations and underproduction. Rather than altering the underlying conditions that create housing unaffordability, public programs have grown to offset them, increasing in scale as prices rise.
The Housing Production Trust Fund, the city’s primary financing tool, now supports projects that often exceed market prices by multiples, with some projects surpassing $1 million per unit.[22] Despite this level of investment, production at targeted income levels remains limited, and projects are concentrated in a subset of neighborhoods. Inclusionary Zoning is more symbolic than material, contributing comparatively few units with extended lease-up timelines and administrative processes that delay occupancy. The Low-Income Housing Tax Credit (LIHTC) utilizes federal dollars, but also introduces additional layers of financing complexity and compliance that increase transaction costs. Rental assistance programs, including vouchers and the Local Rent Supplement Program (LRSP), have expanded as rents have risen, though the availability of eligible units has not kept pace. Over time, LRSP costs per voucher have tripled as the program’s goals expanded from rental assistance for working families to the prevention of homelessness. Across programs, administrative factors like inspection timelines, lease-up processes, utility allowances, and payment delays shape outcomes as much as funding levels.
Feedback loops: How scarcity and subsidy reinforce each other
The scarcity–subsidy cycle persists because each component reinforces the others.
- Regulatory constraints limit housing construction and increase operating costs.
- Limited supply increases rents and construction costs.
- Higher costs increase the subsidy required to create affordable units.
- As subsidies expand, they become embedded in expectations and program structures while the underlying conditions remain largely unchanged.
- Structural reform becomes harder, not easier, over time.
One consequence of the scarcity-subsidy cycle is reduced adaptability. Housing production does not respond easily to changes in population or demand. Addressing the needs of lower-income households requires increasing levels of public support. Existing buildings are more difficult to reposition or preserve at reasonable cost. Access to high-opportunity neighborhoods remains limited. Market-rate development, which plays a central role in expanding supply, is concentrated in a relatively small number of locations. Over time, the system becomes more resource-intensive and less responsive.
This dynamic eats into taxpayer funds that could be deployed more effectively, crowding out the city’s other priorities like public safety, transit, education, and basic government services. It also leaves the District vulnerable to economic shocks. As revenue stagnates and federal support declines, subsidy programs become harder to sustain without reducing services.
Why this moment matters
Higher interest rates, elevated construction costs, and slower revenue growth have reduced D.C.’s ability to continually expand subsidy programs. Federal support has become less certain, and competition from other metropolitan areas has increased.[23] These shifts are reflected in permitting activity, which has declined substantially from recent levels.[24]
A more durable path forward depends on improving the system’s ability to produce and preserve housing at lower cost, while directing public resources where they can have the greatest effect. This involves addressing the factors that shape supply, reducing unnecessary costs, and aligning subsidies with outcomes that support the District’s long-term economic and fiscal stability.
Section 3. Structural constraints: How D.C.’s rules manufacture scarcity
The District’s housing outcomes are the product of an accumulation of policies rather than a unified design. Rules governing land use, building codes, environmental performance, utilities, permitting, rental operations, and taxation have been layered onto one another over the years. While each policy may address a real concern, taken together, they form a system that makes it more difficult and expensive to build and operate housing, increasing housing costs at all income levels.[25]
When zoning limits density, approval timelines stretch from months into years, and income is constrained while operating costs continue to rise, production becomes less responsive to demand.[26] Prices then reflect the city’s desirability as well as the gap between how much housing is needed and how much is allowed to be delivered. Persistent underproduction pushes rents and home prices ahead of income growth, and unaffordability becomes a structural condition rather than a temporary imbalance.
Uncertainty and high costs shift housing production to jurisdictions with fewer constraints.[27] That relocation increases commuting distances, raises transportation costs, and loosens the connection between where people live and where they work.[28] The result is not just less housing in D.C., but less housing in the neighborhoods where it is most needed. A more coordinated approach that is grounded in clear cost-benefit analysis and explicit consideration of housing impacts would allow the District to pursue its goals (environmental, social, workforce, etc.) while producing and preserving needed housing.
The following section examines each of these constraints, explaining how they operate, why they matter, and how their combined effects shape the District’s housing landscape.
Land use, zoning, and historic preservation
Zoning is one of the District’s most powerful housing policy tools and one of its most restrictive. It limits what can be built, shaping the physical form of the city as well as who can live in it, where growth occurs, and how neighborhoods evolve.[29] Much of the current zoning framework reflects a land-use pattern established in the early to mid-20th century, when the city was smaller, less expensive, and less reliant on renters and new in-migration.[30] Today, that framework is largely fixed in place and cannot adjust when population, household size, or income patterns change.[31]
Single-family dominance
Roughly three-quarters of residential lots are restricted to low-density, single-family use,[32] and in most of these areas, the ability to add new units is limited. Of the approximately 94,000 lots zoned for single-family homes, only about 28,000 have any remaining capacity,[33] and much of that supports modest expansions rather than meaningful increases in density. As a result, growth is limited to where it is clearly permitted and directed away from where it would be most effective and desired.
Growth concentrated by policy, not demand
Constraints extend well beyond single-family zoning. Across the city, tight zoning envelopes[34] combined with reliance on Planned Unit Developments[35] and map amendments[36] to enable additional density means that a significant share of allowable floor area[37] and unit capacity goes unrealized. As a result, new housing is concentrated in the limited set of locations where zoning permits it including NoMa, Navy Yard, the Wharf, Anacostia, and selected commercial corridors. These areas absorb a disproportionate share of growth, while many high-opportunity neighborhoods change little over time.
A zoning system built for conflict
The District’s zoning process is structurally adversarial. Proceedings before the Zoning Commission (ZC) and the Board of Zoning Adjustment (BZA)[38] assign participants to defined roles of applicant and opponent, shaping outcomes through contest rather than through a consistent, citywide goal. In that setting, a relatively small number of highly engaged stakeholders can exert significant influence over projects whose primary beneficiaries—future residents—are not present.
This structure extends beyond large or controversial developments. Smaller projects that would otherwise be routine such as alley dwellings, modest additions, internal reconfigurations, or minor code deviations, frequently require full BZA review. The process introduces legal costs, delay, and uncertainty, even when the underlying impacts are limited. Administrative pathways for low-impact changes are narrow, so routine proposals can become sites of dispute.
At the larger scale, the pattern is more visible. Projects such as 901 Monroe,[39] Park View, and the Reservoir District (formerly McMillan) illustrate how appeals and late-stage opposition can delay, reduce, or halt development for extended periods. Since 2015, 89 appeals have sought to overturn zoning decisions. Only nine ultimately succeed,[40] but the process itself adds an average of 450 days to development timelines.[41] These appeals represent 17,219 units, 2,823 of which were affordable.[42] That delay and litigation risk has now been incorporated into development decisions, reducing feasibility for moderate- and high-density, transit-oriented housing projects that the city needs.[43]
Historic preservation and tree protections as de facto downzoning
Place-based rules such as historic preservation and tree-canopy protections are intended to protect the city’s character and environmental assets. In practice, however, they layer additional constraints on housing with effects that are not always evaluated in the aggregate.
Historic districts now cover a substantial share of the city[44] and frequently impose design requirements, height limits, and density restrictions that reduce the number of units that can be delivered on otherwise suitable sites.[45],[46] For example, historic district imposed height limits can remove entire floors of potential housing, altering project feasibility and narrowing the range of viable development. Historic designation can also increase the cost and complexity of both renovation and new construction. Projects typically face more prescriptive standards—not only for façades, but across entire structures—along with longer review timelines and additional approval steps. Higher material and labor requirements, combined with extended timelines, introduce uncertainty, can discourage investment or reduce project scale, and deepen the divide between where housing demand is strongest and where additional supply can be delivered.
Tree protection rules operate in a similar way. The Urban Forest Preservation framework[47] places strict limits on the removal of mature trees, particularly those classified as “heritage” trees, while imposing mitigation requirements for others.[48] Compliance is closely tied to the permitting process and often requires detailed Tree Preservation Plans early in project design. On larger sites, these requirements can increase costs and constrain site layouts. On smaller parcels, especially infill or alley lots, the presence of a single protected tree (and its root zone) can effectively determine whether development is possible at all.
Historic districts and tree protections are just two examples that illustrate how multiple policy objectives such as preservation, environmental protection, and neighborhood stability intersect within the housing system. Each operates with its own logic, but in combination they create a layered approval process that is difficult to navigate and hard to predict. The result is a system of accumulated constraints in which housing projects take longer, cost more, and are less likely to proceed. Fewer homes are built, and those that are built are more expensive, resulting in more displacement and less inclusive growth.[49]
Building codes and fire safety
Building codes are central to protecting health and safety.[50] In the District, however, locally adopted amendments layered onto already detailed model codes[51] have produced a system that can elevate costs without a clear, proportional risk reduction. The practical effect is to make it more difficult to build new housing or adapt existing structures, particularly for moderate-scale multifamily projects and office-to-residential conversions.
D.C.’s construction codes draw from national model standards developed by organizations such as the International Code Council (ICC), American Society of Heating, Refrigerating and Air-Conditioning Engineers (ASHRAE), and the National Fire Protection Association (NFPA). Over time, the District has added its own code amendments requiring additional accessibility, fire protection, energy performance, and green building standards.[52] Because these rules sit on top of another, designers and builders must work across multiple overlapping documents. This process increases design costs, lengthens approvals, and creates more opportunities for delay.[53]
D.C. Code imposes restrictions far beyond national standards
The District’s residential construction requirements exceed those applied nationally and in other localities. For example, local rules require natural light in all bedrooms and living spaces, operable windows in all bedrooms, and significant reliance on natural ventilation.[54] These provisions reflect earlier building practices[55] and can make adaptive reuse more difficult, particularly office-to-residential conversion, as many existing structures cannot meet requirements without substantial structural modification.[56]
Accessibility standards follow a similar pattern. In multifamily buildings with more than ten units, at least 15 percent of the units must meet Type A accessibility standards, accommodating wheelchair use.[57],[58] This exceeds both federal requirements for subsidized housing (5 percent)[59] and the baseline levels in the ICC code (2 percent).[60] This makes D.C. one of the most demanding jurisdictions for accessibility in new multifamily construction, limiting unit configurations and adding costs without any demonstration of additional need.[61]
Some accessibility requirements end up limiting, not expanding access. For example, elevator construction and installation are several times costlier in the United States compared to many other countries, as U.S. code requires much larger cabins that limit the use of equipment designed for global markets.[62] This is further complicated by the dearth of skilled labor, which gives unions additional power to negotiate for complicated collective bargaining rules that limit preassembly and prefabrication available elsewhere in the world.[63] This leaves many low-rise and smaller buildings without elevators and inaccessible to residents with disabilities or walking difficulties. Other jurisdictions are considering changes to elevator requirements including allowing for smaller and lower cost elevators in midrise buildings,[64] and even taking measures to reduce costs for larger elevators in high-rise buildings.[65]
Fire safety provisions have alternatives that can reduce risk at lower cost
Sprinklers are required in almost all residential units, but for many small or detached buildings there may be alternative mechanisms to reduce fire risk. Overly aggressive sprinkler requirements in smaller multifamily buildings can introduce significant costs and operational risks including water damage and insurance complications. For certain building types such as small multifamily structures or basement units, it is not always clear that full sprinkler systems represent the most efficient approach to risk reduction. Alternatives such as improved fire-resistant materials, induction cooking, or automatic closing doors can achieve comparable safety outcomes at lower cost.
Similarly, D.C. multifamily buildings are required to have two staircases, impacting building form and feasibility, when single-stair buildings may achieve the same safety outcomes. Many high-income countries safely allow single-stair designs for mid-rise buildings (4 to 8 stories), relying on other safety features to manage risk.[66] In the District, the two-stair requirement increases building size and cost, which can limit the viability of smaller-scale multifamily projects, particularly in areas where zoning already constrains height and density.[67]
Taken together, these provisions reflect a broader pattern. Additional safety measures have been added to building codes without systematic assessment of their impact. The result is a system that prioritizes incremental risk reduction, often at increasing marginal cost. Fewer projects meet feasibility thresholds, and those that do tend to be larger and more expensive.
Environmental, energy, and utility regulations
For more than a decade, the District has pursued an expansive environmental agenda that combines green building requirements with increasingly ambitious climate and energy targets. These policies reflect objectives of sustainability, resilience, and emissions reduction.[68] Over time, however, they have also introduced additional layers of cost and complexity into the housing system. Adopted incrementally and often without coordination, these requirements now operate as a composite framework that is difficult to navigate and costly to implement. Their cumulative effects on housing production and operation have received little attention.
BEPS implementation destabilizes operations in existing housing
The Building Energy Performance Standards (BEPS)[69] establishes minimum energy performance thresholds for existing buildings, requiring owners to benchmark energy use and undertake upgrades if those thresholds are not met.[70] The program started its first compliance cycle in 2021,[71] using benchmarking data and detailed regulations to define which buildings are covered, and what owners must do to comply.[72],[73] BEPS now covers a substantial share of the District’s building stock, and a significant portion of both residential and commercial properties fail current standards.[74]
As implementation has moved from rulemaking to enforcement, several practical constraints have emerged. Many required retrofits involve substantial upfront costs and limited financing options,[75] particularly for rent-restricted or older buildings where operating margins are already thin. Some required improvements cannot realistically be done while buildings are occupied. Penalties, set at $10 per square foot per year, are likely to be destabilizing for older or affordable housing (naturally occurring and subsidized) where margins are already limited. In short, the policy assumes capital and flexibility that many owners simply do not have.
Performance is measured by factors that extend beyond owner control, including tenant behavior, occupancy patterns, and certain design features. Buildings with uses that are energy-intensive by nature, such as museums, or with architectural elements such as large atria, may be out of compliance, even when their underlying systems perform efficiently.[76] In these cases, compliance reflects not only building quality, but also how the building is used.[77]
More broadly, the framework evaluates performance at the individual building level, with less consideration for system-wide factors such as density, location efficiency, and the environmental benefits of maintaining existing structures. In a dense urban environment, these characteristics already contribute to lower per capita energy use.[78] Focusing narrowly on building-level metrics can obscure these broader efficiencies, and may work at cross purposes with other policy objectives, including housing supply and affordability.
Electrification mandates and utility regulations undermine affordable housing
Electrification requirements create similar challenges. Converting buildings to all-electric systems (either because of BEPS or during a substantial renovation) often requires space, access to capital, and electrical capacity that older buildings do not have. At the same time, electricity distribution charges, capacity costs, and renewable energy surcharges have increased, raising operating expenses. In some affordable properties, these utility costs consume more than half of the operating budgets,[79] making additional mandates difficult to absorb.
Public space and utility requirements use private funds for public projects
For new construction and major rehabilitation projects, utility and public space rules add costs that are not always apparent on the outset. Projects are frequently burdened with public infrastructure work outside of construction site, such as replacing water and sewer line connections, rebuilding sidewalks, installing new streetlights, or modifying alleys. These requirements can involve large deposits, long review periods, and uncertain refund processes, particularly in dealings with DC Water and the District of Columbia Department of Transportation (DDOT).
Projects that alter water or sewer connections must post inspection deposits with DC Water and pay for excavation and full restoration of public space, with refunds issued only after written request and subject to forfeiture if not claimed in time.[80] DDOT’s excavation rules similarly require permittees to restore streets and sidewalks at their own expense or allow the District to deduct restoration costs and penalties from posted deposits. While this is a reasonable expectation, refunds can take months, and many deposits are not returned and quietly become forfeited.[81] These amounts are small, hidden balance-sheet items for the city, but are meaningful for individual projects, adding to the cost and unpredictability of building in the District.
Tax assessments
The District’s tax assessment processes operate independently of its affordability goals and can create financial burdens for affordable housing providers. Assessed values generally do not reflect affordability covenants, even when those covenants directly limit rental income. The disconnect is modest in lower-cost markets, where restricted rents may still align with prevailing prices. However, it becomes more consequential in higher-cost areas, where income limits materially constrain revenue and affect project viability.
Tax assessments separated from regulated income
Properties with affordability restrictions are frequently assessed as if they were market-rate assets, without accounting for rent ceilings or operating constraints. This is particularly evident in preservation transactions, where mission-driven buyers acquire market-rate buildings and impose long-term affordability. If assessments continue to assume market-rate income, tax liabilities can exceed what the property can reasonably support. This financial strain produces tighter operating margins, reduced refinancing capacity, and deferred maintenance—factors that are especially binding for smaller owners and nonprofit providers.
Tax benefits reward ownership structure, not affordability
Tax policy also differentiates by ownership structure in ways that may not reflect the underlying public benefit. Nonprofit owners may qualify for exemptions unavailable to mission-oriented for-profit entities, even when both provide comparable income-restricted housing. This narrows the pool of potential operators and can complicate preservation efforts as the city relies more on mixed financing models. Aligning assessments and tax treatment with actual operating revenue becomes more important as preservation plays a larger role in the District’s housing strategy.
Landlord–tenant framework, courts, and program administration
The District’s tenant protection system is among the most comprehensive in the country. Over time, long-standing policies such as rent control, TOPA, and strong eviction defenses have been expanded, with additional measures adopted during and after the pandemic.[82] These interventions addressed an immediate crisis, but they also introduced new operational pressures. Arrears accumulated, costs rose, and risks increased, particularly for providers of subsidized and naturally affordable housing with limited margins. Tenants who kept up with their rents saw the quality of their buildings decline, and tenants who may have benefitted from some of these protections in the short run, found their credit histories permanently marred.
COVID-era policies and behavioral shifts
A stable housing system depends on both tenant protections and predictable rent payment. In the District, policies adopted during the COVID-19 pandemic have extended eviction timelines and weakened that balance.[83] Cases that once resolved in months can now take years, with additional procedural steps and limited court capacity contributing to delays.[84] During that time, unpaid rent accumulated beyond recoverable levels,[85] and building operations absorbed the loss. These financial losses reduce building quality and are felt by all tenants through higher rents, reduced investment, or deferred maintenance.
Extended periods of nonpayment combined with the prospect of future relief, contributed to persistent arrears[86] and weaker finances in naturally occurring affordable housing and subsidized buildings. Additionally, housing providers report that eviction disputes can trigger overlapping investigations or inspections, sometimes delaying resolution for extended periods.[87] Even when issues are ultimately resolved, the process introduces legal, administrative, and compliance costs that smaller operators are less able to absorb. In response, some investors reduced exposure to affordable housing, and some operators sold higher-risk properties or shut down operations.[88] A smaller pool of willing owners complicates provision of affordable housing, particularly in neighborhoods where affordability pressures are most acute.
Vouchers have long approval processes and outdated formulas
Voucher and permanent supportive housing (PSH) programs are central to the District’s affordable housing strategy, but their administration delays payment, lease up times, and often lacks wrap-around services. Providers report waiting 60 to 75 days for lease approvals and up to six or seven months for initial payments. These delays can strain cash flow and, in some cases, threaten building stability.[89] In addition, PSH placements can bring high-need residents into mixed-income buildings without commensurate on-site services, creating operational challenges that some providers are not equipped to absorb.[90]
Rent limits and utility allowance formulas for vouchers are often based on outdated assumptions, creating gaps between allowable rents and actual operating costs. This is especially evident in newer, energy-efficient buildings, where standardized utility allowances exceed real utility bills, effectively reducing collectible rent and penalizing providers for meeting the District’s energy reduction goals. Other federal housing programs permit property-specific utility analyses to reflect actual costs, but these tools are not used in the D.C. Housing Authority’s administration of vouchers. Over time, these misalignments make participation less viable for housing providers and limit the range of units available to voucher holders.
Agency fragmentation and limited court capacity
All of this operates within a system with limited court and agency capacity, where fragmented authority and delay shapes outcomes. Judicial vacancies slow case processing, and in time rental arrears can reach untenable levels.[91][92] Responsibilities are dispersed across multiple agencies, making coordination difficult even in straightforward cases.
Housing agencies act with clear public purposes, but the structure of the system can work against timely resolution. Overlapping reviews, delayed hearings, and multiple avenues for appeal allow disputes to continue for months, even in straightforward cases. Involved agencies include Department of Housing and Community Development (DHCD), Department of Buildings (DOB), D.C. Housing Authority (DCHA), Department of Human Services (DHS), Office of the Tenant Advocate (OTA), and Office of the Attorney General (OAG), each with its own mandate, timeline, and enforcement tools.
In some instances, procedural tools such as complaints, inspections, and filings can be used strategically to extend timelines.
What emerges are processes that are slow, uncertain, and costly to navigate, particularly for smaller housing providers and for buildings already operating with thin margins. Over time, higher operating risk and administrative burden weaken incentives to invest in the District’s rental housing stock.
Landlord sentiments
The tone of the policy environment also shapes outcomes. Beyond formal rules, reputation, rhetoric, and political signals influence whether housing providers see the District as a place to operate in partnership with government or as one where they are assumed to be at fault. While bad actors exist, they are rare. Many providers who have stabilized distressed properties operate under tight constraints and face a narrative that does not fully reflect those conditions; feeling unfairly vilified as “slumlords.” That framing can obscure how policy affects cash flow, operating income, and the ability to reinvest.
Much of the District’s affordable housing is owned by small operators, thinly capitalized partnerships, or mission-driven entities. Their financial position is sensitive to interruptions in rent collection, delays in subsidy payments, and rising operating costs. Maintaining safe and habitable buildings depends on predictable revenue, access to financing, and a regulatory environment that is stable enough to plan against. When the policy environment signals high transaction costs, elevated enforcement risk, and limited institutional support, fewer providers are willing to enter or remain in the market. Over time, that reduces the availability of capital and operating expertise needed to maintain existing housing and expand supply.
Permitting, interagency coordination, and agency capacity
Permitting[93] is a central determinant of how much housing the District produces. The underlying rules are not unusually restrictive, but the process is slow, fragmented, and difficult to predict. Every project, regardless of size, must pass through multiple reviews before construction can begin. When the system functions well, it provides clarity and safeguards. When it does not, timelines stretch, delays add cost, financing becomes more complex, and fewer projects reach completion. For affordable and moderate-scale development, timing often determines feasibility.
Recent reforms, including digital permitting, have improved transparency, but core constraints remain. Backlogs, staffing limitations, and repeated rounds of review continue to extend timelines, particularly for projects that involve multiple agencies. Without sustained improvements in capacity, coordination, and procedural clarity, permitting will continue to negatively affect housing production.
Too many agencies, too few clear lines of authority
A typical project requires approvals from multiple agencies, each operating with its own standards and timelines. Approvals must come from DOB, but also Department of Energy and Environment (DOEE), DC Department of Transportation (DDOT), DC Water, Fire and Emergency Medical Services Department (FEMS), Washington Metropolitan Area Transit Authority (WMATA), the Public Space Committee, historic preservation bodies, and more. Applicants may be required to revise plans multiple times, including in response to issues that emerge late in the process, after they have been previously approved. In some cases, such as with the Public Space Committee, decisions rely on internal practices rather than clearly defined criteria, making outcomes difficult to anticipate.
More coordinated approaches exist but are not scaled to need. Accelerated Plan Review (“Velocity”) [94] demonstrates the benefits of coordinated review: when agencies review projects together, issues resolve quickly. However, this process however is costly and only financially feasible for large well-capitalized projects.[95] The standard process remains fragmented and unpredictable. Applicants have no visibility into which agency is delaying a project and no reliable timeline for resolution.
Layered approvals for even small projects
The system relies on multiple, overlapping approvals without a single point of coordination. Building permits, public space permits, occupancy approvals, transportation clearances, licensing requirements, and registrations are administered separately, each with its own process and timeline. Even modest rehabilitation projects must navigate this sequence before work can begin.
Process rules rarely reflect any cost-benefit discipline. New requirements and steps are added ad hoc, without systematically testing the impact of their procedures. Each additional step introduces time and uncertainty. Larger developers may absorb these risks when markets are strong, but smaller builders and nonprofit providers often cannot at any point. The result is project delays, increased costs, and, overall, less project starts due to uncertainty.
Accessory Dwelling Units and basement apartments
Accessory dwelling units (ADUs)[96] offer a practical way to add housing in established neighborhoods. They are typically small, relatively low-cost, and often are naturally affordable without subsidies. In the District, these units are broadly permitted in principle, but difficult to deliver in practice. Small additions are often subject to processes and standards designed for much larger projects, limiting the kind of incremental growth these units are meant to provide.
Uneven treatment across residential zones
The same ADU can face different standards depending on underlying zoning, even for identical projects. On lots zoned for multiple units, modest additions such as a backyard cottage or in-law suite can trigger full multifamily code requirements. In some cases, accessory units require sprinkler systems, utility upgrades, fire-rated assemblies, and more complex structural or egress solutions, even when the physical scope is limited. On single-family lots, similar projects may proceed under less demanding rules. This uneven treatment raises costs and introduces uncertainty without a clear distinction in impact.
Administrative burdens discourage participation
The permitting process adds another layer of difficulty. Homeowners must navigate multiple agencies with limited guidance, and timelines can be long and uncertain. The use of the District’s Residential Accessory Apartment Program (RAAP),[97] offering grants for ADU development, illustrates this dynamic. Initial demand was strong, but only two percent of projects ultimately moved through permitting and construction.[98] Many were screened out by zoning or permitting obstacles, and every project that advanced encountered stop-work orders along the way.[99]
High costs and a shallow lending market
ADU construction costs in the District are two to three times higher than in other U.S. cities, especially for detached, ground-up ADUs.[100] At the same time, financing options remain limited. While federal underwriting guidelines from HUD, Fannie Mae, and Freddie Mac increasingly recognize ADU rental income,[101], [102] these products are not widely available in practice, and many lenders apply additional constraints.[103]
As a result, most homeowners rely on conventional financing that does not account for future rental income, raising the effective cost of entry. Local program design has, at times, compounded these challenges by combining multiple objectives such as affordability requirements and compliance obligations within a single initiative.[104] For many homeowners, the combination of lower allowable rents and higher administrative burden reduces the incentive to participate.
ADUs are not a comprehensive solution to the District’s housing needs, but they are one of the few forms of supply that can be added incrementally within existing neighborhoods. Their impact depends less on formal legality and more on whether they are straightforward to build and finance. Under current conditions, policy signals support their development, while code requirements, permitting, and financing make them difficult to create.
Current housing policy undermines D.C.’s structural advantages
In the District, housing outcomes are shaped less by any single decision than by the accumulation of many small ones. Projects rarely fail for one reason. More often, feasibility is eroded incrementally through added time, layered requirements, procedural uncertainty, and rising operating costs. Developers and housing providers describe this dynamic as “death by a thousand cuts”: each individual step may be manageable, but together they make it harder to build and operate housing in the District.
Investment responds to predictability. Projects are easier to finance where rules are clear, timelines are reliable, and costs can be estimated with some confidence. In the District, uncertainty about approvals, future regulatory changes, or operating conditions becomes part of the underwriting. When those risks are difficult to price, capital adjusts. Some projects scale back; others do not move forward; some investment shifts to jurisdictions where processes are more consistent.
These dynamics are particularly consequential given the District’s underlying strengths. Few cities combine a dense transit network, a walkable core, and sustained demand for urban living. In principle, these are strong conditions for housing growth in central, well-connected neighborhoods. In practice, a growing share of new supply is delivered elsewhere in the region, while the District retains the fixed costs of infrastructure and employment concentration without capturing proportional housing and tax growth.
The effects appear across the housing lifecycle. Fewer projects meet feasibility thresholds. Those that proceed often reflect tradeoffs such as reduced density, altered design, or delayed delivery. Existing buildings face rising costs and more limited capacity to reinvest, particularly in parts of the city where rents are naturally affordable. Over time, this affects both the quality of the housing stock and the stability of ownership.
A housing system cannot function well when uncertainty, delay, and high transaction costs are built in every step. Constraints at each stage of the housing lifecycle – from land use, design, permitting, financing, construction, and operations – compound to increase the cost of building and maintaining housing. The same frictions that limit supply and increase operating costs also increase the cost of subsidy programs, concentrate development in a small number of locations, and narrow the pool of capital and operators willing to participate. Together, these factors limit future affordability in the District.
Section 4. Expensive bandaids: The District’s subsidy architecture and its limits
In response to a housing shortage shaped in large part by its own policies, the District has built an extensive system of programs to subsidize housing prices including Housing Production Trust Fund (HPTF), Inclusionary Zoning (IZ), Planned Unit Developments (PUDs), Housing Choice Vouchers (HCV), Local Rent Supplement Program (LRSP), Low-Income Housing Tax Credits (LIHTC), tax abatements, and affordable dwelling units.[105] Public investment is substantial, exceeding $1 billion annually, with about 75 percent of funds devoted to direct subsidies.[106] This is a broad and costly toolkit, operating within the same regulatory environment that limits supply and drives up costs. As a result, these programs offset the effects of scarcity rather than change the conditions that produce it.
This section examines the District’s principal subsidy programs and considers their ability to deliver three core objectives: more affordable housing, across all neighborhoods, at lowest subsidy cost.[107]
The Housing Production Trust Fund
Housing Production Trust Fund (HPTF)[108] is the District’s flagship investment in affordable housing. It has financed and preserved thousands of units[109] and remains central to the city’s housing strategy. At the same time, its performance increasingly reflects the constraints of the broader system in which it operates.
Per-unit costs have risen to levels that are difficult to sustain. Full development costs of HPTF funded projects are frequently two to four times as much as market-rate development.[110] These high costs reflect elevated financing and legal transaction costs driven by bureaucratic rules that govern the program. Costs are also driven by policies that deliver scarcity: when rules and regulations raise the cost of building, public dollars must rise in parallel.
Geographic distribution presents a second constraint. Most HPTF-supported units has been built in areas where land is less expensive and approvals are more predictable. As a result, production has been concentrated in a limited number of neighborhoods, particularly in Wards 7 and 8.[111] This reinforces patterns of segregation and concentrates poverty, outcomes that run counter to the program’s equity objectives.
Income targets for low-income housing without operating support highlights a third limitation. Only 18 percent of HPTF-supported units serve extremely low-income households,[112] far short of the statutory requirement that at least half of HPTF resources support this group.[113] HPTF primarily offers capital subsidies for housing production. However, capital subsidies alone are not sufficient to support these units over time as operating costs exceed what restricted rents can cover.[114] Without sustained operating subsidies, deep affordability remains difficult to achieve.
Administrative capacity also reduces program effectiveness. While underwriting and project selection have improved, delays in lease-up, inspection, and compliance processes reduce the effective value of each subsidy dollar. Even when completed, units may sit vacant while approvals are finalized, limiting the program’s immediate impact.
Production and preservation subsidies from the HPTF are essential tools to create affordable housing across the District. The success of these programs, however, will depend on funding as much as on how they could be restructured to reduce development costs, expand feasible locations, and streamline delivery.
Inclusionary Zoning
Inclusionary Zoning (IZ)[115] is designed to capture some of the value created by new development and convert it into affordable units. In exchange for additional density, developers are required to set aside a portion of units at below-market rents. Conceptually, this approach appears costless to the public sector. In practice, it reallocates costs within the project and, often, across the broader market.
IZ increases market rate rents and construction costs as below-market units must be offset through higher rents on market-rate units, adjustments in land prices, thinner developer margins, or additional subsidy.[116] In stronger markets, projects can absorb these tradeoffs, often by shifting toward higher-end building types or larger buildings. In weaker markets, the same requirements can determine whether a project proceeds at all. Over time, this contributes to a development pattern that favors projects able to carry higher costs, while more moderate-scale or moderately priced housing becomes harder to deliver.
Operationally, IZ rent and utility rules limit financial feasibility of projects. DHCD’s rent caps are set significantly below HUD (LIHTC and Housing Choice Vouchers) levels.[117] The program does not allow energy modeling to determine appropriate utility allowances (higher than actual consumption), even though IZ units are in new buildings constructed under strict energy efficiency rules.[118] This means that, in some cases, rents do not fully cover operating costs as expenses rise.[119]
Lease-up processes for IZ units are slowed by program administration. Tenant eligibility and placement are centralized at DHCD and require an income verification process burdened by paperwork, repeated document requests, and unclear timelines that can leave units vacant for weeks, months, or even years even when much simpler alternatives exist.[120] For housing providers, the combination of lower rents and higher vacancy risk lowers both cash flow and project viability. For the rest of the tenants in the same building, this results in higher rents.
IZ achieves a symbolic political purpose, but its role as an affordability tool is limited. Its contribution to the District’s subsidized housing stock remains modest and is tightly linked to the pace and location of market-rate development. Over 17 years, IZ has produced roughly 2,000 to 4,000 units,[121] a small share relative to what would be required to meaningfully affect rent growth.
Because the location of new multifamily construction (and thus IZ) is determined by zoning, production is concentrated in areas where higher density is permitted, while large parts of the city see little to no development.[122] This creates a narrow geographic footprint, often located in higher-cost or transitioning neighborhoods where added costs are reflected in higher market rents and can accelerate demographic changes.[123]
IZ production also rises and falls with the market. Units are delivered only when new development proceeds; when projects slow, so does IZ output. In that sense, its performance is inseparable from the strength and geography of market-rate activity, and it inherits the same structural constraints that shape the broader housing system.
Housing Choice Vouchers
Federally funded Housing Choice Vouchers (HCVs) are designed to expand access to housing by allowing low-income households to rent in the private market. Households cover a portion of rent, and the DC Housing Authority (the District’s local administrator) covers the remainder.[124] In principle, this allows families to choose neighborhoods with better access to jobs, schools, and services.
In practice, vouchers work best when paired with sufficient housing supply. In tight markets, their effectiveness is constrained. Payment standards often lag behind market rents, particularly in higher-cost neighborhoods, limiting where vouchers can be used. More than half the vouchers in the District are concentrated in Wards 7 and 8, while only six percent of the vouchers are used in neighborhoods west of 16th St.[125]
To expand access, the District raised payment standards to levels well above regional benchmarks to 187 percent of the DC-VA-MD area’s fair market rents.[126] This successfully allowed voucher holders to obtain housing in high opportunity neighborhoods but also lead to high costs and unexpected interactions with other housing programs.
In neighborhoods with limited available units, particularly in Wards 1 and 3, residents have raised concerns that voucher use can occupy too high a share of rent-controlled units. Because voucher payment standards are often set above rent-control limits,[127] landlords may have an incentive to rent to voucher holders, effectively bypassing rent restrictions.[128] This can reduce availability for other tenants and alter the composition of buildings. In some cases, this has introduced residents with higher service needs to buildings without corresponding on-site support, creating operational challenges for property managers and tension among tenants.[129]
The HCV program is oversubscribed, with a waitlist of around 17,000 people,[130],[131] with wait times that stretch into decades.[132] Despite this high demand, administrative bottlenecks have caused vouchers to go unused. Publicly available information shows that in 2024, DC had approximately 11,500 HCVs leased,[133] which is about 71 percent of the city’s allocation.[134],[135] Vouchers may go unused because it can take four months or more to process an application and over six months to receive payment.[136] For landlords, delayed approvals and payments carry real financial risk, particularly in smaller buildings. For voucher holders, delays can mean losing available units in competitive markets.
Taken together, these factors limit the program’s reach. Vouchers remain an important tool for supporting affordability, but their effectiveness depends on the conditions in which they operate: housing availability, administrative efficiency, and alignment with local market dynamics.
Local Rent Supplement Program
The Local Rent Supplement Program (LRSP) is the District’s locally funded tool for supporting extremely low-income households who are not fully served by federal vouchers. Like the Housing Choice Voucher program, it caps tenant contributions at 30 percent of income and covers the remaining rent up to a defined standard.[137] LRSP operates through tenant-based, project-based, and sponsor-based models, often paired with supportive services and layered onto other financing tools such as HPTF and LIHTC.
In eight years, LRSP per unit costs have tripled, requiring substantially more public investment. Per-unit subsidy costs have increased from roughly $8,000 in 2016 to nearly $24,000 by 2023, a threefold rise in real terms.[138] Over the same period, rent growth was far more modest at 36 percent across all U.S. cities.[139] This cost increase reflects rising local housing costs, limited income growth among the households the program serves, and a shift toward households experiencing homelessness.
From the outset, LRSP was designed to scale gradually,[140] but over time its uses have changed. Growth slowed during the Great Recession, then accelerated through 2019,[141] and just before the pandemic, LRSP had become the city’s central platform both for ending homelessness and for making deeply affordable HPTF projects pencil out.[142], [143] During the Covid-19 pandemic, federal relief temporarily expanded fiscal capacity. By 2024, LRSP funding nearly doubled[144] even though recurring local tax revenue grew by only 17 percent.[145] LRSP became the delivery system for multiple agendas: Permanent Supportive Housing, Targeted Affordable Housing,[146] and specialized set-asides for returning citizens, LGBTQ+ youth, and other subgroups.[147]
Structurally, LRSP functions less like a discretionary program and more like an ongoing commitment. Tenant-based vouchers create expectations of continued support, while project- and sponsor-based subsidies are embedded in financing agreements and building operations. Reducing the program would require unwinding these commitments, with implications for households, property finances, and broader system stability.
LRSP illustrates how subsidy-based approaches expand when housing supply remains constrained. As rents rise or incomes stagnate, the cost of subsidies increases and the program absorbs additional responsibilities. The deeper problem is that LRSP has become a patch for a self-imposed housing shortage. The District has, in effect, built an open-ended subsidy system that purchases affordability year by year, rather than lowering the underlying cost of producing and operating housing. Unless those fundamentals change, LRSP will provide real benefits to the households it reaches, but at a growing cost the city cannot easily control and, once granted, cannot responsibly unwind.
Low Income Housing Tax Credit
The federal Low-Income Housing Tax Credit (LIHTC) is the primary financing tool for subsidized housing in the United States.[148] It brings federal capital into local projects and has supported the creation of more than 24,000 units in the District.[149] LIHTC properties also perform well as assets, with low foreclosure rates, and the program remains attractive to investors[150] including banks seeking to meet Community Reinvestment Act (CRA) obligations.
At the same time, the LIHTC model is complex and costly to deliver. Credits must be allocated, syndicated, and monetized through a multi-step process involving developers, investors, and intermediaries.[151] This structure introduces significant legal and transaction costs, and in practice, total development costs can double those of market-rate construction.[152] While the program limits public-sector risk because credits are realized only after projects are built and occupied, the financial structure increases development costs by distributing a substantial share of value to participants in the transaction process.[153] Additionally, high land costs and restrictive zoning limit where LIHTC projects are feasible, leading to concentration in lower-cost neighborhoods.[154] Over time, this pattern mirrors the same geographic limitations seen in other subsidy programs. Finally, a growing share of the LIHTC portfolio also faces preservation challenges. As properties age, capital needs can exceed available reserves, and recapitalization requires complex financing structures that compete with new production for limited subsidy resources.
PUDs and public benefit negotiations
Planned Unit Developments (PUDs) were intended to trade additional allowed density for public benefits. When they worked, PUDs greatly increased supply of affordable housing: between 2010 and 2022, approved PUD projects included commitments for 8,826 affordable units.[155]
However, legal challenges, long delays, and administrative hurdles have reduced investor and developer interest in PUDs and applications have declined. Since 2015, dozens of appeals have been filed to overturn zoning decisions. Only a small share have succeeded,[156] but even unsuccessful cases have added delays of over a year on average.[157] Developers are less likely to pursue PUDs,[158] defaulting to what is permitted by right even when additional density would otherwise be feasible. Over time, this reduces the role of PUDs as a tool for unlocking housing and leaves potential supply of market rate and affordable units unrealized.
What the subsidized-scarcity architecture cannot do
Together, these programs form a dense and well-intentioned subsidy infrastructure. They also share a common set of constraints:
- They operate within, rather than change, the costs associated with housing scarcity.
- They become more expensive as land remains restricted and construction costs rise.
- They concentrate development where projects are feasible under current rules, not necessarily where opportunity is greatest.
- They depend on administrative systems that are already stretched thin.
- They require sustained public funding at high levels that compete with other priorities like education, transit, and public safety.
Across these tools, a consistent pattern emerges: affordability is purchased through increasing levels of subsidies rather than produced through market expansion. Capital subsidies, vouchers, and income-restricted units attempt to mitigate the economic effects of restricted supply. However, even as public spending on housing affordability programs increases, residents needs are not fully met and costs continue to escalate.
Housing subsidies provide essential support to households who would otherwise be priced out, but they function as a response to scarcity, not a resolution of it. Without changes that allow more housing to be built across more of the city and at lower cost, subsidy need will continue to increase without changing overall affordability levels.
Section 5. The housing we built: Seven stylized facts about the District’s housing stock
The District’s housing stock reflects a history of policy choices. Land use rules, financing structures, regulatory layers, and administrative practices have, over time, shaped what gets built, where it is allowed, and who it serves. What emerges is a system in which housing is scarce in some places, concentrated in others, and segmented across regulatory lines.
D.C.’s housing production patterns can be summarized in seven stylized facts:
# 1: The District’s housing stock is small for a high-demand city.
The District has roughly 349,000 housing units across about 118,000 residential buildings, a modest supply for a renter-majority city with strong and persistent demand. The geographic distribution of these units reveals the city’s high percentage of single-family zoning. Apartment units account for about 41 percent of housing but are concentrated in just 3 percent of buildings. Single-family homes make up 27 percent of units but occupy roughly 80 percent of residential buildings.[159] Most of the city’s land is reserved for low-density use, while a few neighborhoods accommodate the majority of renters.[160]
#2: The city experienced four decades of near-zero housing production.
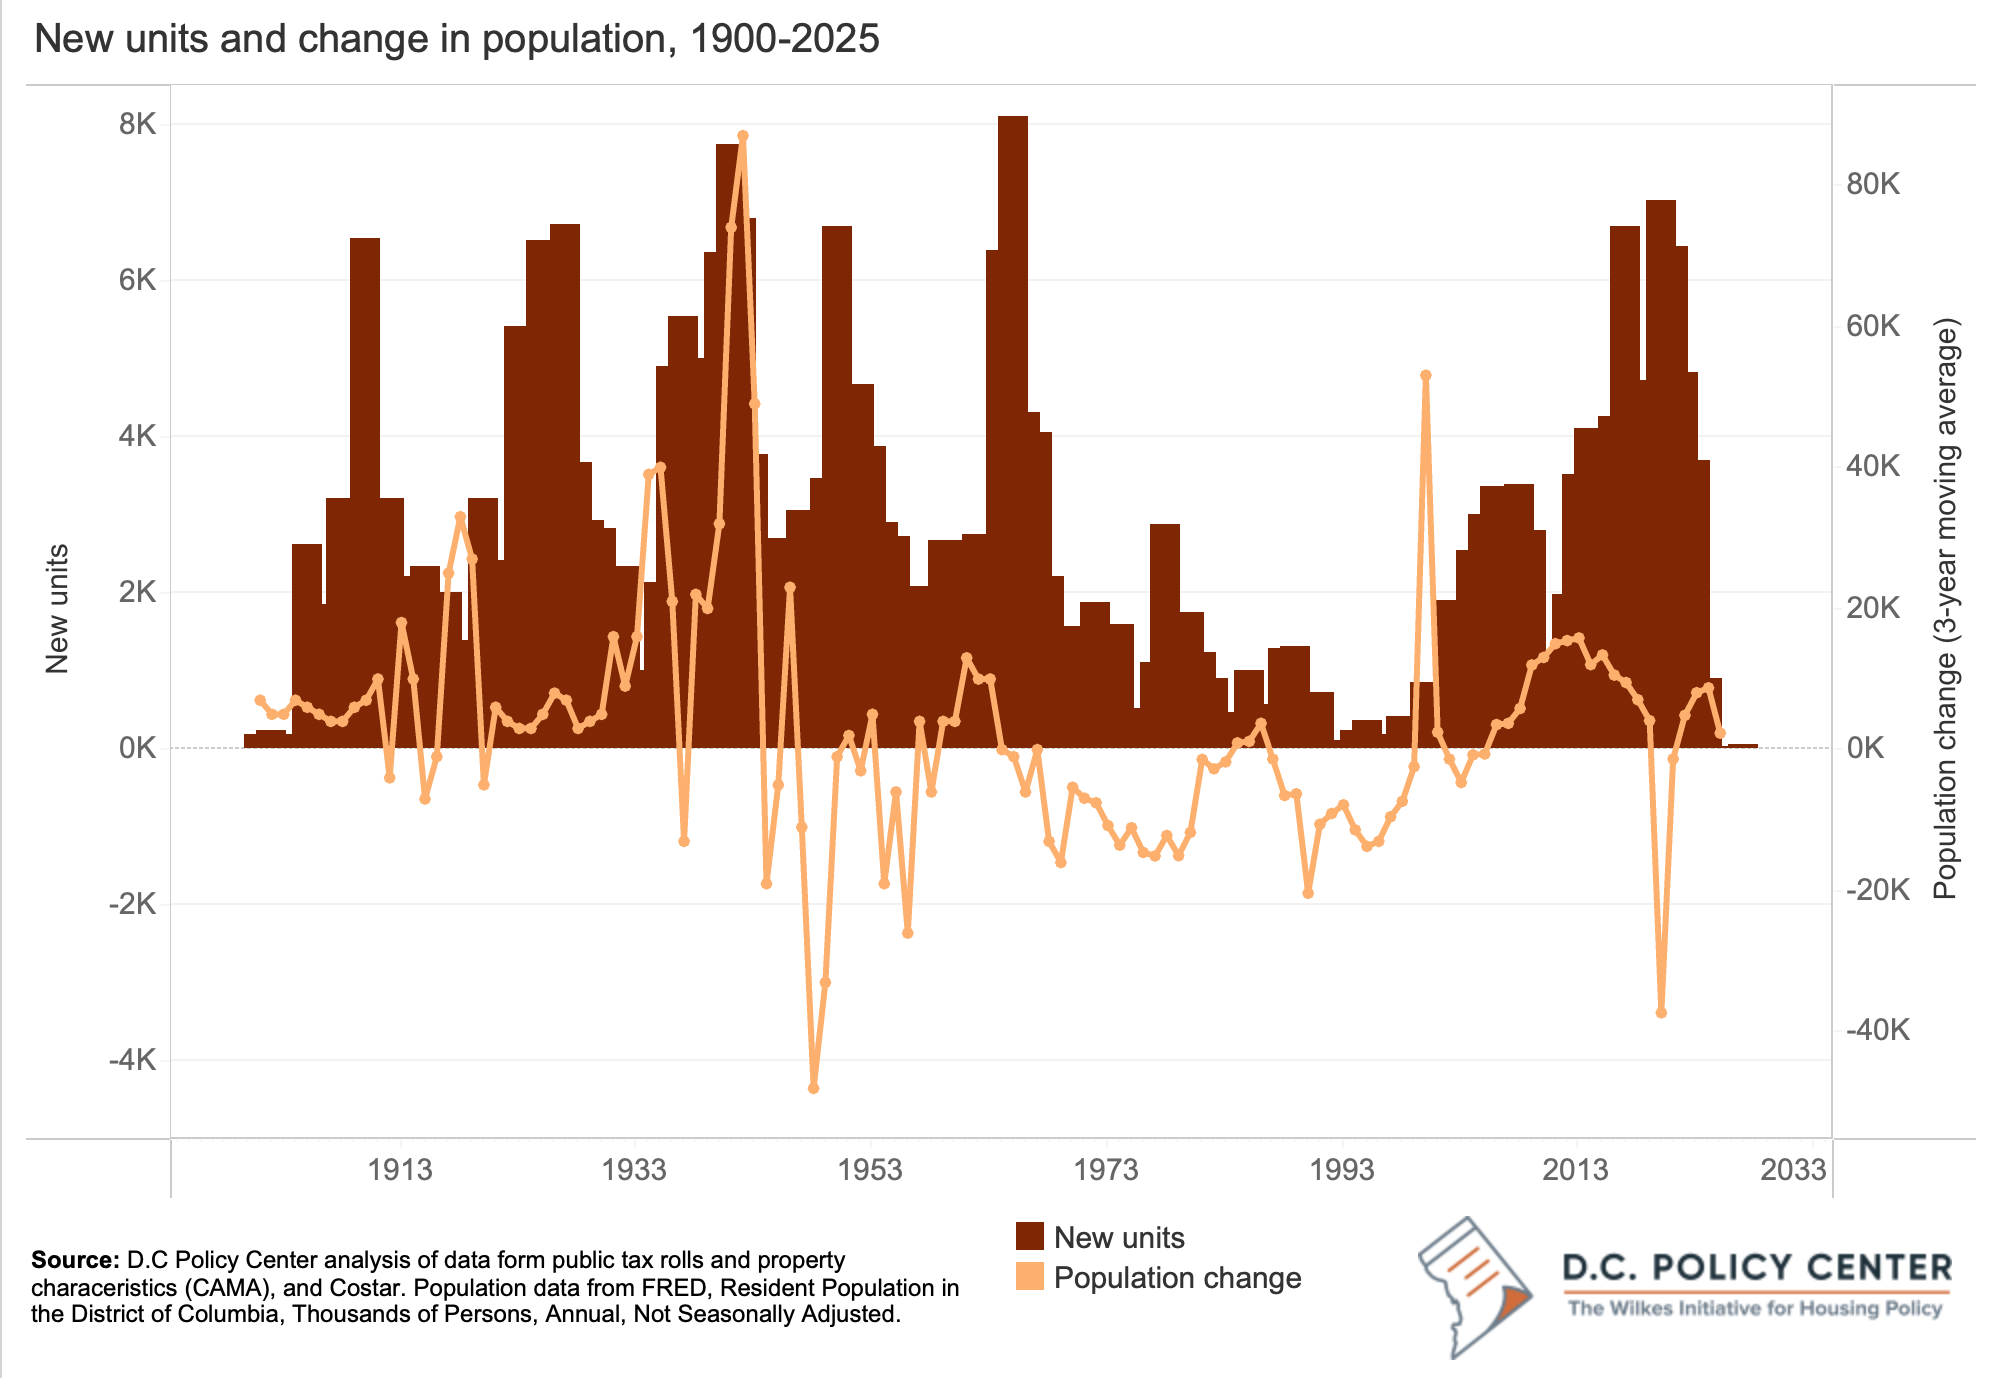
Housing production in the District has been uneven over the years, with a nearly 40-year period of stagnation. Through the early 1960s, strong population growth supported steady construction, particularly during World War I and World War II, as federal employment expanded. Between 1940 and 1967, the city added about 133,000 residents and produced roughly 3,800 housing units per year, about half of which were rentals.
Demographic and housing production patterns reversed after 1967. From 1967 to 2000, the District lost approximately 218,000 residents,[161] and housing production slowed sharply. Annual construction fell to about 800 units, with especially steep declines in rental housing. In the 1990s, the slowdown was more pronounced: the city added only about 4,000 units over the decade, including roughly 1,000 rental units, most of them publicly financed. At the same time, a wave of condominium conversions, often in older apartment buildings,[162] intensified displacement pressures.
Population began to recover after 2000, following the Revitalization Act and a period of improving fiscal conditions and urban amenities that made the District more attractive. Housing production followed soon after. Starting around 2007, the city added nearly 80,000 units in 17 years, the majority in rental apartment buildings (about 56,000 units).[163] That momentum has since slowed. Recent trends suggest that housing production has plateaued and is unlikely to rebound in the near term under current conditions.[164]
This history provides context for some of the city’s major policy interventions. The District passed the Rental Housing Act of 1985, which imposed rent control on most buildings built before 1980 (with some exceptions), capping allowable rent growth.[165] The Tenant Opportunity to Purchase Act (TOPA), enacted in 1980 and expanded in 1995 and 2005, gives tenants the first chance to buy their buildings but also introduces additional transaction steps and uncertainty, especially for aging properties.[166] These interventions addressed immediate displacement risks for existing renters, but over time they made reinvestment and repositioning of older rental stock more difficult, both financially and procedurally.
#3: Recent growth happened where it is allowed, not where it is needed.
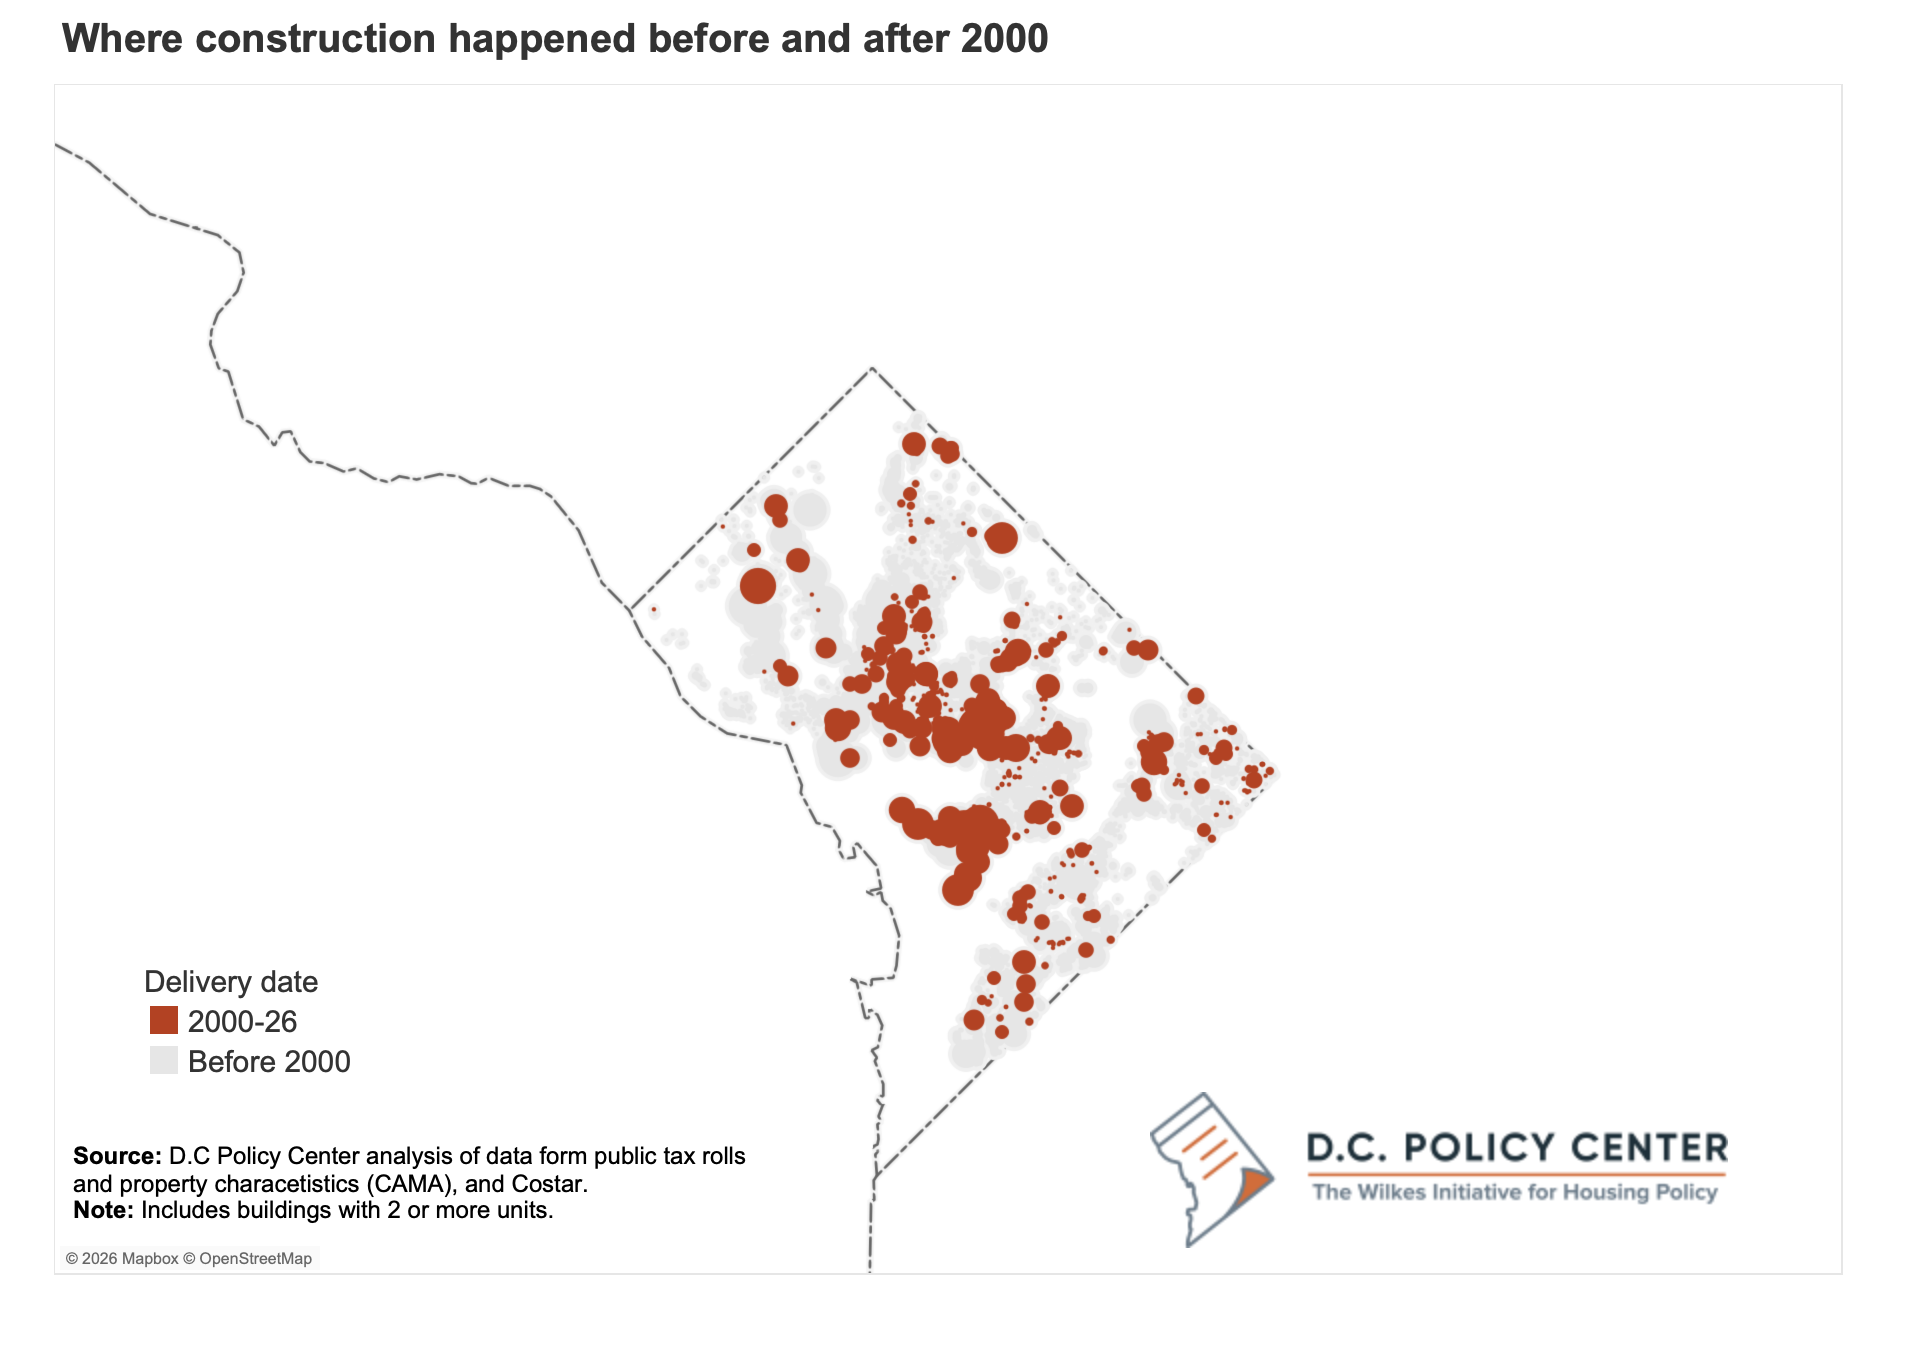
Between 2000 and 2020, the District added more than 80,000 housing units, much of it in multifamily buildings. But both the form and location of that growth are highly concentrated. About half of new buildings had 100 or more units, with another 15 percent in buildings containing 50 to 99 units. These projects are overwhelmingly rental, and together now account for roughly one-third of the city’s rental apartment stock.
Geographically, this new housing is clustered in a small number of corridors and few adjacent lots. Navy Yard (formerly Capitol Riverfront), NoMa/Union Market, the Wharf, and select pockets of Northeast and Southwest absorbed much of the growth, becoming high density corridors with added amenities. These locations share two defining features: zoning that allows density and parcels large enough to support complex, capital-intensive development. In a constrained system, they function as release valves: absorbing most of the city’s growth while much of the city remains largely unchanged.
This pattern reflects a broader planning logic often described as the “Grand Bargain,”[167] where development is concentrated in downtown-adjacent areas, former industrial land, and sites with few existing residents, leaving established low-density neighborhoods largely untouched. Growth is allowed, but only where it is least contested.
#4. The city is renter-majority, but its housing stock is not designed for it.
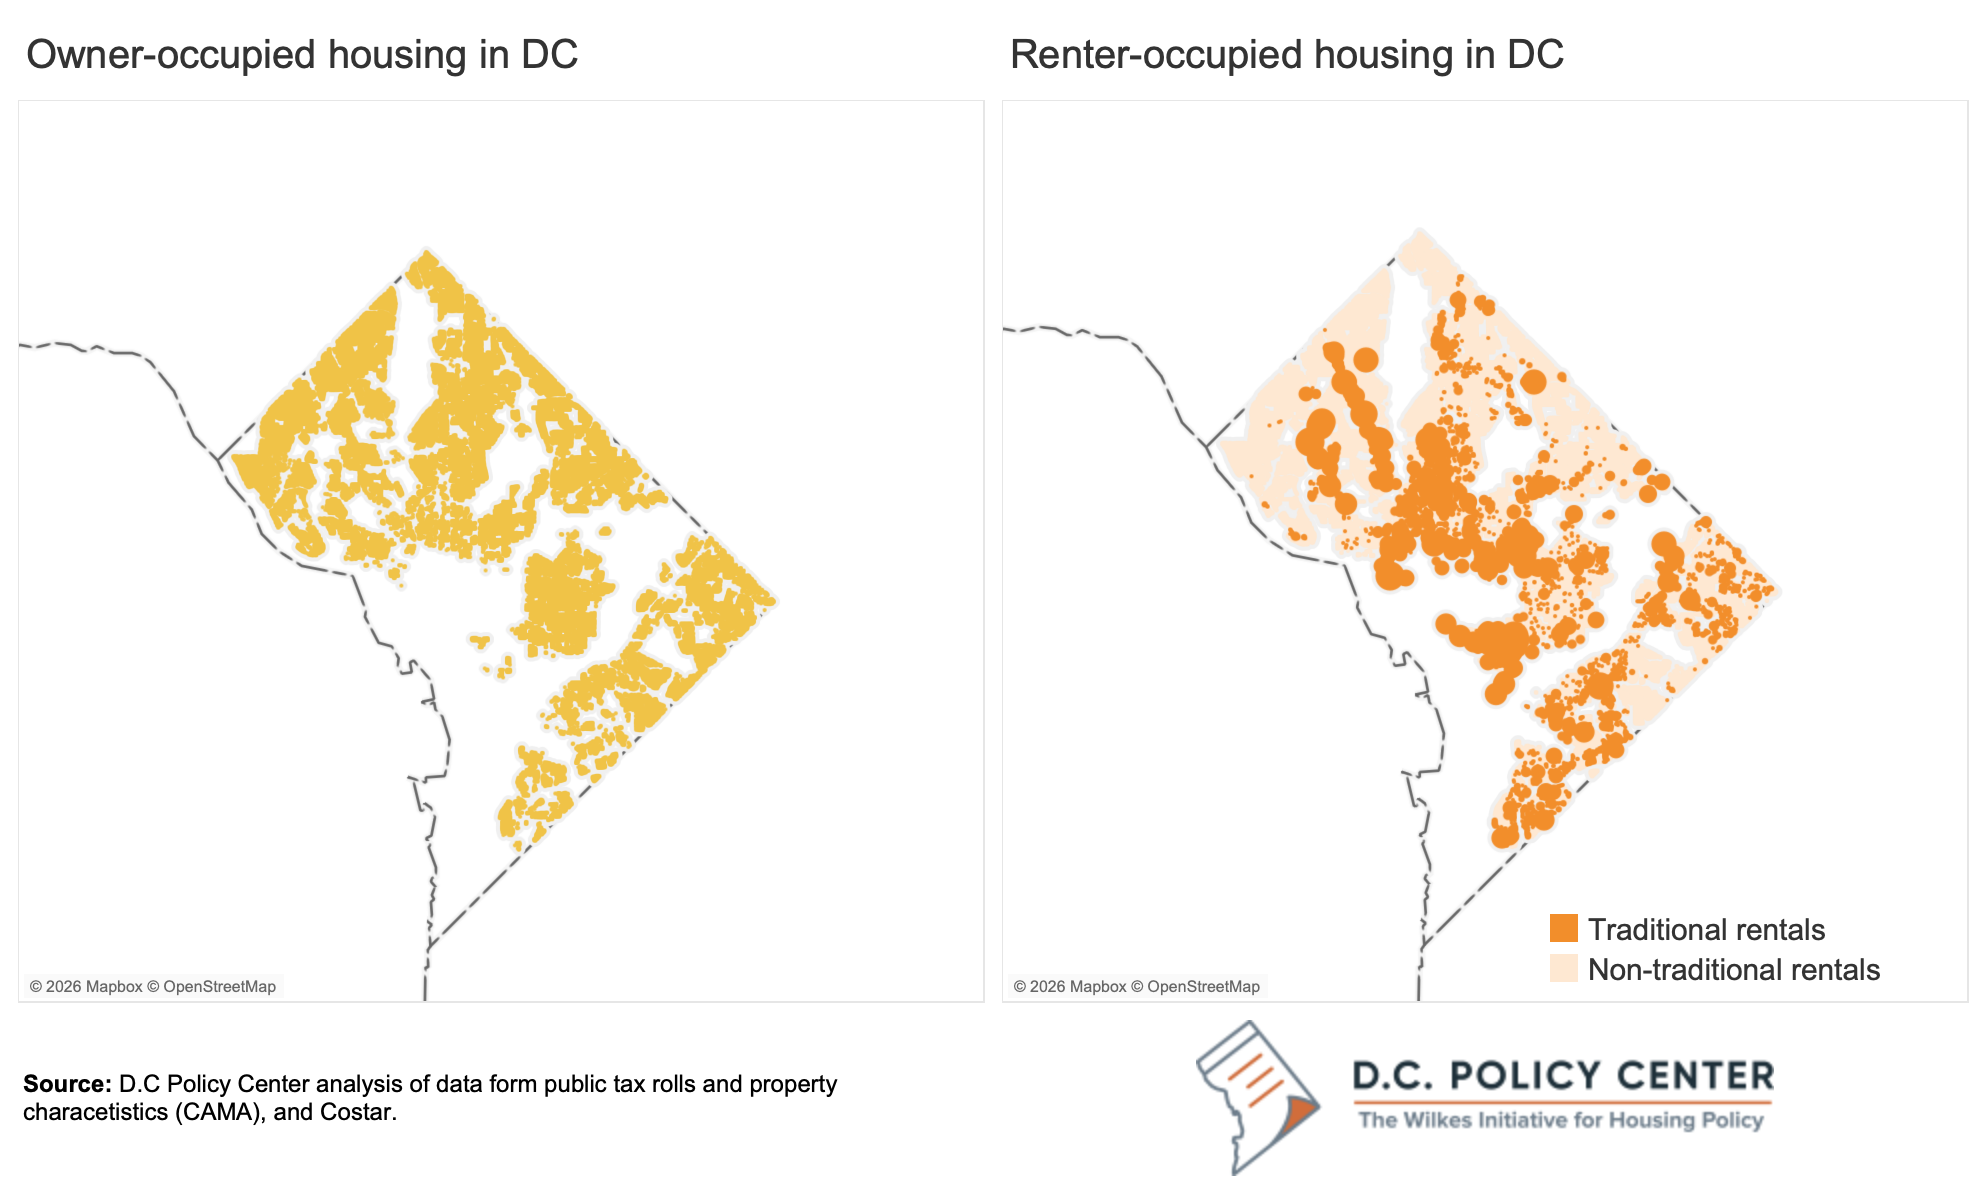
In 2024, 68 percent of all housing were used as rentals (approximately 231,000 units). Yet only about 150,000 of these units are in buildings designed for rental use, such as apartment buildings and investment condominiums. The remaining 80,800 units in single-family homes, flats, and condos were built for owner-occupied housing but function as rentals.
The city’s traditional rentals are concentrated along transit corridors and in a handful of neighborhoods. The non-traditional rentals are spread around the entire city, serving as a source of inclusion and affordability.[168] But this segment is also unstable, moving in and out of the rental market over time.[169] They provide flexible supply for middle-income renters but also introduce volatility. Despite accounting for a substantial share of rentals, non-traditional rentals remain largely outside the scope of formal housing policy.
#5. Only truly 21 percent of units are truly market rate.
Nearly 80 percent of all multifamily rental housing units in D.C. are subject to some form of price restriction, regulatory control, or income targeting, leaving only about 21 percent (29,717 units in 247 buildings) as unsubsidized, unregulated market-rate housing.[170]
This regulatory capture has several key components:
- Rent-controlled units: 73,136 units in 2,292 buildings (about 53 percent of the multifamily rental stock), almost all built before 1978.
- Subsidized units:
- 8,849 units in 254 publicly owned buildings (though some may be offline due to disrepair),
- 8,329 units in 107 properties developed with Housing Production Trust Fund (HPTF) support, and
- 10,100 units in 65 buildings receiving project-based or tenant-based subsidies (including Housing Choice Vouchers and project-based Section 8).[171]
- Inclusionary Zoning (IZ): between 2000 and 4,400 units within newer, market-oriented buildings.[172]
Despite the scale of intervention, the system has not produced broad affordability. Instead, it has created a two-tier market with sharply different outcomes depending on tenure and timing. Long-term renters in regulated units benefit from stability and lower effective prices. Newcomers, younger households, and frequent movers face a much thinner, more expensive, unregulated segment and far more competition.
#6. Affordable housing is geographically concentrated.
Affordability varies widely across the city but is largely confined to subsidized, public, or rent-controlled units. Housing affordable below 50 percent of AMI is effectively absent west of Rock Creek Park, except for a small number of public housing and Section 8 units. Within the rent-controlled stock, units at this level of affordability are concentrated almost entirely in Wards 7 and 8, particularly for two- and three-bedroom apartments.
At higher income levels, limited affordability is somewhat more available, but it narrows quickly. Market-rate studios affordable to households earning between 50 and 80 percent of AMI can be found outside Wards 2 and 3, but this option largely disappears as unit sizes increase. Price differences across segments widen accordingly. In 2024,[173] a market-rate studio rented for a median rent of about $1,992, roughly 30 percent more than a comparable rent-controlled studio ($1,517). That market-rate premium rises to 62 percent for one-bedrooms, 92 percent for two-bedrooms, and more than 260 percent for three-bedroom units, placing larger units well beyond the reach of most moderate-income households.[174]
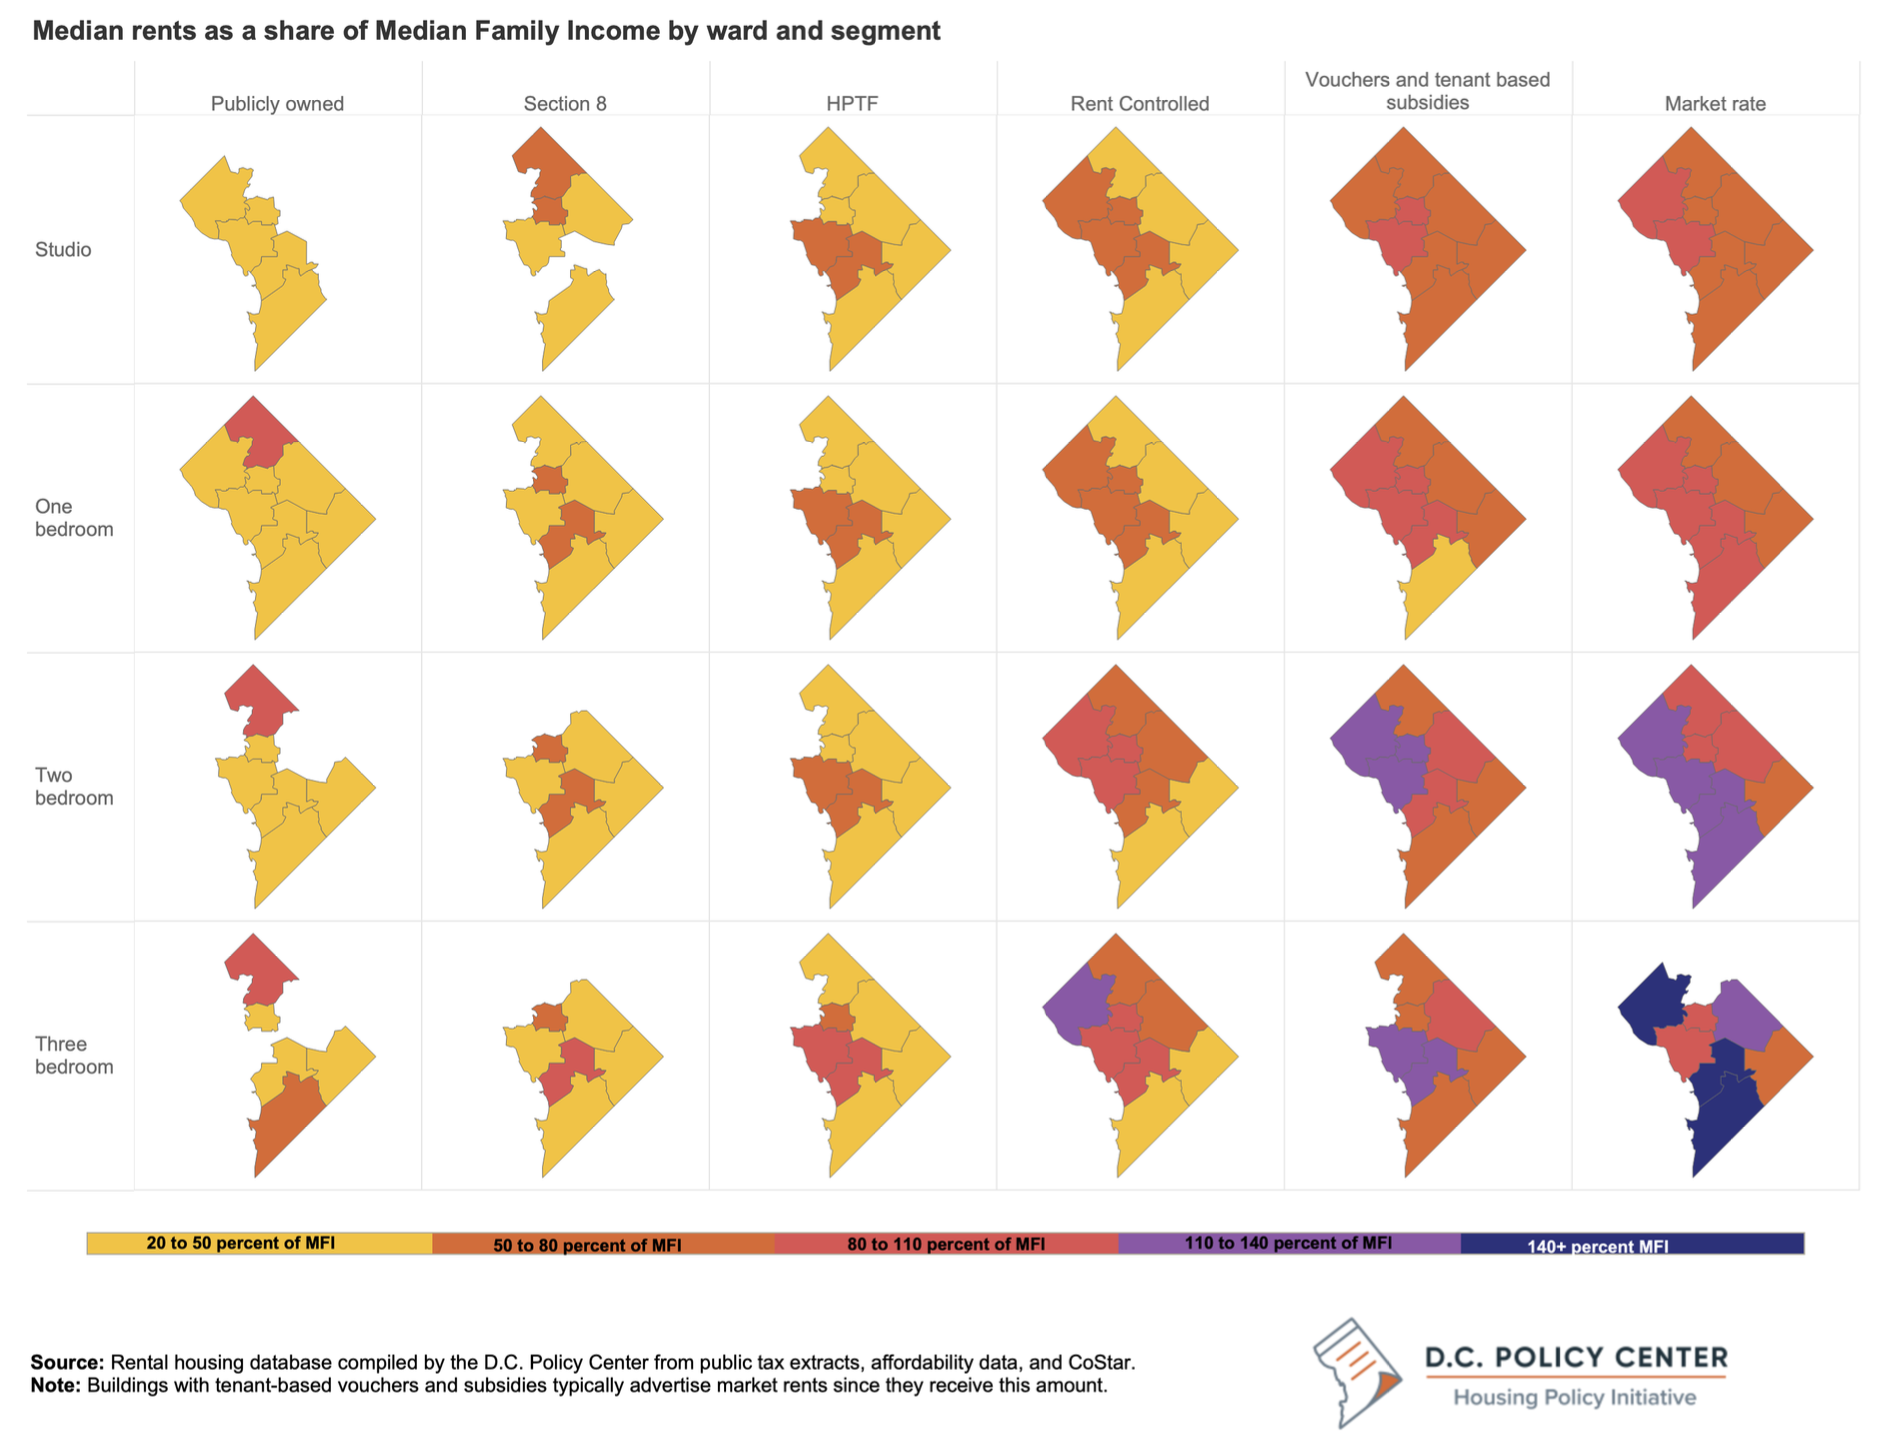
#7: Naturally occurring affordable housing is scarce.
Outside of subsidized housing, naturally occurring affordability is limited. In 2024, approximately 748 buildings had median rents affordable at 80 percent of AMI, representing about 44,990 units. At most, this translates into roughly 22,500 units where rents are broadly accessible at that level.[175]
This segment is both small and fragile. Many of these buildings are older, with limited capacity for reinvestment, and are vulnerable to cost pressures, ownership changes, or redevelopment. As operating costs rise and regulatory burdens increase, these units face pressure to move upmarket or exit the rental stock altogether.
D.C.’s housing supply is driven by regulatory constraints.
Housing markets respond to basic incentives: when demand grows faster than supply, prices rise.[176] In places where housing can be built more easily, new construction absorbs much of the demand, reducing prices in older units. Over time, this allows housing to “filter” down, expanding options and reducing costs for moderate- and lower-income households.[177]
A substantial body of evidence supports this dynamic. New market-rate construction reduces rent pressures in nearby buildings.[178] As higher-income households move into new units, existing naturally affordable housing becomes available.[179] Across high-demand cities, those that added more housing have seen slower rent growth than those that did not.[180] Outcomes improve when the underlying regulatory environment supports housing production (not just zoning but also other factors such as a streamlined permitting process and removal of parking minimums).[181]
The District, in contrast, heavily regulates housing and suppresses development in most of the city. Stringent controls on land use, rents, and multifamily transactions, layered on top of an unpredictable enforcement environment for building and design requirements, make it unusually difficult to deliver new housing in most areas of the city.
The policy response has been to expand subsidies rather than change the underlying constraints that limit housing production. Subsidy programs are essential for the households they reach, but as costs rise, each unit of affordability becomes more expensive to deliver and sustain. Public spending increases, but the underlying shortage remains. The city is, in effect, paying to offset the outcomes of its own constraints—purchasing affordability year by year rather than producing it at scale.
The fiscal cost of substituting subsidies for supply is steep.
Reliance on housing subsidies carries increasing fiscal weight. As rents rise and delivery becomes more complex, each subsidized unit requires more public resources to produce and sustain.[182] In 2023, the District and federal governments spent roughly $418 million on rent subsidies for low-income households.[183] Yet, this investment still falls short of need. Estimates suggest that an additional $380 million annually[184] would be needed to meet the needs of low-income households, well beyond what the city can realistically support on an ongoing basis.[185]
These costs extend beyond the budget. When housing is expensive, households devote more income to rent and less to local consumption and savings. Workforce mobility declines as essential workers and early-career professionals are pushed farther from jobs or out of the city entirely.[186] Over time, this weakens both economic dynamism and the tax base.[187]
A more responsive housing supply would shift this trajectory. Expanding production—particularly in locations where people want to live and work—would reduce pressure on rents, allow more housing to become naturally affordable over time, and lessen reliance on high-cost subsidies. More housing would also expand the tax base. Each additional unit generates recurring tax revenue across property, income, and sales. At scale, this becomes a meaningful source of capacity for the city.[188] In that sense, housing production is an economic development[189] and fiscal strategy tool that addresses affordability while strengthening the city’s long-term economic and revenue base.
The District needs more housing across more neighborhoods, in a wider range of building types, and at a scale that matches demand. That outcome will not come from incremental adjustments to existing programs. It requires a shift in approach to make housing production a central objective and structural reform to align regulatory and governance systems to support this goal. The next section outlines a model that treats housing production not as an exception to be negotiated, but as a system to be enabled.
Section 6. A new vision for housing in the District of Columbia
Washington, D.C.’s housing policy is caught in a costly loop. The city constrains housing supply through regulation, then tries to compensate with ever-larger subsidies. The result is a system that spends more each year and delivers too little.
The underlying problem is a misordered strategy. High housing costs are treated as a given, rather than as the predictable outcome of policies that limit how much housing can be built and where. Land-use restrictions, layered regulations, misaligned taxes, and administrative friction all suppress supply. Limited supply and extensive requirements drive up housing construction and operating costs. Subsidies are then asked to close a gap that policy created.
A more effective approach begins with a different sequencing. The District should make it as easy as possible to create new housing across all neighborhoods, especially in high-opportunity areas, and then use preservation and operating subsidies to secure long-term affordability. When supply expands, rents stabilize, naturally affordable housing grows, and public resources go further. When supply is constrained, subsidies becomes more expensive, more contentious, and less effective.
Evidence points to the power of well-functioning housing markets. Jurisdictions that have allowed housing to respond to demand experience significantly slower rent growth,[190] with the largest benefits accruing to older, more modestly-priced units.[191] New supply does not just add units; it improves the affordability of the existing stock and reduces the cost of subsidies. It also changes the politics. Preservation strategies that face resistance in a supply-constrained environment gain broader support when growth is visible and widely shared.
The District stands at a decisive moment. The housing system it has built is shaped by layers of regulation, constrained land use, escalating costs, and ever-expanding subsidies. It produces housing slowly, expensively, and cannot deliver affordability, equity, or growth at the scale the city needs.
A new vision should be anchored in a simple premise: durable affordability follows from abundant supply. If the goal is a more affordable and inclusive city, the first task is to make it easier and cheaper to build and operate housing at scale. Preservation and operating subsidies can then create affordability on top of that foundation, targeting household need in an efficient and financially sustainable manner.
This plan prioritizes clearer lines of responsibility, more predictable timelines, and better coordination across agencies. It calls for systems that can track projects from proposal to delivery, identify bottlenecks in real time, and manage production as demand grows. It aligns regulatory frameworks including land use, building codes, energy standards, and subsidies so they reinforce one another rather than add cost and delay. It treats housing delivery as a core function of economic development, with performance measured by outcomes, not process. Building this capacity is essential to realizing affordability across the District.
A well-functioning housing system would reflect this ordering:
- The city enables housing production broadly, including in high-opportunity neighborhoods.
- Incremental and moderate-density housing is legal and feasible across the city.
- Naturally affordable housing expands as supply grows.
- Subsidized housing complements the market by creating affordability where it is most needed.
- Households can choose among neighborhoods, rather than being limited to a small number of growth areas.
- Public resources are focused on the most vulnerable households.
The District can build such a system. Doing so requires reorienting policy around core commitments: expanding housing supply, reducing the cost of building and operating housing, improving system reliability and transparency, and aligning subsidies with outcomes the city can sustain. The proposals that follow outline a new vision for housing capable of delivering affordability, equity, and growth at the scale the District requires.
Pillar I – Unlock housing supply across the entire city
1. Expand multifamily zoning from 26 percent to 50 percent of residential land
Problem. Three-quarters of the District’s residential land prohibits multifamily housing. Growth is therefore concentrated into a limited number of corridors, driving up land prices while large parts of the city remain effectively closed to new residents.
Proposal. Use the next Comprehensive Plan to substantially expand where multifamily housing is allowed:
- Increase multifamily-eligible land from roughly 26 to about 50 percent of residential zones.[192]
- Allow small multifamily buildings in more areas.
- Establish clear, predictable design standards to guide context-sensitive density.
- Reduce reliance on discretionary approvals for basic density rights.
Why it matters. Today, about 23,252 single-family-zoned lots have minimum lot sizes of 4,000 square feet or more.[193] These parcels can support small multifamily buildings with fewer than five units,[194] yet zoning restrictions keep most of these sites locked into one-unit use. This constrains supply, intensifies competition for the few buildable parcels,[195] and limits access to high-opportunity neighborhoods.[196]
Impact. Studies have found that that eliminating single-family zoning can increase the housing stock annually by two percent[197],[198] Allowing multifamily use half of these large single-family lots as proposed could add 4,500 units over ten years,[199] particularly in wards where demand is strong but supply is constrained. Over time, this would:
- Enable more incremental, modest-scale infill rather than concentrating all growth in a few towers and corridors.[200]
- Reduce per-unit costs and promote neighborhood walkability.[201]
- Reduce land and development pressure on the limited number of already-zoned sites.
- Open more neighborhoods to a wider range of incomes and household types, especially those near good schools, transit, and job centers.
2. Eliminate minimum parking requirements for residential development
Problem. Parking minimums are one of the largest hidden drivers of housing costs and can reduce housing production. Structured parking alone can add $50,000 or more per unit,[202] with even higher costs where underground or multi-level garages are required. Surface spaces cost about $5,000 each; above-ground garages average $25,000 per space; below-ground garages, roughly $35,000.[203] Requiring one parking space per unit is estimated to increase development costs by about 20 percent while reducing the number of units as much as 37 percent.[204] In effect, parking mandates force higher rents and create fewer homes, especially in transit-rich neighborhoods where many residents do not rely on cars.[205]
The District has a strong transportation network that makes parking unnecessary in many areas. Yet, according to the National Zoning Atlas, 96 percent of all residential lots in the District have parking minimums. Only a handful of lots around Navy Yard, Buzzard Point, and NOMA, Saint Elizabeths and Walter Reed campuses, in addition to mixed downtown zones around K Street and south of Independent Avenue allow residential development without parking requirements.[206]
Proposal. Modernize parking requirements to reflect demand from residents:
- Eliminate minimum parking requirements for residential development. Parking supply should be determined by market demand.[207]
- Allow flexible compliance, including off-site arrangements and in-lieu contributions where appropriate.[208]
Why it matters. Parking minimums consume land and capital that could otherwise support housing. In a city where many residents walk, bike, or use transit, these requirements compel all households to pay for car storage regardless of need.
Other cities have taken a different approach. Minneapolis eliminated parking minimums citywide in 2021.[209] Seattle removed them for most multifamily development in 2012; in the five years that followed, the policy reduced costs by $20,000 per unit ($537 million in total) and enabled substantially more housing production, with 59 percent of new units that would not have been possible under prior parking rules. [210] In New York City, relaxing parking requirements has been associated with more affordable housing and increased production of mid-sized units.[211]
Impact. Eliminating parking minimums would lower per-unit costs, make more projects pencil out and free up land for homes. Developers would still build parking where there is real demand, but they would no longer be required to over-supply it. Over time, this shift would support more housing production in transit-served neighborhoods, reduce cross-subsidies from non-drivers to drivers, and help the District align its land use, housing affordability, and climate goals. A rough estimate suggests that removing binding parking minimums could increase housing production on affected sites by about 25 percent. If such requirements constrain even one-third to two-thirds of the District’s multifamily pipeline, the reform could increase total output in those areas by roughly 8 to 17 percent over time,[212] with the largest gains in transit-served neighborhoods where structured parking is especially costly.
3. Adopt a uniform city-wide minimum-lot size requirement set at 1,400 square feet for all single-family zones
Problem. Minimum lot size requirements make land use less efficient and limit how much housing the city can produce. By requiring each home to sit on a large parcel, these rules push development onto more expensive land and preclude smaller, more attainable housing types such as townhomes and small apartment buildings.
In D.C., nearly 49,000 lots are reserved for detached or semi-detached single-family housing, and about 19,900 of these are larger than 4,500 square feet. These parcels have the physical capacity to accommodate additional homes, yet current rules prevent that capacity from being used.
Proposal. Eliminate use-specific minimum lot sizes in all residential zones and replace them with a single citywide minimum of 1,400 square feet.[213] This would allow owners of oversized parcels to subdivide or reconfigure their lots, enabling more homes on each parcel where demand supports it, especially in high-opportunity neighborhoods.
Why it matters. Minimum lot size rules raise housing costs by requiring households to purchase more land than they need and by limiting how many homes can be built. A large body of research finds that these requirements increase housing prices by 10 to 15 percent or more.[214] Because each unit must sit on a larger parcel, land costs per home rise, particularly in high-value areas. [215],[216]
Larger lots also increase infrastructure costs.[217] Roads, water, sewer, and other systems must extend across more land to serve the same number of households, raising per-unit costs without improving outcomes. In the District, minimum lot sizes directly constrain incremental infill. Parcels that could support two or three homes instead accommodate only one, even in neighborhoods well served by jobs, schools, and transit.
Impact. Evidence from other jurisdictions shows that reducing minimum lot sizes can unlock substantial, small-scale housing production. Houston lowered its minimum lot size in its urban core from 5,000 to as little as 1,400 square feet in 1998 (later expanded citywide). Between 1999 and 2016, more than 25,000 homes were built on sub-5,000-square-foot lots, and over 5,300 single-family lots were redeveloped into townhouses, replacing one unit with several.[218] California’s statewide ADU reforms similarly removed local lot size barriers. Following these changes, annual ADU permits increased from roughly 6,000 to over 15,000 in a single year, with more than 3,300 ADUs permitted or built on lots of 5,000 square feet or less.[219] Across multiple studies, each additional quarter-acre increase in minimum lot size is associated with roughly 10 percent fewer homes built or permitted over time.[220]
Aligning the District’s minimum lot size to 1,400 square feet could unlock thousands of additional homes through incremental infill, using land the city has already urbanized and infrastructure it has already built, and allowing units in neighborhoods with the most restrictive zoning. For example, if only 10 precent of the lots moved to take advantage of the change to add one more housing unit, the city could add approximately 2,000 units. If 30 percent of the lots were to be redeveloped to maximize land capacity, the city could at 12,000 new units.
4. Allow building heights up to the limits of the federal Height Act by aligning local zoning and overlays
Problem. Although the federal Height Act applies citywide, most neighborhoods are constrained by much tighter local zoning.[221] Single-family zones, which cover about 75 percent of all tax lots in the District, cap buildings at 40 feet and three stories. By contrast, the Height Act would allow up to 90 feet on residential streets and 130 feet on most commercial streets.[222] The result is a large gap between what federal law permits and what local rules allow, especially in high-opportunity, transit-served areas.
Proposal. Expand by-right construction up to the Height Act limits, starting in high-opportunity, transit-rich neighborhoods such as Cleveland Park, Tenleytown, Friendship Heights, and Anacostia. This means raising local height and density caps so that projects that meet clear standards can proceed without discretionary zoning appeals.
Why it matters. The current system effectively wastes federally permitted capacity. By holding local limits well below the Height Act, the District concentrates growth in a small number of locations while underutilizing much of its available land. Over time, this pattern limits both housing supply and the city’s fiscal base in areas where demand is strongest. Evidence from U.S. metropolitan areas shows that easing height restrictions supports higher housing production and moderates rent growth, particularly when paired with broader zoning reform.[223]
Impact. District and federal analyses have estimated the scale of this opportunity. As part of the 2013 Height Master Plan, the Economic Feasibility Analysis examined modest increases in allowable height in high- and medium-density, transit-accessible areas. It estimated the potential for approximately 4,400 to 7,900 additional housing units and up to 1.8 million square feet of office space over 20 years, along with $62 to $115 million in additional annual tax revenue[224]—before accounting for current remaining unused capacity.
5. Make the code friendlier to ADUs and small apartments
Problem. The most recent Comprehensive Plan update legalized Accessory Dwelling Units, or ADUs, as of right in most residential zones. These small, self-contained units are intended to support gentle infill. In D.C., ADUs are typically basement apartments, in law units, or backyard cottages.
ADUs are subject to different requirements depending on underlying zoning, creating inconsistency and added complexity. In R zones where only one principal unit is permitted, an ADU is generally treated as part of the existing home. In RF zones, where two units are allowed, the same ADU is treated as a separate dwelling, even when it is physically attached, such as an English basement.
This distinction carries significant code implications. The District’s amendments to the Existing Building Code classify many ADU projects as Level 3 residential alterations and tie additions to full Chapter 9/IRC sprinkler requirements, with only limited exceptions. In effect, ADUs and small two-unit conversions are often treated like standard two-family buildings for fire protection purposes, requiring residential sprinklers, enhanced fire separation, noise mitigation, and more complex egress standards. These requirements go well beyond typical home renovation and impose costs and design constraints that are disproportionate to the size and risk of the project.
Proposal. Create a simplified regulatory pathway for a primary dwelling with one accessory unit:
- Establish a lighter-touch code track so ADUs are not automatically treated as full two-family buildings when they are built in RF zones.
- Introduce flexibility in zoning and building standards for ADUs[225] by allowing reasonable adjustments to ceiling heights, windows, and stairs, and removing arbitrary limits on occupancy and minimum unit size while maintaining core safety protections.[226]
- Clarify sprinkler requirements so that ADUs do not trigger sprinkler mandates where they are not required in the primary dwelling, and do not retroactively impose upgrades on the existing structure.[227]
Why it matters. ADUs are among the least disruptive ways to expand housing in established neighborhoods and can provide naturally affordable housing.[228] However, ADUs rely on small-scale decisions by individual homeowners and are highly sensitive to cost, complexity, and uncertainty. When these projects are regulated as if they were full-scale multifamily conversions, the policy intent of as-of-right legalization is undermined.
Impact. Eliminating differential treatment across zoning categories would remove a key source of confusion and allow ADUs to be evaluated based on their actual scale and risk, rather than underlying zoning technicalities.
Pillar II – Reduce costs by modernizing codes, environmental rules, and permitting
Affordability is impossible when every project must absorb unnecessary costs. Our vision for housing requires recalibrating rules so that they achieve safety and environmental goals without making housing significantly more expensive.
6. Make permitting faster and more predictable
Problem. The District’s permitting system remains slow, fragmented, and difficult to navigate. Recent improvements have helped, including the creation of the Department of Buildings in 2022, online plan submissions, reduced prescreen times, and same-day express permits. But for many projects, the process still involves multiple prescreen cycles (often a dozen or more), as many as nine rounds of review, [229],[230],[231] and sequential approvals across numerous agencies: DOB, DOEE, DDOT, DC Water, FEMS, WMATA, historic review bodies, the Public Space Committee, and, in some cases, federal entities.[232]
These delays carry measurable costs. One study estimates that each additional month of delay increases total project costs by roughly 1 percent (about $4,400 per unit) while also increasing financing risk.[233] Another analysis from the Baltimore region finds that for every 1 percent increase in expected approval time, the probability of development declines by 0.94 percent.[234] The burden falls most heavily on smaller, local developers and on moderate-scale projects, where margins are thinner and delays are harder to absorb.
Proposal. Reform the permitting system to make it faster, more predictable, and rule-based:
- Make by-right actually by-right. Projects that comply with zoning and building codes should proceed without discretionary approvals or public hearings. Enforce clear, publicly-available timelines for agency decisions.[235] Evidence suggests that by-right reforms can increase housing supply by 1 to 2.5 percent annually.[236]
- Set maximum review periods. Cap total review time for residential development. Modeled on reforms in California, total review time for by-right residential projects should not exceed 60 days for small and medium sized projects (under 150 units), or 90 days for large developments (150 units and over).[237] Missed deadlines should trigger automatic escalation or be deemed approved.[238]
- Limit subsequent review rounds to issues directly tied to new submissions.[239] Limit each agency to one substantive review and comment cycle to prevent reassessment of previously approved elements.
- Run concurrent reviews Require agency review from DOB, OZ, DDOT, DOEE, and public space to work in parallel rather than in sequence.[240] Establish a single intake and tracking system across agencies.[241]
- Reform public space permit process. Reduce actions that require Public Space Committee review and relax curb cut review and restrictions. Require the Committee to publish decision criteria and processes. Ensure that permit durations align with the time needed for the project.
- Create pre-approved designs. Develop standardized, pre-approved plans for common housing types such as rowhouses, small walk-ups, and small multifamily buildings, with same-day approval for qualifying projects. Include pre-approved layouts that meet accessibility requirements such as UFAS, ADA, Type A standards, and accommodations for deaf residents.[242]
- Prioritize affordable housing. Offer accelerated permitting for projects that include units affordable to households earning 60 to 80 percent of AMI.[243]
- Build accountability through data. Publish quarterly metrics on timelines, review rounds, and approval rates. Set clear production targets by Ward and income level and track performance against them.[244] Consider comprehensive permitting and targeted zoning relief in low-production areas, modeled on Massachusetts’ Chapter 40B framework.[245]
Why it matters. Today’s permitting system functions as a hidden tax on housing production. Time delays increase costs, uncertainty raises financing risk, and complexity discourages smaller developers. Capital shifts toward larger projects and more predictable jurisdictions. A system that is time-limited, transparent, and rule-based reduces risk while maintaining oversight of health, safety, and environmental standards. It allows more participants to build and supports a steadier flow of housing across price points.
Impact. Evidence from other jurisdictions shows that shorter, more predictable timelines meaningfully increase housing production. Removing discretionary approvals can cut approval times by roughly 30 percent. [246] In Los Angeles, a 25 percent reduction in permitting time is estimated to increase housing production by 13.5 percent.[247]
For D.C., cutting 6 to 12 months from typical permitting timelines would make many additional projects pencil out, expand participation of smaller local developers, and support a steadier pipeline of new homes without weakening the underlying building and safety standards.
7. Expand pathways for permit approvals by allowing third-party permit review process replace DOB approval, when appropriate
Problem. The District’s third-party review program[248] is narrow[249] and underpowered as a housing tool. While it can make DOB’s internal building-code review process faster, it does not include zoning, public space, historic, transportation, or environmental approvals.[250] Projects must still move through the same multi-agency process, and DOB retains the authority to re-review plans and reopen issues even after third-party certification. Applicants who use the program effectively pay twice (permit fees and third-party fees) yet still wait on the same bottlenecks. As a result, the program is used primarily by larger projects and has limited relevance for the smaller and mid-sized developments where delays are most consequential.
Proposal. Refocus third-party review as a risk-based, certification-driven pathway that can meaningfully substitute for agency review in standard cases:
- Make third-party sign-off binding for code issues. Adopt a “deemed-to-comply” model for qualifying projects, with DOB limited to risk-based audits rather than full re-review. Certification would satisfy code requirements unless DOB identifies specific defects within a defined window (e.g., 10–15 business days).[251]
- Create a by-right fast lane. Allow qualified professionals to certify compliance with standard zoning metrics (height, FAR, lot occupancy, setbacks) for by-right projects with no map amendments, PUDs, or special exceptions. Similarly, allow third-party pre-screening for DDOT/public space checklists, DOEE stormwater/green infrastructure in standard cases, and routine historic technical details.
- Shift from full review to audit-based oversight. Shift DOB’s role toward oversight and auditing rather than parallel technical review. Eliminate duplicative payments by offering permit fee credits or reduced plan review surcharges when applicants use approved third-party reviewers for code compliance review.
- Create a fast track for small infill housing production. Establish a small-project third-party track for ADUs and basement apartments, 2-to-4-unit conversions, small walk-ups, and infill development. Support this with standardized review templates, a vetted roster of reviewers with transparent pricing, and simplified workflow within ProjectDox/Tertius.
- Improve transparency and performance. Set enforceable standards for third-party submissions and publish performance metrics, including turnaround times, correction rates, audit findings, and compliance rates. Integrate systems so all submissions, certifications, and agency comments are visible within a single platform.
- Modernize program rules. Update guidance so that eligibility is defined by project risk and complexity, rather than agency boundaries. Expand the scope of third-party approval for low-risk, standardized work such as small interior alterations and tenant fit-outs.
Why it matters. In its current form, third-party review adds another actor without materially reducing DOB’s workload or shortening the overall path to a permit. That structure delivers neither speed nor cost savings, particularly for smaller and mid-size housing projects that operate with tight margins. Each additional review layer increases costs by as much as 4 percent per required agency review, while also increasing uncertainty.[252]
A certification-based, risk-adjusted approach would change the role of government from re-reviewing every detail to verifying outcomes. It would allow DOB to focus on complex, high-risk projects while creating a predictable pathway for routine infill. Most importantly, it would make third-party review a practical option for smaller developers, not just a niche service for large projects.
Impact. When structured effectively, third-party certification can significantly reduce timelines and expand production. In Phoenix, architect- and engineer-led self-certification reduced permitting timelines to fewer than five days[253] and approximately doubled permit volume.[254]
Adapting this model to the District would preserve government oversight while shifting technical review to standardized professional certification.[255] That shift would make it easier to deliver the types of housing most constrained by today’s system like ADUs, small multifamily buildings, and incremental infill, bringing more projects to market with greater speed and predictability.
8. Remove local building code amendments that create cost without safety gains
Problem. The District begins with already rigorous ICC-based construction codes[256] and then layers on additional local amendments,[257] many of which are driven by policy goals that extend beyond core life-safety requirements. While often well-intentioned, these additions increase both cost and complexity, particularly for small and moderately sized residential buildings.
Proposal. As it moves to the next ICC code cycle, Department of Buildings[258] should realign D.C.’s building codes with modern construction and safety standards, while providing targeted relief for smaller projects:
- Adopt base codes with minimal deviation. Move quickly to adopt the 2021 (or 2024) IBC, IRC, and IEBC with limited local amendments.[259] Publish side-by-side cost and safety implications for each local amendment and retain deviations only where measurable safety benefits are clearly justified.
- Introduce flexibility for smaller buildings. Update life-safety and accessibility provisions to allow lower-cost, equivalent safety solutions in smaller structures. This includes aligning D.C. with the 48 states that do not require sprinkler systems for one- and two-unit buildings or townhomes under the International Residential Code (IRC).[260] In larger buildings, allow alternatives such as induction cooking or automatic closing doors in place of full sprinkler requirements in appropriate contexts.
- Allow single-stair mid-rise residential buildings. Permit single-stair buildings up to 8 stories, consistent with emerging national standards and proposed updates to the IBC.
Why it matters. Local amendments that exceed national standards tend to fall most heavily on the housing types the city needs most: small multifamily buildings, accessory dwelling units, and conversions of existing structures. These types of housing can expand supply, improve access to high-demand neighborhoods, and create naturally affordable units.
Single-stair buildings illustrate the opportunity. New York City has long permitted single-stair apartment buildings up to six stories, with fire death rates comparable to other residential types.[261] Research indicates that four- to six-story single-stair buildings are approximately 6 to 13 percent less expensive to construct than comparable two-stair buildings.[262] Proposed IBC changes would allow single exits in R-2 buildings up to four stories, and at least 11 states and five cities have already moved in this direction.[263] Aligning the District’s codes with these practices would allow safe, modest-scale buildings to be delivered more efficiently, rather than subjecting them to requirements designed for much larger structures.
Impact. A more streamlined code framework would lower construction and compliance costs, expand feasible infill and conversion projects, and make it easier to reuse existing buildings. Aligning closely with base ICC codes would also improve predictability for builders and designers, supporting more small-scale housing while maintaining strong safety and accessibility standards.
9. Use the International Existing Building Code for conversions and additions
Problem. Many reuse projects are treated as if they were new construction, adding costs and preventing redevelopment. The District has adopted the International Existing Building Code (IEBC), which provides flexible pathways for repairs, alterations, use changes, and additions, including a performance-based option focused on outcomes rather than rigid standards. In practice, however, developers routinely face requirements for fire protection, noise, and energy that mirror new-building standards. These upgrades significantly increase costs and often make projects infeasible, especially for rowhouse-to-flat conversions, small walk-up additions, and office-to-residential reuse. Both the D.C. Office of Planning and national research point to the same constraint: adaptive reuse is limited not just by building design, but by code-driven upgrade requirements[264] —precisely the issue the IEBC is designed to address.
Proposal. Make the IEBC as the default framework for reuse:
- Make IEBC pathways the standard for alterations, repairs, and changes of use for qualifying projects.
- Provide clear guidance on when full structural upgrades are required and when existing structures can remain.
- Expand use of the IEBC’s performance compliance path where life-safety outcomes can be demonstrated without full prescriptive compliance.
- Reassess seismic and wind upgrade triggers for small residential additions and vertical expansions to better reflect project scale and risk.
Why it matters. When reuse is treated as new construction, its core advantages disappear. Existing buildings offer lower embodied costs and the ability to reuse functional structures. Requiring full upgrades in every case shifts resources toward compliance work with limited marginal benefit, while preventing new homes from being created. A clearer, outcome-based application of the IEBC would maintain safety and accessibility while allowing projects to move forward under standards that match their scale and risk.
Impact. Applying the IEBC as intended would make more conversions technically and financially feasible, unlocking rowhouse-to-flat projects, small multifamily additions, and office-to-residential reuse. Over time, this would expand housing supply within the existing built environment, adding homes in established neighborhoods without requiring large-scale redevelopment or land assembly.
10. Enable small building compliance paths in the energy code
Problem. The District’s 2017 Energy Code eliminated the “Simplified/Small Building Option,”[265] removing a streamlined compliance path for smaller projects. As a result, small multifamily buildings, mixed-use infill, ADUs, and modest additions are now subject to the same complex modeling and engineering requirements as large developments.
Proposal. Reintroduce a clear, proportional compliance pathway for smaller buildings:
- Reinstate the simplified/small-building option (or create a comparable local alternative) for small multifamily, mixed-use infill, modest conversions, and additions.
- Develop simple, standard pre-approved assemblies and system options that qualifying projects can use.
Why it matters. Small projects operate with limited margins and are less likely to be able to absorb high compliance costs such as energy modeling and engineering studies. Applying large-project requirements to a four-unit walk-up or an ADU imposes disproportionate burdens and discourages exactly the kind of incremental development that can fit within existing neighborhoods. A simplified path would maintain performance standards while aligning compliance with project scale.
Impact. A streamlined small-building pathway would reduce per-unit soft costs, shorten timelines, and increase financial viability for small multifamily buildings, mixed use development, and ADUs. Over time, this would support a broader mix of housing while still achieving the District’s energy goals through standardized, predictable solutions.
11. Limit green/net-zero requirements for small multifamily buildings
Problem. The District applies its Green Construction Code [266] on top of the International Building Code to all multifamily buildings over four stories, layering additional energy, envelope, solar-ready, and EV-ready requirements onto already stringent base standards. For small and mid-rise buildings, these mandates often require costly adjustments, including thicker wall assemblies, complex roof configurations, and garage layouts that interfere with efficient unit stacking. They can also increase insurance costs.[267]
Proposal. Align requirements with building scale and economics:
- Apply mandatory Green Construction Code requirements to buildings over eight stories, where economies of scale make compliance more cost-effective and performance gains are more substantial.
- Apply base energy codes (IBC, IEBC, IECC) for smaller buildings (under 8 stories) and use voluntary or incentive-based approaches to encourage compliance with Green Construction Code.
Why it matters. Mid-rise buildings (four to seven stories) are among the most efficient forms of housing to design, permit, and build.[268] They can deliver substantial units while fitting into existing neighborhoods. However, they lack the scale to absorb layered requirements without reducing unit counts or increasing rents.
Other jurisdictions recognize this difference in scale:
- Seattle[269] and Portland[270] exempt small multifamily from certain green mandates and rely on incentive-based tiers.
- Houston and Phoenix[271] rely primarily on the base energy codes for mid-rise buildings, reserving stricter requirements for larger buildings.
- In California,[272] Tier 2 green building standards (CALGreen) are feasible only for larger buildings. Many small infill projects rely on base code compliance because higher tiers impose disproportionate costs.[273]
Impact. Applying D.C.’s Green Construction Code to buildings over eight stories would reduce design complexity and lower per-unit costs for the mid-rise buildings most capable of adding incremental density. It would enable more four- to seven-story housing to move forward while maintaining core energy performance through base codes.
12. Reform BEPS to protect existing housing while advancing climate goals
Problem. D.C.’s Building Energy Performance Standards (BEPS) and rising utility costs are placing growing financial pressure on older and rent-regulated housing. Many of these buildings are older (often built between 1880 and 1970) and use gas for heating and hot water. They have limited operating margins and were not designed to meet modern energy performance targets on accelerated timelines.
BEPS compliance is based on whole-building energy use reported through ENERGY STAR Portfolio Manager, which includes both owner-controlled systems and tenant consumption.[274] As a result, performance scores can reflect factors outside the owner’s control, weakening the link between investment and compliance outcomes, especially in master-metered buildings.[275]
Compliance pathways may require significant capital investment over time, including system upgrades or envelope improvements. While technically feasible in many cases, these investments are often financially infeasible for rent-regulated or naturally affordable housing, where costs cannot be fully recovered through rents.[276] For occupied buildings, upgrades may not be possible at all without relocating tenants and significantly changing building structures.
In 2025, the Mayor proposed delaying compliance timelines for certain buildings—an approach the Council ultimately rejected. But this approach does not address the underlying issue: a uniform framework applied to a highly diverse building stock with widely varying capacity to comply. Without structural change, D.C.’s BEPS framework risks pushing vulnerable buildings toward conversion or financial failure.
Proposal. Refine BEPS to better reflect building conditions, financial constraints, and achievable pathways:
- Calibrate compliance to building classifications. Strengthen differentiation by building type, age, and system configuration within the existing framework, using current data while improving future data collection.[277] Buildings with older systems, limited electrification capacity, and naturally occurring affordable housing face different upgrade paths and financial constraints. Policy should reflect these differences in both performance expectations and compliance pathways.
- Expand the prescriptive pathways program to include targeted improvements. The District already adopted a prescriptive pathway for older buildings, but it can be improved. Similar to New York’s “prescriptive path,” [278] allow compliance via targeted improvements (controls upgrades, partial electrification, envelope repairs) rather than requiring buildings to meet performance scores they are structurally unable to reach.
- Formalize financial hardship and feasibility considerations. Provide clearer, standardized processes for extensions, adjusted targets, or compliance agreements for regulated affordable housing and smaller operators. Following Boston’s BERDO equity review, [279] offer extended timelines, adjusted penalties, and provisional compliance for regulated affordable buildings and small nonprofit operators.
- Align compliance with financial support and technical assistance. Improve available technical assistance to meet BEPS requirements, similar to assistance offered by the Montgomery County’s Green Bank.[280] Improve access to financial assistance and incentives such as programs administered by DCSEU.
- Shift toward compliance planning. Expand the use of multi-year compliance agreements and phased improvement plans, allowing buildings to prioritize cost-effective upgrades rather than face immediate penalties.[281]
- Protect dedicated funding streams to increase energy efficiency. Ensure that revenues intended for energy efficiency and building upgrades such as the Sustainable Energy Trust Fund are used for their statutory purpose,[282] supporting building improvements rather than offsetting government utility bills.[283] SETF funds are intended to support building decarbonization, energy efficiency retrofits, and electrification assistance.
- Adjust performance metrics where control is limited. In master-metered buildings, tenant energy costs are distributed across the building and there are few incentives to reduce individual energy use. Allow the use of alternative compliance metrics such as adjusted EUI or ENERGY STAR scores that reflect only owner-controlled energy loads (e.g., common areas and central systems). At the same time, modernize D.C.’s legal framework to allow submetering, so responsibility for energy use can be better aligned over time.[284]
Why it matters. Much of the District’s affordable housing is in older buildings built between 1880 and 1979, with constrained financial capacity. Applying uniform performance targets without regard to cost feasibility risks diverting limited resources away from essential maintenance and into compliance strategies that may not deliver proportional benefits.
Other jurisdictions have adjusted their approaches in response to similar challenges. New York City introduced “good faith” and alternative compliance pathways under Local Law 97.[285] Boston incorporated hardship provisions into BERDO 2.0 to protect income-restricted housing.[286] These approaches recognize that achieving long-term efficiency requires financially viable buildings. Policies that overlook the distinction between technical viability and financial feasibility risk undermining both housing stability and climate goals.
Impact. A calibrated BEPS framework would improve compliance outcomes by aligning requirements with what buildings can realistically achieve. By reducing financial distress in older and regulated housing, it would limit pressure toward disinvestment, conversion, and foreclosure, while also supporting continued capital investment through clearer and more predictable compliance pathways. It would preserve affordability by avoiding cost increases that cannot be absorbed within rent-regulated properties and improve participation in energy upgrade programs by better aligning incentives with obligations. Ultimately, this approach would deliver more durable emissions reductions, since financially stable buildings are far more likely to complete and sustain upgrades over time.
Pillar III – Modernize landlord-tenant relations, tax assessments, and preservation programs
Beyond land use and permitting constraints, developers and housing providers face a set of systems that are complex, inconsistent, and difficult to rely on. These challenges stem from limited enforcement of rental contracts, uneven tax treatment of committed affordability, and unpredictable exactions from DDOT and public utilities.
13. Shorten eviction timelines while preserving strong tenant protections
Problem. The District’s eviction process is slow, uncertain, and costly for both tenants and housing providers. Routine nonpayment cases can take 18 to 24 months from first missed payment to unit vacancy. This reflects policy choices such as paper-based processes, automatic and repeated continuances, crowded dockets, and limited use of mediation. With weak eviction enforcement, tenants accumulate arrears that become unmanageable. Housing providers—especially small owners—go extended periods without income, defer maintenance, and face rising financial risk. Buildings experience underinvestment, and the system produces outcomes that serve neither tenants nor owners well.
The 2025 RENTAL Act[287] makes important front-end improvements, but does not address the entire problem.[288] It requires pre-filing notice, encouraging early communication and payment plans before cases go to court. It also reinstates protective orders[289] and modestly improves data collection. These steps reduce surprise filings and create opportunities to resolve disputes before they reach court. But the Act does not address how cases proceed once filed, nor does it improve resolution timelines, modernize court operations, or reduce procedural delay.[290]
Proposal. Pair front-end protections with back-end reforms that deliver timely resolution while maintaining tenant rights:
- Expand and normalize mediation. Make mandatory mediation a quick, early step in nonpayment cases, with trained mediators to structure realistic payment plans and connect tenants to assistance.
- Create expedited tracks. Establish faster pathways for uncontested or narrowly disputed cases, with clear timelines and simplified procedures, while preserving access to counsel and judicial oversight.
- Work with the D.C. Courts to modernize court operations. Move to full e-filing, electronic notice (with safeguards), online scheduling, and virtual hearings where appropriate. Use data to track case duration, continuances, and outcomes, and to identify sources of delay.
Why it matters. Extended timelines are not tenant protections. They leave households in prolonged uncertainty, often with mounting debt, and in properties where maintenance is deferred. For small property owners (who supply much of the District’s lower-cost and rent-controlled housing), 18–24 month timelines function as a structural disincentive to remain in the market. Over time, this accelerates property sales, conversions, or unit withdrawal.
Other jurisdictions demonstrate that strong protections and timely resolution can coexist. New York City, which experienced similar issues with arrears,[291] combines right-to-counsel with case triage, early settlement practices, and electronic filing.[292] Minnesota requires an initial hearing within 10–14 days,[293] resolving many cases on first appearance when mediation is available. Some jurisdictions in Colorado use online dispute resolution platforms to facilitate agreements such as payment plans or move-out agreements before an in-person hearing, [294] with judicial oversight to ensure fairness.[295]
These systems prioritize clarity and timeliness: cases move toward repayment, dismissal, or move-out without prolonged uncertainty.
Impact. Aligning timelines with these practices would make the RENTAL Act’s early interventions meaningful. Cases that reach court would resolve in months rather than years. This would ensure arrears remain at manageable levels for the tenants, stabilize rental income for small owners, reduce building-level distress, and support the long-term viability of the District’s affordable housing stock while preserving the tenant protections that remain essential.
14. Fix the PUD risk
Problem. Planned Unit Developments (PUDs) were designed to enable the District’s most ambitious projects, delivering large numbers of market rate and affordable units, mixed-use buildings, higher density, and negotiated community benefits. Today, even projects that fully comply with zoning can face litigation and appeals that delay construction for months or years, increasing financing costs and introducing uncertainty. These risks have pushed many developers away from the PUD process. As a result, the city forgoes opportunities for additional density, affordable housing set-asides, and coordinated neighborhood improvements.[296]
Proposal. Modernize the PUD process to reduce procedural risk and align with peer-city practices:
- Codify timelines. Establish binding deadlines for each stage of review (setdowns, hearings, and final orders) and limit appeal timelines (e.g., 30–60 days), with automatic resolution if deadlines are missed. Similar reforms in Denver[297] and Arlington, VA[298] have sharply reduced variability in review durations.
- Narrow standing and discourage frivolous appeals. Limit standing to parties demonstrating concrete, site-specific harm, as in Phoenix[299] and Raleigh.[300] Consider requiring bonds[301] or “loser pays” provisions for abusive claims.[302]
- Front-load community engagement. Require structured early engagement to surface issues before formal hearings, modeled on Seattle[303] and Denver, and clarify the “great weight” of ANC input within statutory planning priorities.
- Clarify approval standards. Publish clear, codified guidance on community benefits, design flexibility, and mitigation requirements, consistent with practices in Arlington and Phoenix.
Why it matters: PUDs remain one of the few tools capable of delivering large-scale housing, mixed-use development, and meaningful public benefits. When timelines are unpredictable and litigation risk is high, capital shifts elsewhere and projects are scaled back to by-right alternatives[304] that produce fewer units and fewer benefits. Peer cities including Denver,[305] Raleigh,[306] Phoenix,[307] Seattle,[308] and Arlington[309] have addressed these risks through defined timelines, clearer standards, and tracked performance metrics. The District’s system remains comparatively open-ended, increasing exposure to delay and process-driven negative outcomes.
Impact: A more predictable PUD process would expand the city’s development pipeline and improve project feasibility. Developers report that delays can add $50,000 to $75,000 per unit in carrying costs on large projects.[310] Reducing uncertainty and restoring use of PUDs would lower costs,[311] attract more investment, and increase the number of projects that deliver additional density and affordable housing. It would also better align development with the Comprehensive Plan, directing growth toward transit-served corridors and mixed-use nodes.
15. Recalibrate property assessments for affordable housing
Problem: The District frequently assesses income-restricted housing as if it generates market rents, resulting in inflated tax liabilities. This issue is most acute when mission-driven owners acquire market-rate buildings and place them under affordability covenants. In these cases, assessments continue to rely on market comparables and generic pro formas, with limited recognition of binding constraints such as recorded rent caps, income limits, and regulatory agreements that determine actual revenue. The two-year lookback, which bases current assessments on income and expenses from two years prior, further delays recognition of newly imposed affordability.
The District lacks a transparent, codified framework requiring assessors to value properties based on regulated income rather than hypothetical market performance. For-profit–owned affordable housing is not tax-exempt in the District, and the Office of Tax and Revenue provides no clear methodology for valuing properties with long-term covenants such as LIHTC. There is no requirement to adjust assessed value for restricted rents or operating constraints, and property classifications do not distinguish income-restricted from market-rate housing. A review of covenanted properties[312] shows they are assessed as market-rate apartments.
Proposal: Require income-restricted housing to be assessed based on the income it generates.
- Treat restrictions as binding. Assessors should explicitly incorporate rent caps, income limits, utility allowances, and regulatory covenants, including for newly acquired properties without operating history.
- Standardize underwriting. Align assumptions on expenses, vacancy, reserves, and NOI with actual affordable housing performance.
- Use tailored models. Develop valuation templates for LIHTC properties, project-based voucher buildings, senior housing, and mixed-income developments with deeded covenants.
Why this matters: Assessing affordable housing as if it generates market rents undermines the District’s own investments from HPTF, LRSP, tax abatements, and IZ. When tax bills assume the existence of revenue that cannot be earned, they erode subsidy, strain reserves, and increase the need for additional public funding at recapitalization. Other jurisdictions including California,[313] Texas, [314] Colorado, [315] and Vermont[316] now require valuation based on restricted income.
Impact. Aligning assessments with regulated rents would improve recapitalization outcomes (especially for LIHTC Year 15 and Year 30 properties), reduce appeals and administrative burden, stabilize operations, and strengthen long-term affordability at a minimal fiscal cost.
16. Reduce utility and public space exactions on private projects
Problem. In the District, private development is often required to fund and deliver public infrastructure as a condition of approval: rebuilding sidewalks, replacing sewer laterals, installing streetlights, abandoning vaults, and posting large refundable deposits. These requirements are frequently only loosely tied to a project’s actual impact, shifting the cost of public infrastructure onto individual developments.
Proposal. Rebalance responsibilities so public infrastructure is treated as a public function:
- Return baseline responsibilities for sidewalks, standard streetlights, and routine utility work to public agencies, reserving developer obligations for clearly documented, project-specific impacts.
- Standardize cost-sharing so developers pay only their proportional share of upgrades directly attributable to their projects.
- Reform deposit practices by capping amounts, setting firm timelines for reconciliation and refunds, and publishing status transparently.
- Integrate routine upgrades into the District’s capital planning process rather than attaching them to individual permits.
Why this matters. Unpredictable and project-specific exactions increase costs and risk, with the greatest impact on smaller developments that cannot absorb them. Other cities are moving public infrastructure from private to government responsibility. Seattle is advancing legislation to shift the cost of extending water, sewer, and stormwater infrastructure to shared funding models to remove barriers to housing.[317] Portland’s Code Alignment Project has paused frontage requirements for many smaller projects[318] and Portland Bureau of Transportation is narrowing mandates where occupancy does not increase.[319] Denver now funds sidewalk construction and repair through a citywide program supported by a modest annual fee (about $150 per property), rather than imposing costs on individual projects.[320] Minneapolis uses its Capital Improvement Program and a 20-year funding plan to deliver street upgrades systematically,[321] while Chicago sets consistent right-of-way standards and delivers typical improvements through public programs. [322] These approaches recognize sidewalks, utilities, and streetscape as shared infrastructure, not obligations assigned to whichever project happens to move forward.
Impact. Rebalancing public-space and utility obligations would lower costs and improve predictability, bringing transparency to what infrastructure projects will be responsible for on their development sites.
17. Align historic preservation with housing goals
Problem. Historic preservation is intended to protect truly significant buildings and places. In the District, it often functions as a constraint on growth. Review processes add time, cost, and uncertainty, even for modest additions or interior changes. Additionally, they lock low-density patterns into some of the city’s highest-opportunity neighborhoods.[323]
More than 28,000 properties are located in historic districts: about one in five buildings citywide, including roughly 17 percent of residential buildings and home to 22 percent of residents.[324] These districts are concentrated in Wards 2 and 6 including neighborhoods with the strongest access to jobs, transit, and amenities, and the greatest constraints on new housing, like Georgetown,[325] Capitol Hill, and Dupont.[326]
Historic designation slows housing growth. Between 2006 and 2021, non-historic areas added 13.1 percent more buildings and saw 27.3 percent growth in assessed value from new construction. Historic districts added only 4 percent more buildings, with new development contributing just 10 percent of value growth. The constraints fall most heavily on small-scale infill. While only 6.6 percent of residential properties are conversions, 61 percent of these buildings are in historic districts.[327]
Proposal. Refocus historic designation to its core purpose and introduce more flexible tools elsewhere:
- Tighten designation criteria. Amend the Historic Landmark and Historic District Protection Act to limit designations to buildings or areas of clear, demonstrable significance, and require the Historic Preservation Review Board (HPRB) and the Mayor’s Agent to consider housing, equity, climate, and Comprehensive Plan goals alongside historic value. [328]
- Limit expansion and set targets. Establish a citywide historic preservation strategy with defined priorities and guardrails. For example, cap the share of residential buildings under full historic control in each ward absent Council approval.
- Create conservation districts. Use lighter-touch overlays that protect façades and streetscapes while allowing interior densification, rear additions, and greater material flexibility.[329] Replace subjective review with objective standards.
- Align with zoning capacity. Enact the Housing Capacity Preservation Amendment Act of 2025[330] to ensure preservation review cannot reduce density below what zoning permits.[331] Apply this principle to additions and partial demolitions.
- Standardize approvals. Develop pattern books for common building types like rowhouse additions, pop-backs, and alley units to streamline approval for compliant projects. Fast-track or exempt basement conversions, ADUs, alley dwellings, and minor exterior work.
- Modernize materials and retrofits. Expand allowable materials and establish by-right rules for windows, insulation, solar, and electrification that is consistent with federal guidance linking preservation with housing and climate goals.[332]
- Rebalance governance. Ensure that the HPRB includes members with expertise in housing, economics, and climate. Require clear disclosure and consent from affected owners and residents before creating or expanding historic districts. Periodically reevaluate and reauthorize existing districts.
Why it matters. Preservation decisions today operate largely apart from housing, equity, and climate considerations, even as they shape access to the city’s most connected neighborhoods. District designations can function as de facto moratoria, and ongoing design controls raise costs and discourage improvements, especially for small owners. This structure effectively freezes some of the District’s most opportunity-rich areas in a low-density, high-cost pattern and pushes growth into a handful of non-historic corridors. Alternatively, Los Angeles’s adaptive reuse program, California’s ADU reforms, and Portland’s evolving conservation tools show that it is possible to protect defining features while allowing more housing.
Impact. A targeted and flexible preservation framework would unlock housing capacity in high-opportunity areas without sacrificing character. Rowhouses could accommodate additional units through conversions and ADUs. Modest additions such as rear expansions or set-back floors in historic districts could proceed without prolonged review. Buildings could be retrofitted for energy efficiency without case-by-case negotiation. Over time, this would allow more housing to be delivered where demand is strongest, distribute growth more evenly across the city, and better align preservation with the District’s housing and climate goals.
18. Rethink heritage tree requirements in conjunction with housing goals
Problem. The District’s heritage tree protections are among the strongest in the country. They have helped preserve canopy, but in practice they can also prevent housing from being built on otherwise developable lots.
Under the Urban Forest Preservation Act, healthy “heritage trees” (≥100 inches in circumference) are effectively non-removable, while “special trees” trigger substantial per-inch fees. These requirements are now tightly embedded in the permitting process: Tree Preservation Plans gate approvals, and compliance shapes both timelines and contractor risk.
On larger sites, this adds cost and uncertainty and can reduce unit counts.[333] On small infill, alley, or corner lots, the effect is more absolute. A single heritage tree and its critical root zone can eliminate the entire buildable area. While zoning and height limits remain the primary constraints on supply, in these cases tree rules can determine whether housing is possible at all.
Proposal. Preserve canopy while restoring reasonable use of land:
- Create a reasonable-use safety valve. Allow conditional removal of heritage trees on small residential and designated infill lots where retention would preclude housing. Require a transparent hardship process and demonstration that design alternatives were considered.[334]
- Shift to performance-based standards. Move from absolute prohibitions to a canopy-based framework that allows removal in exchange for meaningful mitigation such as replacement plantings, canopy-equivalent requirements, or calibrated contributions to the Tree Fund.
- Pair preservation with housing incentives. Offer modest zoning or process benefits such as additional height, lot coverage, parking relief, or expedited review for projects that retain mature trees, recognizing canopy as a public benefit.
- Improve targeting and transparency. Focus enforcement on significant violations, provide pathways to resolve technical violations, and publish annual data on how tree requirements affect project design, scale, and feasibility.
Why it matters. Current rules apply the same standard to a large institutional site and a 2,000–3,000 square-foot infill lot. That approach can block housing in precisely the locations where demand is highest and land is scarce.
Other jurisdictions have adopted more balanced models. Cities such as Austin[335] and municipalities in New Jersey[336] use “reasonable use” exceptions and mitigation formulas to allow constrained lots to be developed while still maintaining or expanding canopy. Research shows that while preservation rules can support tree coverage, rigid removal prohibitions are less effective than approaches that combine protection with incentives and performance standards.[337]
Impact. A more flexible framework would protect the District’s canopy while reducing avoidable barriers to housing. Reasonable-use provisions would prevent a single tree from rendering an entire lot unusable, performance-based mitigation would maintain or expand canopy over time, and incentives would encourage tree retention where feasible. Together, these changes would balance tree canopy protection with housing goals.
19. Create a housing feasibility board to improve housing delivery and operation
Problem. Beyond zoning and building codes, housing providers must navigate a growing stack of requirements: net-zero and related climate mandates,[338] Building Energy Performance Standards (BEPS), EV-charging requirements,[339] façade and design standards,[340] limits on gas appliances,[341] professional licensing requirements that raise labor costs,[342] and lower thresholds for Project Labor Agreements on subsidized projects.[343] Each may be defensible on its own, but in combination they increase costs, add complexity, and slow production. Without addressing this cumulative burden, efforts to expand housing supply will fall short.
Proposal. Establish a standing Housing Feasibility Review Board with a clear charge: reduce the cost of delivering compliant multifamily housing while maintaining core safety and environmental outcomes. The Board would:
- Conduct ongoing reviews of housing codes, zoning, and housing-related regulations to assess their impact on project feasibility.
- Recommend repeal, simplification, or consolidation of outdated or duplicative requirements.
- Apply a cost–benefit standard to new regulations, explicitly evaluating effects on housing production, preservation, and cost.
Why it matters. Other jurisdictions have institutionalized this kind of discipline. States and cities including Colorado,[344] Montana,[345] Arizona,[346] Washington State,[347] Massachusetts,[348] and New York City[349] have created task forces or statutory review processes to identify regulatory barriers and assess housing impacts. Without a comparable mechanism, the District continues to layer requirements that, in aggregate, make multifamily and affordable housing harder to finance.
Impact. A standing feasibility review would improve predictability and reduce avoidable costs while preserving essential protections. Even modest reductions in cumulative regulatory burden could expand the number of financially viable multifamily and mixed-income projects; improve the feasibility of preserving and rehabilitating older buildings; strengthen the District’s competitiveness for private investment; and align the city’s regulatory framework more closely with its housing and affordability goals.
Pillar IV – Align subsidies with high-value public outcomes
Traditional affordable housing policy focusses funding on capital subsidies for new construction, an approach that delivers relatively few units, over long timelines, and often at per-unit costs much higher than market rate. Affordable projects also face the same delays, uncertainties, and cost pressures as the broader housing market. The result is a system where public dollars work hard, but not efficiently, and do little to change the conditions that make housing expensive in the first place.
When the city invests in housing, it should pursue two objectives. First, produce the greatest possible number of affordable homes, as quickly as possible, across the widest range of neighborhoods. Second, build a regulatory environment where projects move predictably and at lower cost, so each dollar stretches further and future projects become easier to deliver.
The city can produce significantly more units by preserving and creating affordability within the existing housing stock, while making it easier to produce new market rate construction. That means prioritizing tools that scale (preservation, rent buy-downs, and targeted subsidies) while ensuring that subsidized projects are built in environments that allow housing to move quickly and predictably. Revenue generated from increased housing production can be used to preserve affordable housing in existing buildings at a fraction of the cost of new construction.
This pillar outlines how the District can use its housing investments to create affordability today and improve the system that will determine affordability tomorrow. These strategies share common advantages of speed, cost-effectiveness, and geographic flexibility that make them particularly effective tools to deliver affordable housing.
20. Use preservation as a primary affordability strategy
Problem. Creating covenants on units in existing buildings (what we will call preservation) can create affordable housing relatively quickly at minimal cost. Acquisition and rehabilitation projects typically cost between $100,000 to $300,000,[350] up to 45 percent less than new development.[351] In addition to cost savings, affordable units can be created through preservation in a matter of weeks or months.[352]
Proposal. Reorient the Housing Production Trust Fund (HPTF) to treat preservation as a core strategy to create new affordable units:
- Create pathways for nonprofit acquisition. Provide grants and low-cost financing to mission-driven organizations to acquire existing buildings and place long-term affordability covenants, focusing on naturally occurring affordable housing and aging rent-controlled stock.
- Invest in early intervention. Identify buildings at risk of deterioration and conversion and intervene before conditions worsen or units are lost.
- Simplify financing. Develop standardized financial preservation packages that combine acquisition loans, rehabilitation support, and operating subsidies to reduce transaction costs and timelines.
- Compete on outcomes, not project type. Evaluate all HPTF applications including preservation and new construction on a common standard: units delivered, cost per unit, and location.[353]
- Pair with reforms to increase supply. In supply-constrained neighborhoods, preservation can be perceived as locking in scarcity rather than relieving it. This concern is especially acute for rent-controlled buildings, which are both strong candidates for preservation and part of a limited housing stock that residents already view as under pressure. Without a parallel increase in overall housing production, preservation efforts can generate anxiety that scarce units are being further restricted rather than expanded. Framing preservation as part of a broader strategy that also increases supply is essential to maintaining public support and ensuring that these interventions are seen as additive, not zero-sum.
Why it matters. Creating affordable housing through preservation of existing housing costs a fraction of new construction. Redirecting resources toward preservation stretches public dollars further, produces more affordable units, reaches neighborhoods where new development is not possible, and can be completed in much less time than new construction. Rehabilitation also preserves neighborhood stability, keeping existing buildings affordable to households earning below area median income. Finally, preservation can create new affordability in neighborhoods where there is little new construction and create mixed income buildings.
Impact. A stronger preservation strategy would slow the loss of existing affordable housing, reduce displacement, and improve the condition of aging buildings. It would also increase the number of affordable units delivered per public dollar, allowing the District to achieve greater scale with existing resources.
21. Replace Inclusionary Zoning with rent-buydowns in existing buildings
Problem. Inclusionary zoning (IZ) produces limited results at high cost. Over 17 years, the program has delivered fewer than 300 affordable units annually,[354] a small share of what is needed to stabilize rents or meet the needs of low-income households. At the same time, IZ adds complexity, delays lease-up, and increases housing costs. In practice, it functions as a tax on new housing which can suppress production, especially in weaker markets or during downturns.
Proposal. Phase out mandatory IZ and replace it with a rent buy-down model:[355]
- Use public funds to buy down rents in existing housing. Directly subsidize rents in existing market-rate units in exchange for long-term affordability covenants.[356] This approach could be scaled up across the city, reaching desired housing goals for unit counts and affordability levels. D.C. Policy center modeling suggests that, for example, an $85 million annual investment could support roughly 3,000 units at 50 percent of AMI over five years.[357],[358]
- Replace IZ with flexible value capture. Where additional density is granted, allow flexible contributions based on clear rules. Allow owners exit their IZ obligation in exchange for a predictable payment (e.g., fees or higher taxes). The District can then use the increased tax revenue to fund operational subsidies and rent-buydowns, delivering affordability more efficiently than the IZ program. This delivers more predictability to owners, a revenue stream for housing subsidies, and additional affordable units. As an opt-in system, owners that would like to maintain current IZ obligations can continue to do so.[359]
- Protect housing production while transitioning out of IZ:
- As IZ is phased out, reduce set-asides in areas where construction activity is low. Specifically, in moderate markets, reduce set-aside requirements to 6-8 percent. In weak markets with limited recent development, reduce requirements to 4-6 percent or waive them entirely to avoid choking off the limited supply that can be built.[360]
- Suspend requirements altogether when permits fall under a certain threshold. Automatically suspend IZ requirements for a year if quarterly permits for multifamily residential units fall below 625 units for two consecutive quarters (2,500 annually). When permits rise above 750 units quarterly (3,000 annually) for two consecutive quarters, IZ could resume. This would create a clear, predictable framework that protects supply during downturns without requiring discretionary political decisions.[361]
Why it matters. IZ is often treated as a free source of affordable housing since it does not require public subsidies, but when requirements exceed what projects can support, the result is fewer homes, fewer affordable units, and higher market rents.[362] For this reason, several jurisdictions have scaled back their IZ program, or are actively considering doing so.[363] The District’s affordability challenge is one of scale, speed, and geography, and IZ is poorly suited to meet it. A rent buy-down model would allow the city to act quickly, reach more households, and expand affordability across more neighborhoods. It shifts resources away from a small number of new projects to the broader housing stock.
Impact. Economic analysis shows that IZ costs are primarily borne by future residents through higher market-rate rents and higher housing prices, not by developers.[364] These consequences are especially evident in high-cost, highly regulated markets like D.C. where projects already struggle with high land costs, construction costs, and layered regulation. Replacing IZ with rent buydowns could deliver units at greater speed, in more areas of D.C., for minimal cost.
22. Improve the administration of existing Inclusionary Zoning (IZ) units
Problem. The District is not using its existing IZ units effectively. Current DHCD administration creates delays, prolonged vacancy, and differs from established federal practices in rent setting, utility allowances, and income certification. Lease-up is slow, processes are burdensome for both tenants and owners, and agency processes leave units empty.
Proposal. Modernize IZ administration and align it with proven federal models:
- Streamline advertisement and income verification by amending IZ regulations to permit owner-driven certification modeled on LIHTC compliance procedures. Owner-driven income verification would reduce average lease-up times from 13 months[365] to 30-60 days. Property owners would identify qualifying tenants and verify tenant income and household size at initial occupancy and annually thereafter, maintaining documentation subject to DHCD audit. DHCD would conduct annual desk reviews of a sample of certifications and on-site audits of 10-15 percent of properties annually, rather than managing every individual income verification and lease offer. This would dramatically reduce lease-up times while maintaining program integrity.[366] Additionally, this could increase public knowledge of and access to IZ units.[367]
- Align rents and utility allowances with federal allowances. Adopt federal standards for rents[368] and utility allowances, including building-specific energy modeling. IZ rent ceilings are calculated by subtracting estimated utility costs from allowed housing costs, but the city uses pre-determined utility rates instead of building-specific utility data. For energy efficient buildings, the formula dramatically overstates what tenants pay in utilities, and that overstatement is deducted from the rent the owner is permitted to charge. The tenant’s actual total housing cost ends up well below the affordability threshold the formula was designed to enforce, while the owner absorbs the difference as a direct financial loss. Allowing energy modeling would incentivize energy efficiency improvements, lower utility payments, and increase financial viability of projects.[369]
- Allow flexibility on designated MFI levels, if affordability targets are met. Units can be designated at any affordability level between 30 percent MFI and 80 percent MFI, as long as the combined average stays at or below 60 percent MFI. If all units are locked at the 60 percent MFI level, then only households who make $68,000 per year are served, and it is more difficult to fill units. This approach serves households with varying incomes and gives housing providers flexibility which can help with leasing, feasibility, and financing.[370]
Why it matters. Existing units are underutilized due to administrative processes. Faster lease-up, simpler processes, and rules that reflect how buildings operate would increase the number of households served.
Impact. Administrative reform would reduce vacancies and shorten lease-up timelines, lower burdens on tenants and housing providers, and better align program outcomes with affordability goals.
23. Modernize the Local Rent Supplement Program to improve targeting and long-term fiscal sustainability
Problem. The Local Rent Supplement Program (LRSP) has become the District’s primary tool for delivering deeply affordable housing (30 percent AMI), but its goals are not clearly defined or consistently operationalized. In practice, the program is expected to do three things at once: provide deep affordability to the lowest-income households, create housing for residents experiencing homelessness (Permanent Supportive Housing), and expand access to high-opportunity neighborhoods. These are all valid goals, but they pull the program in different directions. This rapidly increases costs and puts the program on weak financial footing.[371]
Proposal. The District should explicitly define what LRSP is meant to achieve and align program rules, funding allocations, and performance metrics accordingly. This requires moving from a uniform program design to a more intentional framework:
- Define and prioritize core objectives. Establish clear targets for (a) depth of affordability, (b) homelessness services, and (c) geographic access. Make tradeoffs explicit: for example, whether deeper subsidies for fewer households are preferred over broader coverage with lower subsidy amounts.[372],[373]
- Segment the program by purpose. Create distinct program tracks or funding pools aligned to different goals (e.g., deeply subsidized units for extremely low-income households; mobility-focused vouchers for access to high-opportunity areas), rather than relying on a single structure to serve all objectives.
- Align subsidy design with intended outcomes. Use payment standards,[374] tenant contributions, and contract structures as tools to achieve defined goals, whether that is maximizing reach, enabling mobility, or ensuring long-term stability.
- Establish performance metrics tied to outcomes. Track cost per household served, neighborhood access, duration of tenancy, and placement rates, and use these metrics to guide program adjustments over time.
- Improve transparency and predictability. Provide clearer reporting on how funds are allocated across goals and how program outcomes change relative to costs.
Why it matters. LRSP is too important and too costly to operate without a clear theory of success. When goals are implicit, costs become the only visible metric, and policy debates focus on spending levels rather than outcomes. By making objectives explicit, the District can better manage tradeoffs, improve accountability, and ensure that each dollar advances a defined purpose.
Impact. A more intentional LRSP would improve alignment between spending and outcomes, allow policymakers to make clearer tradeoffs between depth, breadth, and location, increase the number of households served relative to available resources, and strengthen the program’s long-term fiscal and policy credibility.
24. Condition local housing subsidies on regulatory streamlining.
Problem. Publicly subsidized housing is being delivered within a system that is slow, complex, and costly. Projects that receive substantial public support are still subject to discretionary reviews, uncertain timelines, and layered requirements that increase costs and delay delivery. As a result, some portion of subsidies just compensate for regulatory barriers rather than to expand housing capacity.
Projects that receive public subsidies should be built with the least amount of restrictions and frictions to reduce time to market and costs to the taxpayers. When the city invests public funds, it should also address the underlying constraints that make housing difficult to build and operate, so public spending increases capacity rather than compensating for its absence.
There is precedent for linking subsidies to reforms: the 2021 Bipartisan Infrastructure Investment and Jobs Act[375] and the Building Opportunity program[376] ties federal subsidies to the adoption of by-right zoning, increased density near transit, and streamlined permitting. Similarly, Salt Lake City’s Affordable Housing Incentives gives affordable housing projects regulatory relief, including by-right approvals, reduced parking requirements, and expedited permitting.[377]
Proposal. For projects receiving public support:
- Allow additional density by right. Permit development up to Height of Buildings Act of 1910 limits without additional zoning approvals.
- Eliminate discretionary design review.[378] Limit review to basic code compliance and objective standards.
- Guarantee predictable timelines. Establish firm permitting deadlines, require automatic approval if deadlines are missed, and eliminate pre-permit processes that delay filings.
- Limit off-site requirements. Restrict obligations to standard impact mitigation and prohibit additional discretionary conditions.
- Evaluate outcomes. Conduct a comparative assessment after three years to measure impacts on cost, timelines, and production.
Why it matters. Worsening economic conditions and fiscal strains on the budget will make it increasingly more difficult for publicly funded projects to pencil out and secure needed subsidies. Linking subsidies to regulatory reform addresses this problem directly. It ensures that public dollars are used in an environment where projects can move quickly and predictably, reducing per-unit costs and stretching limited resources further. It also helps restore construction activity by lowering risk and improving feasibility, particularly for projects that would not otherwise move forward.
Additionally, subsidized projects can serve as a model for the effects of regulatory reform. By demonstrating that streamlined approvals reduce costs and timelines without compromising outcomes, the city can build the case for broader reform. This is especially important at a time when both fiscal capacity and private market activity are under pressure.
Impact. This approach shifts subsidies from compensating for inefficiencies to reducing them. It lowers development costs, shortens delivery timelines, and increases the number of units that can be produced with available funding. It also improves project feasibility, supports increased housing construction, and creates a pathway for broader regulatory reform that benefits both subsidized and market-rate housing.
25. Restructure governance to reflect housing as economic development
Problem. The District’s housing system is organized across agencies with different missions, timelines, and incentives. Planning, land disposition, subsidy allocation, financing, public housing, and homelessness-related housing all sit in separate silos. At a deeper level, housing is still treated as a social program rather than as economic infrastructure, despite its central role in shaping growth, competitiveness, and fiscal stability.
Proposal. Create a unified Housing and Growth platform by consolidating production functions while preserving clear institutional boundaries:
- Eliminate DHCD as a standalone agency. Fold its production, preservation, homeownership, neighborhood investment, and property disposition functions into an expanded DMPED, reconstituted as a Department of Housing and Economic Development.
- Keep OP independent but operationally aligned. Tie zoning, the Comprehensive Plan, and DC 2050 implementation directly to housing production and capacity targets.
- Keep DCHFA separate in law, integrated in practice. Maintain its bond and tax-credit role, but align underwriting, allocations, and project selection with a single production pipeline.
- Keep DCHA separate but contractually aligned. Preserve its federal structure, while requiring enforceable annual targets for voucher lease-up, preservation, and redevelopment.
- Separate tenant regulation from production. Place rent regulation, conversion/sale, and adjudication in a neutral regulatory structure outside the development chain. Separating tenant protections from production preserves independence where it matters, while allowing the development system to operate with clarity and speed.
Why it matters. Housing outcomes are a function of governance. Today, responsibility is diffuse, making it difficult to align land, subsidy, finance, and execution. A unified platform would allow the District to make coordinated decisions about where to grow, what to fund, and how to structure and sequence projects. It would also reflect a basic economic reality: housing supply shapes labor markets, business location decisions, and the city’s long-term tax base.
Peer models treat housing as part of growth strategy. Pennsylvania coordinates housing, community, and economic development functions through linked institutions.[379] New York state consolidates housing finance, regulation, and revitalization functions under a single structure.[380] Michigan’s housing development authority operates within the state’s broader economic development framework, aligning housing investment with workforce and growth objectives.[381]
The District is uniquely positioned to do this well. Because it functions as both a state and a locality, it can align housing, land use, and economic development within a single governance structure, something most jurisdictions cannot do without coordinating across multiple layers of government.
Impact. This reform would produce a system that is simpler, faster, and more accountable. More importantly, it would allow the District to treat housing as core economic infrastructure, managed through a single, coherent system rather than a collection of disconnected programs.
Section 7. Implementation strategy
The proposed reforms fall into three stages that reflect the ideal policy ordering: unlock supply, reduce costs, and then expand capacity for long-term growth while aligning subsidies. Reforms must move in parallel, but they rely on different tools, timelines, and parts of government. Their success depends on alignment across agencies, processes, and incentives around a single objective: strengthening the District’s capacity to deliver housing more predictably, efficiently, and at scale. Without that alignment, individual parts of the system will continue to work at cross-purposes, limiting overall impact. Layering new policies onto an unchanged system will reproduce the same scarcity–subsidy cycle, at increasingly higher cost.
Stage 1: Increase the pace of housing production (Immediate unlock, <1 year)
This set of reforms targets the most immediate constraint: delay and uncertainty in project delivery. It makes it easier to produce housing now under existing rules.
Key actions include:
- Permitting and approvals: faster, time-bound permitting (#6), and the option for third-party review (#7)
- Reducing project risk and exactions: decreasing PUD risk (#14) and lowering utility and public space requirements (#16)
- Targeted legislative fixes that affect feasibility and timelines: Reform BEPS (#12), shorten eviction timelines (#13), fix property tax assessments for affordable housing (#15), reform heritage tree requirements (#18), and improve IZ administration (#22)
- Governance and coordination: aligning historic review with housing goals (#17) and establishing a housing feasibility board (#19) to create system-wide accountability
The goal is to take as many immediate actions as possible to reduce delay, increase predictability, and allow projects already in the pipeline to move forward. These reforms offer the highest return in the shortest timeframe. They depend primarily on administrative action and targeted legislation and directly address the core bottleneck identified in the table: administrative fragmentation and delay.
Stage 2. Reduce costs and expand value (System cost reset, 1-2 years)
The second stage addresses the cost of housing production, making it cheaper to build and operate housing so supply can expand. At the same time, these reforms improve the effectiveness of subsidies, allowing public resources go further.
This stage includes two closely related sets of reforms:
- Code and regulatory alignment: Building code harmonization (#8), adoption of IEBC for conversions and additions (#9), small building energy code compliance pathways (#10), small building exceptions to net-zero and green requirements (#11).
- Subsidy reform: expanding preservation as a core affordability strategy (#20), replacing IZ with rent buy-downs (#21), reforming LRSP to improve efficiency and targeting (#23), and connecting structural reforms to subsidized projects (#24).
The core bottleneck addressed here is regulatory complexity and misalignment. The expected result is a structural shift to lower per-unit costs, expanded feasibility across more neighborhoods, and more effective use of subsidies. These reforms require more time because they involve technical standards, stakeholder engagement, and legislative action. Many can be advanced through planned building code updates and program redesign. Their effectiveness depends in part on Stage 1: as process frictions are reduced, cost reforms can translate more directly into improved feasibility.
Stage 3: Expand supply across the city (Zoning and land use reform, 2+ years)
The third stage addresses the foundation of the system: where and how much housing can be built, and how housing policy is governed over the long term.
This stage combines land use reform with a change in governance:
- Zoning and land use expansion: Expanding multifamily zoning (#1), eliminating parking minimums (#2), establishing uniform minimum lot sizes (#3), allowing additional height to federal limits (#4), and enabling infill, ADUs, and small-scale housing (#5).
- Governance change: Consolidating housing and economic development functions (#25).
These reforms require significant public engagement and political consensus. Many will be delivered through the Comprehensive Plan rewrite and related zoning actions. They take longer to implement, but their impact is decisive, determining whether the District can move from constrained, geographically concentrated growth to broad-based housing production across neighborhoods.
The core bottleneck is the political and process complexity of land use change. The expected outcome is large-scale supply growth and improved geographic distribution.
For the housing system to be successful, the District must track outcomes to ensure housing goals are met, opportunities for reform are identified, and issues are understood. These metrics should be aggregated and made publicly available on a semi-annual basis.
Section 8. Concluding thoughts
Washington, D.C. is no longer operating under the conditions that made its housing system workable. The supply expansion that lasted nearly 20 years is coming to an end and construction and permit activity has slowed sharply. Fiscal room is narrower and yet the policy framework the city relies on assumes that scarcity can be managed with more processes, more exceptions, and more subsidies. That approach is reaching its limit.
The central finding of this report is straightforward: The District’s housing outcomes are the result of a system that limits where housing can be built, increases the cost of producing and operating it, and then asks public subsidies to close the gap. Over time, that system has become more expensive, less responsive, and harder to sustain.
A housing system that produces slowly and at high cost makes it harder to retain families, attract workers, support employers, and preserve economic diversity. It also places growing pressure on the budget. As subsidy needs rise, the District must devote more resources to compensating for scarcity and fewer to other public priorities. Housing policy, in that sense, sits at the center of economic policy and fiscal policy.
To enable housing production and greater affordability, the District should first make it easier and cheaper to build and operate housing across more of the city. It should then use preservation and operating subsidies to protect existing housing and create new affordability: supporting households with the greatest need, and extending access to high-opportunity neighborhoods.
The recommendations in this report are designed to move the city in that direction. Some expand where housing is allowed. Some reduce costs created by permitting, code requirements, energy rules, and public-space processes. Some modernize landlord-tenant administration, tax assessments, and preservation policy. And some refocus subsidies on outcomes that are scalable and financially sustainable. Taken together, they do not ask the District to spend its way out of scarcity. They ask it to stop reproducing scarcity through policy.
Most of these proposals require capacity and institutional change, but they do not require large public subsidies. Their success depends on clearer priorities, more predictable timelines, better coordination across agencies, and a stronger capacity to deliver housing as part of the city’s economic strategy. The question is not whether the District cares about affordability. It clearly does. The question is whether it is prepared to build a housing system that can produce affordability more reliably and at lower public cost.
The District has the market demand, the transit infrastructure, and the fiscal interest to support a more productive housing system. What it lacks is a framework that treats housing growth as a citywide objective rather than a narrow exception. The next phase of housing policy should be judged by a simple standard: whether the city is producing more homes, in more neighborhoods, at lower cost, with public resources reserved for the households and places that need them most. This is both practical and consistent with affordability, inclusion, and long-term fiscal stability.
Glossary of terms
Bibliography
Abramson, B., & Landvoigt, T. (2025). Curbing Rising Housing Costs: A Model-Based Policy Comparison. Journal of Economic Perspectives, 39(3), 27–44. doi: 10.1257/JEP.20241427
Abu-Khalaf, A. (2023). Making It Happen: Scaling Accessory Dwelling Units. Retrieved from https://www.enterprisecommunity.org/sites/default/files/2023-10/2023-ADU-Issue-Brief-Scaling-Affordable-Housing-Solutions.pdf
Accelerator, N. (2023). Local Law 97 — Article 321. Retrieved from https://www1.nyc.gov/site/sustainablebuildings/ll97/local-law-97.page
AHF Staff. (2024, September 9). Neighborhood Development Co. to Shut Down After 25 Years. Housing Finance. Retrieved from https://www.housingfinance.com/news/neighborhood-development-co-to-shut-down-after-25-years_o
Allard, R. (2025, October 18). What happened to DC’s Residential Accessory Apartment Program? Greater Greater Washington. Retrieved from https://ggwash.org/view/100417/what-happened-to-dcs-residential-accessory-apartment-program
Alpert, D. (2018, February 28). Is anything old not “historic”? Preservation doesn’t have a good answer. Greater Greater Washington. Retrieved from https://ggwash.org/view/66597/is-anything-dc-not-historic-preservation-harrison-street-flats-friendship-heights
AOBA. (2024). A Looming Crises: The Residual Impacts of the COVID-19 Pandemic on Rent-Controlled and Market Rate Affordable Rental Housing in the District of Columbia. Retrieved from https://assets.noviams.com/novi-file-uploads/aoba/FINAL_-_DC_Report_-_June_-b6aade74.pdf
Arlington County, V. (2024). Site Plan Review Process. Retrieved from https://www.arlingtonva.us/Government/Programs/Building/Review-Processes/Site-Plan
Asquith, B. J., Mast, E., & Reed, D. (2019). Supply Shock Versus Demand Shock: The Local Effects of New Housing in Low-Income Areas. Upjohn Institute Working Papers. doi: 10.17848/wp19-316
Austermuhle, M. (2019, December 17). Low Skyline, High Prices: Would Taller Buildings Help Make Housing Cheaper In D.C.? . WAMU. Retrieved from https://wamu.org/story/19/12/17/low-skyline-high-prices-would-taller-buildings-help-make-housing-cheaper-in-d-c/
Baca, A., McAnaney, P., & Schuetz, J. (2019). “Gentle” density can save our neighborhoods. Retrieved from https://www.brookings.edu/articles/gentle-density-can-save-our-neighborhoods/
Bakshi Kathpalia, S. (2022). Updated: Database of D.C. Planned Unit Developments (PUDs). Retrieved from https://www.dcpolicycenter.org/publications/pud-database-2022-update/
Bakshi Kathpalia, S., & Sayin, Y. (2022). Do residential properties in D.C.’s historic districts outperform the rest of the city in value appreciation? Retrieved from https://www.dcpolicycenter.org/publications/historic-districts/
Banister, J. (2025, April 23). D.C. Housing Starts Drop 79% As Investors “Move Their Money Elsewhere.” Bisnow. Retrieved from https://www.bisnow.com/washington-dc/news/multifamily/dc-sees-79-decline-in-housing-starts-as-local-issues-push-investors-away-129057
Barr, J. (2025, December 22). Landlord losing money as tenant denies access in battle over Capitol Hill apartment. 7News. Retrieved from https://wjla.com/features/i-team/delinquent-tenant-denies-inspectors-access-in-battle-over-capitol-hill-apartment-vermont-senator-bernie-sanders-dc-department-of-buildings-washington-michele-watley-rich-bianco-jeffrey-levin
Bennett Jones. (2026, February 6). Inclusionary Zoning in Ontario: Ontario Moves to Pause Inclusionary Zoning Obligations. Retrieved from https://www.jdsupra.com/legalnews/inclusionary-zoning-in-ontario-ontario-7099065/
Bernstein, T. (2008, April). Municipal Green Building Policies: Strategies for Transforming Building Practices in the Private Sector . Environmental Law Institute. Retrieved from https://www.eli.org/research-report/municipal-green-building-policies-strategies-transforming-building-practices
Bipartisan Policy Center. (2023, September 21). Reducing Minimum Lot Sizes in Houston, Texas. Retrieved from https://bipartisanpolicy.org/article/reducing-minimum-lot-sizes-in-houston-texas/
Blount, D. C., Elder, K., Fu, S., Girod, K., Perez, J., & Pitkin, B. (2023a). Land Use Regulation and Approval Reforms. Urban Studies, 41(2), 317–340. doi: 10.1080/0042098032000165271
Blount, D. C., Elder, K., Fu, S., Girod, K., Perez, J., & Pitkin, B. (2023b). Land Use Regulation and Approval Reforms. Urban Studies, 41(2), 317–340. doi: 10.1080/0042098032000165271
Blumgart, J. (2022, May 26). How Important Was the Single-Family Zoning Ban in Minneapolis? Governing. Retrieved from https://www.governing.com/community/how-important-was-the-single-family-housing-ban-in-minneapolis
Borough of Fair Haven. (2024). Ordinance No. 2024-17. Retrieved from https://www.fairhavennj.org/sites/g/files/vyhlif4411/f/uploads/tree_ordinance_2024_0.pdf
Brey, J. (2025). This City Is Getting Serious About Sidewalks. Will Others Follow Suit? Governing. Retrieved from https://www.governing.com/infrastructure/this-city-is-getting-serious-about-sidewalks-will-others-follow-suit?
Bronin, S. C. (2024, May 9). Flexible New Historic Preservation Policies Support Housing and Climate Solutions. Planning Magazine. Retrieved from https://www.planning.org/planning/2024/may/flexible-new-historic-preservation-policies-support-housing-and-climate-solutions/
Brooks, L., & Schuetz, J. (2023, September 18). Where 20 years of new housing was built in Washington, DC—and where it wasn’t. Retrieved from https://www.brookings.edu/articles/where-20-years-of-new-housing-was-built-in-washington-dc-and-where-it-wasnt/
Building Industry Association of Washington. (2023, January 4). Permit delay costs escalate with rising interest rates. Retrieved from https://www.biaw.com/news/permit-delay-costs
Building Innovation Hub. (n.d.). DC Green Code Guide. Retrieved from https://buildinginnovationhub.org/resource/regulation-basics/dc-building-codes-updates/dc-green-code-guide/
Burton, E., Hendey, L., & Tatian, P. A. (2024a). Combating Rising Evictions in the District of Columbia with Housing Subsidies. Retrieved from https://www.urban.org/research/publication/combating-rising-evictions-district-columbia-housing-subsidies
Burton, E., Hendey, L., & Tatian, P. A. (2024b). Combating Rising Evictions in the District of Columbia with Housing Subsidies. Retrieved from https://www.urban.org/sites/default/files/2024-06/Combating_Rising_Evictions_in_the_District_of_Columbia_with_Housing_Subsidies.pdf
California Department of Housing and Community Development. (2025). Accessory Dwelling Unit Handbook. Retrieved from https://ahcd.assembly.ca.gov/system/files/2025-03/adu-handbook-update.pd
California State Fire Marshal. (2017, January 24). Automatic Residential Fire Sprinkler System Requirements for Accessory Dwelling Units. Information Bulletin 17-001 . Retrieved from https://www.hcd.ca.gov/policy-research/docs/fire-marshal-ib.pdf
Calma, E. (2026). Testimony before the DC Council Committee on Housing on B26-0597 – Housing Production Omnibus Amendment Act of 2026. Retrieved from https://www.dcpolicycenter.org/publications/housing-affordability-omnibus-2026/
CAP. (2024). Building Opportunity: Expanding Housing in America by Reforming Local Land Use – Center for American Progress. Retrieved from https://www.americanprogress.org/article/building-opportunity-expanding-housing-in-america-by-reforming-local-land-use/
Castaldi, M., & Patel, U. (2025). States Should Fund Rental Assistance as a Frontline Strategy to Address the Housing Affordability Crisis. Retrieved from https://www.cbpp.org/research/housing/states-should-fund-rental-assistance-as-a-frontline-strategy-to-address-the
Cawley, G. (2026, February 23). Boston city councilor calls for Mayor Wu to roll back affordability requirements stalling development. Boston Hearld. Retrieved from https://www.bostonherald.com/2026/02/23/boston-city-councilor-calls-for-mayor-wu-to-roll-back-affordability-requirements-stalling-development/
Chapple, K., Lieberworth, A., Ganetsos, D., Valchuis, E., Kwang, A., & Schten, R. (2020). ADUs in CA: A Revolution in Progress. Retrieved from https://www.aducalifornia.org/wp-content/uploads/2020/10/ADU-Progress-in-California-Report-October-Version.pdf
Citizens Budget Commission. (2022). Improving New York City’s Land Use Decision-Making Process |. Retrieved from https://cbcny.org/research/improving-new-york-citys-land-use-decision-making-process
City and County of Denver. (2025, October 11). Denver Zoning Code Art. 9.6 (as amended Aug. 11, 2025). 2025. Retrieved from https://www.denvergov.org/Government/Agencies-Departments-Offices/Agencies-Departments-Offices-Directory/Community-Planning-and-Development/Denver-Zoning-Code
City Council of Austin. (2010, February 4). Ordinance No. 20100204-28. Retrieved from https://services.austintexas.gov/edims/document.cfm?id=134292
City of Phoenix Planning & Development Department. (2023). Self-certification Program Overview. Retrieved from https://www.phoenix.gov/content/dam/phoenix/pddsite/documents/trt/external/dsd_trt_pdf_00653.pdf
City of Phoenix Planning and Development Department. (2025). PUD Procedures Outline. Retrieved from https://www.phoenix.gov/content/dam/phoenix/pddsite/documents/planning-zoning-zoning-rezoning/pud-procedures-outline.pdf
City of Seattle. (n.d.). Mandatory Housing Affordability – Housing. Retrieved from https://www.seattle.gov/housing/housing-developers/mandatory-housing-affordability
Cleveland Park Smart Growth. (2021, November 9). Demographics of DC’s Historic Districts. Retrieved from https://cpsmartgrowth.com/2021/11/09/demographics-of-dcs-historic-districts/
Committee on Transportation & the Environment. (2025). Fiscal year 2026 Committee Budget Report. Retrieved from https://dccouncil.gov/wp-content/uploads/2025/06/FY2026-DRAFT-TE-Committee-Budget-Report-with-Attachments-Circulation.pdf
Comprehensive and Neighborhood Planning Commission, C. of S. P. (2021). Parking Study: Proposed Amendments for “Parking Reductions” or “Full Elimination. Retrieved from https://www.stpaul.gov/sites/default/files/2021-03/Final%20Parking%20Memo-corrected%20all%20sections%20combined%20PC%2003.19.21.pdf
Cort, C. & McAnaney, P. (2019, March 20). What housing does the District’s workforce need? Greater Greater Washington. Retrieved from https://ggwash.org/view/71352/where-dc-needs-to-focus-its-workforce-housing-subsidies
Cort, C., & Pierson, K. (2021, March 23). DC homeowners get help to build accessory apartments. Greater Greater Washington. Retrieved from https://ggwash.org/view/80778/dc-homeowners-get-help-to-build-accessory-apartments
Cortright, J. (2016, October 20). Comparing the Price of Parking Across U.S. Cities. Streetblog USA. Retrieved from https://usa.streetsblog.org/2016/10/20/comparing-the-price-of-parking-across-u-s-cities?
Council of Economic Advisors. (2024, October 13). Reforming Permitting Requirements to Lower the Cost of Building New Housing and Increase Housing Affordability | CEA | The White House. Written Materials Blog. Retrieved from https://bidenwhitehouse.archives.gov/cea/written-materials/2024/08/13/reforming-permitting-requirements-to-lower-the-cost-of-building-new-housing-and-increase-housing-affordability/
Cuccia, A. (2022, June 24). There’s 40,000 People On The D.C. Housing Authority Waitlist. The DCist. Retrieved from https://dcist.com/story/22/06/24/dc-housing-authority-waitlist-voucher-funding/
DC BEPS Blog Series: An Introduction (Part 1) – Baumann Consulting. (n.d.). Retrieved from https://baumann-us.com/2022/03/24/dc-beps-blog-series-an-introduction-part-1/
DC Department of Buildings. (2023). Third-Party Program Procedural Manual. Retrieved from https://dob.dc.gov/sites/default/files/dc/sites/dob/Third-Party_Program_Procedure_Manual%205.8.2023%20.pdf
DC Department of Housing and Community Development. (2022). Request for Applications (RFA): Residential Accessory Apartments Program (RAAP) | dhcd. Retrieved from https://dhcd.dc.gov/publication/request-applications-rfa-residential-accessory-apartments-program-raap
DC Fiscal Policy Institute. (2012). Local Rent Supplement Program (LRSP) in the District of Columbia: Overview. Retrieved from https://www.dcfpi.org/wp-content/uploads/2009/03/6-14-12-LRSP-Final.pdf
DC Fiscal Policy Institute. (2016). The Local Rent Supplement Program. Retrieved from https://www.dcfpi.org/wp-content/uploads/2016/04/16-04-LRSP-Brief.pdf
DC Government. (2021, December 16). Mayor Bowser Unveils New Tools to Add Affordable Housing. Retrieved from https://mayor.dc.gov/release/mayor-bowser-unveils-new-tools-add-affordable-housing
DC Office of Planning. (n.d.). Historic Preservation Review Board. Retrieved from https://planning.dc.gov/page/historic-preservation-review-board
DC Office of Planning. (2018). Historic Preservation In Washington DC. Retrieved from https://dcpreservation.org/wp-content/uploads/2021/04/Historic-Preservation-101_Historic-Designation_Price.pdf
DC Office of Planning. (2020). Assessment of Commercial to Residential Conversions in the District of Columbia. Retrieved from https://planning.dc.gov/sites/default/files/dc/sites/op/page_content/attachments/Assessment%20of%20Commercial%20to%20Residential%20Conversions%20in%20the%20District%20of%20Columbia_Q2%202020.pdf
D.C Office of Revenue Analysis. (2026). Economic and Revenue Trend Reports, January 2026. Retrieved from https://ora-cfo.dc.gov/publication/economic-and-revenue-trend-reports-january-2026
D.C. Policy Center. (2020, April 10). History of rent control in the District of Columbia – D.C. Policy Center. Retrieved from https://www.dcpolicycenter.org/publications/history-rent-control-district-columbia/
DCHA. (2025, August 10). Payment Standard – District of Columbia Housing Authority. Retrieved from https://www.dchousing.org/wordpress/vouchers/payment-standard/
DCRA. (2012). Green Construction Code District of Columbia. Retrieved from https://dob.dc.gov/sites/default/files/dc/sites/dob/publication/attachments/2017%20DC%20Green%20Construction%20Code.pdf
DCSEU. (n.d.). Building Envelope Commissioning –. Building Innovation Hub. Retrieved from https://buildinginnovationhub.org/resource/regulation-basics/dc-building-codes-updates/building-envelopecommissioning/
DCSEU. (2020). DC Building Code Updates for Building Professionals. Retrieved from https://imt.org/resources/dc-building-code-updates-for-building-professionals/
DDOT Urban Forestry. (2023, July 28). Tree Canopy Preservation in Washington, DC. Retrieved from https://storymaps.arcgis.com/stories/c54a7c360324477f8b16a1812bf32905
Department of Housing and Community Development. (n.d.). Inclusionary Zoning (IZ) Affordable Housing Program. Retrieved from https://dhcd.dc.gov/service/inclusionary-zoning-iz-affordable-housing-program
Department of Housing and Community Development. (2024). Fiscal Year 2023 Housing Production Trust Fund Annual Report. Retrieved from https://dhcd.dc.gov/sites/default/files/dc/sites/dhcd/publication/attachments/FY%202023%20Housing%20Production%20Trust%20Fund%20%28HPTF%29%20Annual%20Report%20%28FINAL%29.pdf
Department of Housing and Community Development. (2025). Inclusionary Zoning Annual Report for Fiscal Year 2024.
Department of Housing and Community Development. (2026). Inclusionary Zoning Program 2026 Maximum Income, rent and purchase price schedule.
Destination DC. (2025). Green Facts You Didn’t Know About Washington, DC. The District Blog. Retrieved from https://washington.org/meetings/dc-green-facts
Dickinson, G. M., Walsh, K. M., Ensign, S. W., Lockwood, A. L., Ortmann, K. N., Schuyler, S., Schwartz, H. L., & Christon, D. J. (2010). New Hampshire Housing Finance Authority Board of Directors. Retrieved from https://www.nhhfa.org/wp-content/uploads/2019/06/Workforce_Housing_Guidebook.pdf
Dineen, J. K., & Waxmann, L. (2026, April 9). SF may cut affordable housing requirements to spur development, again. The San Francisco Chronicle. Retrieved from https://www.sfchronicle.com/realestate/article/affordable-housing-requirements-22194354.php
District of Columbia Government. (2016). Five Year Consolidated Plan: Fostering the Development of Strong, Equitable Neighborhoods. Retrieved from https://dhcd.dc.gov/sites/default/files/dc/sites/dhcd/publication/attachments/DRAFT%20FY%202016%20to%20FY%202020%20Consolidated%20Plan%206-27.pdf
District of Columbia Government. (2020). Building Code District of Columbia. Retrieved from https://dob.dc.gov/sites/default/files/dc/sites/dob/publication/attachments/2017%20District%20of%20Columbia%20Building%20Code_Part%201.pdf
DMPED. (2024). Protecting Affordable Housing.
DOEE. (2021, January 12). District Establishes New Energy Performance Standards for Buildings | doee. Retrieved from https://doee.dc.gov/release/district-establishes-new-energy-performance-standards-buildings
Dong, H. (2024). Exploring the Impacts of Zoning and Upzoning on Housing Development: A Quasi-experimental Analysis at the Parcel Level. Journal of Planning Education and Research, 44(1), 403–415. doi: 10.1177/0739456X21990728/SUPPL_FILE/SJ-DOCX-1-JPE-10.1177_0739456X21990728.DOCX
Edwards, C., & Brown Calder, V. (2017). Low-Income Housing Tax Credit: Costly, Complex, and Corruption-Prone (No. 79; Tax & Budget Bulletin).
Environmental Protection Agency. (2023, April 26). EPA Names 2023 Top Cities for ENERGY STAR Certified Buildings. Retrieved from https://www.epa.gov/newsreleases/epa-names-2023-top-cities-energy-star-certified-buildings
Envision Utah. (2025). Utah Resource and Infrastructure Housing Capacity Analysis CONTENTS. Retrieved from https://static1.squarespace.com/static/5c059ead36099b1445c1d246/t/68f11343a73090123fec8a94/176062957
Fanelli, J. (2026). New York City’s Looming Deficit Threatens to Curb Mamdani’s Ambitions. The Wall Street Journal. Retrieved from https://www.wsj.com/us-news/new-york-citys-looming-deficit-threatens-to-curb-mamdanis-ambitions-28d1490f
Fetter, D. K. (2016). The Home Front: Rent Control and the Rapid Wartime Increase in Home Ownership. The Journal of Economic History, 76(4), 1001–1043. doi: 10.1017/S0022050716001017
Flynn, M. (2023, October 8). Housing waiting list has dragged for years. Will change bring relief? The Washington Post. Retrieved from https://www.washingtonpost.com/dc-md-va/2023/04/26/dcha-housing-waiting-list/
Flynn, M., & Lang, M. J. (2023, October 8). Red tape means more than 3,100 D.C. housing vouchers are going unused – The Washington Post. The Washington Post. Retrieved from https://www.washingtonpost.com/dc-md-va/2023/10/08/dc-housing-voucher-delays/
Freddie Mac. (2025). Accessory Dwelling Units Key Borrower Benefits. Retrieved from https://sf.freddiemac.com/docs/pdf/fact-sheet/adu-fact-sheet.pdf
Freemark, Y., Brosy, T., & Maginn, T. (2026). Integrating Affordable Housing in Market-Rate Developments Approaches to Achieving Inclusionary Housing in Washington, DC. Retrieved from https://www.urban.org/sites/default/files/2026-01/Integrating%20Affordable%20Housing%20in%20Market-Rate%20Developments.pdf
Furman Center for Real Estate &Urban Policy, & The Institute for Affordable Housing Policy. (2012). Searching for the Right Spot: Minimum Parking Requirements and Housing Affordability in New York City. Retrieved from https://furmancenter.org/files/publications/furman_parking_requirements_policy_brief_3_21_12_final_1.pdf
Furth, S., & Coale, T. (2024). How to Streamline Housing Permitting in Maryland. Retrieved from https://www.mercatus.org/research/policy-briefs/how-streamline-housing-permitting-maryland
Furth, S., Hamilton, E., & Gardner, C. (2025). Housing Reform in the States: A Menu of Options for 2026. Retrieved from https://www.mercatus.org/research/policy-briefs/housing-reform-states-menu-options-2026
Furth, S., Vaz, M., & Artigue, C. (2025). How to Streamline Housing Permitting in Arizona. Retrieved from https://www.mercatus.org/research/policy-briefs/how-streamline-housing-permitting-arizona
Gabbe, C. J., Pierce, G., & Clowers, G. (2020). Parking policy: The effects of residential minimum parking requirements in Seattle. Land Use Policy, 91. doi: 10.1016/J.LANDUSEPOL.2019.104053
Gabriel, S., & Kung, E. (2024). Development Approval Timelines, Approval Uncertainty, and New Housing Supply: Evidence from Los Angeles. doi: 10.2139/SSRN.4872147
Gallaher, C. (2023, June 22). DC’s housing voucher program undermines rent control, but it doesn’t have to. Greater Greater Washington. Retrieved from https://ggwash.org/view/90031/dcs-housing-voucher-program-undermines-rent-control-but-it-doesnt-have-to
Garrett, L. (2023, May 10). Why DC’s Height Act may fall this time – WTOP News. WTOP News. Retrieved from https://wtop.com/dc/2023/05/why-dcs-height-act-may-fall-this-time/
Gathright, J. (2025a, February 12). D.C. mayor proposes permanent rollback of pandemic-era housing protections. The Washington Post. Retrieved from https://www.washingtonpost.com/dc-md-va/2025/02/12/dc-mayor-bowser-housing-bill-evictions/
Gathright, J. (2025b, October 16). Petra Management Group to pay $700K in rent-control lawsuit settlement. The Washington Post. Retrieved from https://www.washingtonpost.com/dc-md-va/2025/10/16/dc-petra-housing-voucher-lawsuit
Glaeser, E., & Gyourko, J. (2018). The Economic Implications of Housing Supply. Journal of Economic Perspectives, 32(1), 3–30. doi: 10.1257/JEP.32.1.3
Glaeser, E. L., Gyourko, J., & Saiz, A. (2008). Housing supply and housing bubbles. Journal of Urban Economics, 64(2), 198–217. doi: 10.1016/J.JUE.2008.07.007
Glaeser, E. L., Gyourko, J., & Saks, R. (2003). Why is Manhattan So Expensive? Regulation and the Rise in House Price (No. w10124). Retrieved from http://www.nber.org/papers/w10124
Glaeser, E. L., Schuetz, J., & Ward, B. (2006). Regulation and the Rise of Housing Prices in Greater Boston. Retrieved from https://www.hks.harvard.edu/sites/default/files/centers/rappaport/files/brief_housingregs.pdf
Gould, C. (2023). Parking Reform Legalized Most of the New Homes in Buffalo and Seattle. Retrieved from https://www.sightline.org/2023/04/13/parking-reform-legalized-most-of-the-new-homes-in-buffalo-and-seattle/
Gould Ellen, I., Graves, E., & Schuetz, J. (2020). Using a down market to launch affordable housing acquisition strategies. Retrieved from https://www.brookings.edu/wp-content/uploads/2020/07/BrookingsMetro_RecoveryWatchEssays_Affordable-Housing_FINAL.pdf
Gray, M. N. (2021). Rightsizing Lot-Size Rules in Metropolitan New York City. Retrieved from https://manhattan.institute/article/rightsizing-lot-size-rules-in-metropolitan-new-york-city
Gray, M. N., & Millsap, A. A. (2023). Subdividing the Unzoned City: An Analysis of the Causes and Effects of Houston’s 1998 Subdivision Reform. Journal of Planning Education and Research, 43(4), 990–1006. doi: 10.1177/0739456X20935156
Gyourko, J., & McCulloch, S. (2023). Minimum Lot Size Restrictions: Impacts on Urban Form and House Price at the Border. doi: 10.3386/W31710
Gyourko, J., & Molloy, R. (2014). Regulation and Housing Supply. Retrieved from http://www.nber.org/papers/w20536.ack
Gyourko, J., & Molloy, R. (2015). Regulation and Housing Supply. Handbook of Regional and Urban Economics, 5, 1289–1337. doi: 10.1016/B978-0-444-59531-7.00019-3
Hamilton, E. (2021a). Inclusionary Zoning and Housing Market Outcomes. Cityscape: A Journal of Policy Development and Research •, 23(1), 161–194. Retrieved from https://www.mercatus.org/research/working-papers/inclusionary-zoning-and-housing-market-outcomes
Hamilton, E. (2021b). Inclusionary Zoning Hurts More Than It Helps. Retrieved from https://www.mercatus.org/research/policy-briefs/inclusionary-zoning-hurts-more-it-helps
Hamilton, E. (2023). How DC densified. Works in Progress Magazine. Retrieved from https://worksinprogress.co/issue/how-dc-densified/
Hershberger, S. (2025, March 18). Washington, DC Accessory Dwelling Units . Four Brothers Design + Build. Retrieved from https://www.fourbrothersdc.com/services-process/washington-dc-accessory-dwelling-units
Hess, D. B., & Rehler, J. (2021). Minus Minimums: Development Response to the Removal of Minimum Parking Requirements in Buffalo (NY). Journal of the American Planning Association, 87(3), 396–408. doi: 10.1080/01944363.2020.1864225
Hoffman, E. (2023). LOCAL LAW 97 Compliance, Resources & Understanding Requirements. New York City. Retrieved from https://www.nyc.gov/assets/buildings/pdf/presentations/2023bsls/ll97.pdf
Hoffman, R. (2026, May 17). How Much Does an ADU Cost to Build? [2026 Data] . Angi. Retrieved from https://www.angi.com/articles/how-much-do-adu-costs.htm
Holland & Knight LLP. (2022). Application of CP VII Wardman 1-A, LLC and CP VII Wardman 1-B, LLC Square 2132, Part of Lot 32 (A&T Lots 855, 856). Retrieved from https://planning.dc.gov/sites/default/files/dc/sites/op/page_content/attachments/Wardman%20LTR%20Submission%20-%20Part%201.pdf
Horowitz, A., & Roche, T. (2023). Lot-Size Reform Unlocks Affordable Homeownership in Houston. Retrieved from https://www.pew.org/en/research-and-analysis/issue-briefs/2023/09/lot-size-reform-unlocks-affordable-homeownership-in-houston
Hoyt, H., & Schuetz, J. (2020a). Making apartments more affordable starts with understanding the costs of building them. Retrieved from https://www.brookings.edu/articles/making-apartments-more-affordable-starts-with-understanding-the-costs-of-building-them/
Hoyt, H., & Schuetz, J. (2020b). Parking requirements and foundations are driving up the cost of multifamily housing | Brookings. Retrieved from https://www.brookings.edu/articles/parking-requirements-and-foundations-are-driving-up-the-cost-of-multifamily-housing/
Huang, H., & Tang, Y. (2012). Residential land use regulation and the US housing price cycle between 2000 and 2009. Journal of Urban Economics, 71(1), 93–99. doi: 10.1016/J.JUE.2011.08.001
HUD. (2023). Office to Residential Conversions. Evidence Matters. doi: 10.1108/02630800911002611/FULL/HTML
HUD Open Data Site. (2025). Housing Choice Vouchers by Tract. Retrieved from https://hudgis-hud.opendata.arcgis.com/datasets/HUD::housing-choice-vouchers-by-tract/
Hughes, D. R. (2025, February 18). Changes Proposed to Historic Preservation Law to Protect Residential Density. Holland & Knight Insights. Retrieved from https://www.hklaw.com/en/insights/publications/2025/02/changes-proposed-to-historic-preservation-law-to-protect-residential
Huron, A. (2020). Defending Tenants in the Midst of Plague. Washington History, 32(1/2), 41–43. Retrieved from https://www.jstor.org/stable/26947516
Ihlanfeldt, K., & Mayock, T. (2009). Price discrimination in the housing market. Journal of Urban Economics, 66(2), 125–140. Retrieved from https://ideas.repec.org/a/eee/juecon/v66y2009i2p125-140.html
Institute for Market Transformation. (2011). Third-Party Plan Review: Successful strategies for improving compliance with building energy codes Code Compliance Strategies. Retrieved from https://imt.org/wp-content/uploads/2018/02/CaseStudy3.pdf
Interagency Council on Homelessness. (2021). Homeward DC 2.0: Interagency Council on Homelessness Strategic Plan FY2021-FY2025. Retrieved from https://dmhhs.dc.gov/sites/default/files/dc/sites/dmhhs/page_content/attachments/Homeward-DC-Report_FY2021-2025.pdf
Jagoda, D. (n.d.). Local Law 97: “Good Faith Efforts” Rules Update. Retrieved from https://imegcorp.com/insights/blog/local-law-97-good-faith-efforts-rules-update/
JPMorganChase Policy Center. (2025). Building Blocks: State and Local Opportunities to Increase Housing Supply. Retrieved from https://www.jpmorganchase.com/content/dam/jpmorganchase/documents/impact/state-and-local-housing-brief.pdf
Kober, E. (2022). How Large Cities Can Grow Denser and Flourish: What the 2020 Census Reveals About Urban Sprawl. Retrieved from https://manhattan.institute/article/how-large-cities-can-grow-denser-and-flourish-what-the-2020-census-reveals-about-urban-sprawl
Korber, A. (2025). RENTAL Act Red Flags: Rushing Evictions and Wiping Out Tenant Rights. Retrieved from https://www.legalaiddc.org/blogs/rental-act-red-flags-rushing-evictions-and-wiping-out-tenant-rights
LeaseRunner. (2025, October 1). Washington D.C. Eviction Process for Landlords (2025 Legal Guide). Retrieved from https://www.leaserunner.com/laws/eviction-process-in-district-of-columbia
Li, X. (2022). Do new housing units in your backyard raise your rents? Journal of Economic Geography, 22(6), 1309–1352. doi: 10.1093/JEG/LBAB034
Litman, T. (2014). Parking Requirement Impacts on Housing Affordability. Retrieved from www.vtpi.orgInfo@vtpi.org
Love Tomasso, A. (2025). Building Missing Middle Housing—Recommended Tools Beyond Policy Reform. Retrieved from https://www.jchs.harvard.edu/research-areas/working-papers/building-missing-middle-housing-recommended-tools-beyond-policy
Maclean, C., Golub, D. R., Ashe, K. J., Sterling, W., & Brundy, D. (2023, November 31). California’s 2024 Housing Laws: What You Need to Know | Insights . Retrieved from https://www.hklaw.com/en/insights/publications/2023/10/californias-2024-housing-laws-what-you-need-to-know
Manville, M., Monkkonen, P., Gray, N., & Phillips, S. (2023). Does Discretion Delay Development?: The Impact of Approval Pathways on Multifamily Housing’s Time to Permit. Journal of the American Planning Association, 89(3), 336–347. doi: 10.1080/01944363.2022.2106291
Martin, A. J. F., Fleming, A., & Conway, T. M. (2025). Protecting trees in the urban forest: a systematic review of literature on acts, bylaws, ordinances, and regulations. Https://Doi.Org/10.1139/Er-2024-0118, 33. doi: 10.1139/ER-2024-0118
Martone, M., & Guerriero, M. P. (2010). The Tax Credit Conundrum. Affordable Housing Finance. Retrieved from https://www.aptcnet.com/property-tax-resources/published-property-tax-articles/the-tax-credit-conundrum
Mast, E. (2023). JUE Insight: The effect of new market-rate housing construction on the low-income housing market. Journal of Urban Economics, 133, 103383. doi: 10.1016/J.JUE.2021.103383
McConnaughey, J. S. (1978). An Economic analysis of building code impacts: A suggested approach (No. 78–1525). Washington, D.C. Retrieved from https://www.govinfo.gov/content/pkg/GOVPUB-C13-b28fe59a27a1d80dff263263ffd47fb0/pdf/GOVPUB-C13-b28fe59a27a1d80dff263263ffd47fb0.pdf
McConnell, B., & Sayin, Y. (2023). Worker sprawl in the Washington metropolitan area: Is D.C. still the region’s job hub? Retrieved from https://www.dcpolicycenter.org/publications/worker-sprawl/
Milton, C. (2023, October 16). FHA Expands Access to Mortgage Financing for Homes with ADUs . National Association of Home Builders. Retrieved from https://www.nahb.org/blog/2023/10/fha-adu
Moravec, A. C. (2009). An analysis of planned unit development (PUD) regulations and processes in Washington, DC: a development risk management case study. doi: 10.17615/RJVG-BF11
National Apartment Association. (2021). NAA 2021 Survey of Operating Income & Expenses in Rental Apartment Communities. Retrieved from https://naahq.org/naa-2021-survey-operating-income-expenses-rental-apartment-communities
National Association of Home Builders. (2019). Fire Sprinkler Mandates – State-by-State Data. Retrieved from https://www.nahb.org/-/media/NAHB/advocacy/docs/top-priorities/codes/fire-sprinklers/fire-sprinkler-state-adoption-2019.pdf
National Low Income Housing Coalition. (2023, August 1). Local Rent Supplement Program (LRSP). Retrieved from https://nlihc.org/node/95681
National Low Income Housing Coalition. (2024, October 28). Tenant Screening Discrimination Case Settled in D.C. Retrieved from https://nlihc.org/resource/tenant-screening-discrimination-case-settled-dc
Office of Planning. (2013). Height Master Plan for the District of Columbia: Final Evaluation & Recommendations. Retrieved from https://www.ncpc.gov/heightstudy/docs/District%27s%20Height%20Master%20Plan%20FINAL%20Recommendations%20Report_Nov%2020%202013.pdf
Office of the Budget Director. (2024). D.C.’s Commitment to Affordable Housing. Retrieved from https://www.dccouncilbudget.com/dcs-commitment-to-affordable-housing
Office of the District of Columbia Auditor. (2024). Stronger DHCD Oversight Needed for Inclusionary Zoning Program to Reach Housing Goals. Retrieved from www.dcauditor.org
Office of the Mayor. (2025, April 23). Mayor Harrell Proposes Infrastructure Cost-Sharing Legislation to Remove Barriers to Housing and Growth – Office of the Mayor. Retrieved from https://harrell.seattle.gov/2025/04/23/mayor-harrell-proposes-infrastructure-cost-sharing-legislation-to-remove-barriers-to-housing-and-growth/
Oregon Department of Land Conservation and Development. (2020). Parking and Middle Housing: Analysis of Demand and Impacts-Implications for Middle Housing Rulemaking.
Paciorek, A. (2013). Supply constraints and housing market dynamics. Journal of Urban Economics, 77, 11–26. doi: 10.1016/J.JUE.2013.04.001
Panfil, Y., Reichman, J., Azinulbhai, S., & Bonnyman, H. (2025). An Analysis of DC Eviction Filings: June Through October 2025. Retrieved from https://www.newamerica.org/future-land-housing/briefs/dc-eviction-filings-june-through-october-2025/
Panfil, Y., Reichman, J., Zainulbhaj, S., & Bannyman, H. (2025). DC Eviction Filings: An Analysis of June Through October 2025. Retrieved from https://www.newamerica.org/insights/dc-eviction-filings-june-through-october-2025/
Pearlberg, K. (2018, February 15). Understanding Accessible, Type A, Type B, and Type C Units in the A117.1 Standard. ICC. Retrieved from https://www.iccsafe.org/building-safety-journal/bsj-technical/alphabet-soup-for-dwelling-and-sleeping-units-2/
Pennington, K. (2021). Does Building New Housing Cause Displacement?: The Supply and Demand Effects of Construction in San Francisco. In SSRN Electronic Journal. Elsevier BV. doi: 10.2139/SSRN.3867764
Peter, T. J. (2024). Achieving Housing Abundance through State and Local Land Use and Zoning Reform: How to Overcome Government Regulatory Failures to Enable the Market to Increase the Supply of Affordable Housing (Statement before the Joint Economic Committee). doi: 10.1016/j.jpubeco.2010.07.002
Peter, T., Tracy, J. S., & Pinto, E. J. (2025). A Critique of the Urban Institute’s Panel Study on Land Use Reforms to Impact Housing Supply: Evidence of Severe Methodological Gaps. Retrieved from https://www.aei.org/research-products/working-paper/a-critique-of-the-urban-institutes-panel-study-on-land-use-reforms-to-impact-housing-supply-evidence-of-severe-methodological-gaps/
Peters, B. (2025, July 18). Enterprise Community Partners seeks to sell D.C.-area portfolio. Washington Business Journal. Retrieved from https://www.bizjournals.com/washington/news/2025/07/18/enterprise-community-partners-affordable.html
Phillips, S. (2024). Modeling Inclusionary Zoning’s Impact on Housing Production in Los Angeles: Tradeoffs and Policy Implications. Retrieved from https://ternercenter.berkeley.edu/wp-content/uploads/2024/04/Inclusionary-Zoning-Paper-April-2024-Final.pdf
Pinto, E., & Tobias, P. (2023). How Government Policy Made Housing Expensive and Scarce, and How Unleashing Market Forces Can Address It. Cityscape, 25(3), 123–176. Retrieved from https://www.huduser.gov/portal/periodicals/cityscape/vol25num3/Cityscape-November-2023.pdf
Plerhoples Stacy, C., Morales-Burnett, J., Noble, E., Hodge, T., & Komarek, T. (2021). Inclusionary Zoning: How Different IZ Policies Affect Tenant, Landlord, and Developer Behaviors.
Portland.gov. (2025, September 24). Portland City Council Approves Temporary Code Suspensions to Improve Permitting Process. Retrieved from https://www.portland.gov/community-economic-dev/news/2025/9/24/portland-city-council-approves-temporary-code-suspensions-0
Price, G. (2019, October 17). The Grand Bargain, Illustrated . Viewpoint Vancouver. Retrieved from https://viewpointvancouver.ca/2019/10/17/the-grand-bargain-illustrated/
Prince George’s County Department of Permitting, I. and E. (2020). Third Party Inspection Manual. Retrieved from https://www.princegeorgescountymd.gov/sites/default/files/media-document/dcv4338_third-party-inspection-program-tpipmanual-pdf.pdf
Quadros, K. (2021, November 5). Portland City Council Considers Changes to Its Historic Preservation Plan. Portland Monthly. Retrieved from https://www.pdxmonthly.com/home-and-real-estate/2021/11/portland-city-council-vote-historic-neighborhoods-housing-crisis
Quigley, J. M., & Raphael, S. (2005). REGULATION AND THE HIGH COST OF HOUSING † Regulation and the High Cost of Housing in California. AEA Papers and Proceedings, May, 323–328. Retrieved from http://mcdc2.
Quigley, J. M., Raphael, S., & Rosenthal, L. A. (2009). Measuring Land-Use Regulations and Their Effects in the Housing Market (No. W08-004; Working Paper Series). Retrieved from https://escholarship.org/uc/item/07t5d0q4
Raleigh Planning Department. (2025, November 17). Unified Development Ordinance (UDO) art. 4.7, Planned Development (PD),. Retrieved from https://raleighnc.gov/planning/services/unified-development-ordinance-udo
Risk Logic. (2023, December). Evolving Fire Safety Recommendations for Electric Vehicles (EVs), EV Charging Stations and Parking Garages. Retrieved from https://risklogic.com/evolving-fire-safety-recommendations-for-electric-vehicles-evs-ev-charging-stations-and-parking-garages/
Robinson, C. (2025, October 14). Portland to Hit Pause on Frontage Improvement Mandates for Small-Scale Developments Until 2029. Hoodline. Retrieved from https://hoodline.com/2025/08/portland-to-hit-pause-on-frontage-improvement-mandates-for-small-scale-developments-until-2029/
Rodnyansky, S., Su, D., & Horowitz, A. (2025). New Housing Slows Rent Growth Most for Older, More Affordable Unit. Retrieved from https://www.pew.org/en/research-and-analysis/articles/2025/07/31/new-housing-slows-rent-growth-most-for-older-more-affordable-units
Rogers, J., Emerine, D., Haas, P., Jackson, D., Kauffmann, P., Rybeck, R., Westrom, R., Rogers, J., & Westrom, R. (2016). Estimating Parking Utilization in Multifamily Residential Buildings in Washington, D.C. Transportation Research Record: Journal of the Transportation Research, 2568, 72–82. doi: 10.3141/2568-11
Roodberg, D. (2025). Converting Existing Housing into Affordable Rentals: A Scalable Housing Solution. In Mercatus Center. Retrieved from https://www.mercatus.org/research/policy-briefs/converting-existing-housing-affordable-rentals-scalable-housing-solution
Rossberg, J., & Leon, R. T. (2013). Evolution of the Codes in the USA. Retrieved from https://www.nehrp.gov/pdf/UJNR_2013_Rossberg_Manuscript.pdf
Saiz, A. (2010). The Geographic Determinants of Housing Supply. The Quarterly Journal of Economics, 125(3), 1253–1296. doi: 10.1162/QJEC.2010.125.3.1253
Salai, S. (2025, September 15). Landlords estimate over $1 billion in delinquent rent as D.C. Council reconsiders pandemic policies. The Washington Times. Retrieved from https://www.washingtontimes.com/news/2025/sep/16/landlords-estimate-1-billion-delinquent-rent-dc-council-reconsiders/
Sayin, Y. (2015, June 8). Residents Move into the City for Jobs, Move out for Housing. District Measured. Retrieved from https://ora-cfo.dc.gov/blog/residents-move-city-jobs-move-out-housing
Sayin, Y. (2019a). Land Value Tax: Can it Work in the District? Retrieved from https://www.dcpolicycenter.org/publications/land-value-tax/
Sayin, Y. (2019b). Single-family zoning and neighborhood characteristics in the District of Columbia. Retrieved from https://www.dcpolicycenter.org/publications/single-family-zoning-2019/
Sayin, Y. (2019c). The economic costs of land use regulations. Washington, D.C. Retrieved from https://www.dcpolicycenter.org/publications/economic-cost-land-use/
Sayin, Y. (2020a). Appraising the District’s rentals: the role of rental housing in creating affordability and economic inclusion in the District of Columbia. Retrieved from https://www.dcpolicycenter.org/wp-content/uploads/2020/03/Rental-Housing-Report.Final_.March-15.pdf
Sayin, Y. (2020b). Policy Brief: How would the “Reclaim Rent Control” proposals change the District’s rental housing landscape? Washington, D.C. Retrieved from https://www.dcpolicycenter.org/publications/policy-brief-reclaim-rent-control-proposal/
Sayin, Y., & Calma, E. (2024). Priced out: Where can D.C.’s essential workers afford to live? Retrieved from https://www.dcpolicycenter.org/publications/priced-out-where-can-d-c-s-essential-workers-afford-to-live/
Sayin, Y., & Calma, E. (2025a). Assessing the role of small housing providers in the District of Columbia. Retrieved from https://www.dcpolicycenter.org/publications/assessing-the-role-of-small-housing-providers-in-the-district-of-columbia/
Sayin, Y., & Calma, E. (2025b). TOPA’s Promise and Pitfalls: Balancing tenant rights, affordability, and housing investment in Washington, D.C. Retrieved from https://www.dcpolicycenter.org/publications/topas-promise-and-pitfalls-in-dc/
Sayin, Y., & Coffin, C. (2024). The fiscal future of public education in the District of Columbia – D.C. Policy Center. Retrieved from https://www.dcpolicycenter.org/publications/dc-fiscal-future-in-education/
Schneider, B. (2018, July 17). Inclusionary Zoning: Everything You Need to Know. CityLab. Retrieved from https://www.bloomberg.com/news/articles/2018-07-17/inclusionary-zoning-everything-you-need-to-know
Schneider, D. I., & DeLorenzo, A. W. (2024, October 8). Arlington County Unveils Bold Zoning Overhaul. Insights, Holland & Knight. Retrieved from https://www.hklaw.com/en/insights/publications/2024/08/arlington-county-unveils-bold-zoning-overhaul
Seattle Department of Neighborhoods. (n.d.). Early Community Outreach for Design Review . Retrieved from https://www.seattle.gov/neighborhoods/public-participation/early-community-outreach-for-design-review
Shoup, D. (2011, April 30). Let Prices Do the Planning | Cato Unbound. Cato Unbound. Retrieved from https://www.cato-unbound.org/2011/04/30/donald-shoup/let-prices-do-planning/
Sichelman, L. (2025, October 9). Fannie Mae: ADU Income Now Allowed . National Mortgage Professional. Retrieved from https://nationalmortgageprofessional.com/news/fannie-mae-adu-income-now-allowed
Smith, S. (2024). Elevators . Retrieved from https://centerforbuilding.org/publication/elevators
Song, J. (2022). The Effects of Residential Zoning in U.S. Housing Markets. SSRN Electronic Journal. doi: 10.2139/SSRN.3996483
Sood, A., & Chiumenti, N. (2022). Local Zoning Laws and the Supply of Multifamily Housing in Greater Boston – . Retrieved from https://www.bostonfed.org/publications/new-england-public-policy-center-research-report/2022/local-zoning-laws-and-the-supply-of-multifamily-housing-in-greater-boston.aspx
The Affordable Housing Tax Credit Coalition. (n.d.). About The Housing Credit . Retrieved from https://www.taxcreditcoalition.org/the-housing-credit/
The Coalition. (2022, June 30). Outcomes for FY2023 Budget: Affordable Housing and Homelessness. Retrieved from https://thecoalitiondc.org/news/outcomes-for-fy2023-budget-affordable-housing-and-homelessness/
The Economist. (2025, October 17). Welcome to the YIMBYest neighbourhood in America. Retrieved from https://www.economist.com/united-states/2025/08/17/welcome-to-the-yimbyest-neighbourhood-in-america
The Forest Hills Connection. (2019, June). The Brandywine Apartments, like Sedgwick Gardens, is seeing an influx of voucher holders | Forest Hills Connection | News and Life in Our DC Neighborhood. Retrieved from https://www.foresthillsconnection.com/news/the-brandywine-apartments-like-sedgwick-gardens-is-seeing-an-influx-of-voucher-holders/
The Pew Charitable Trust. (2025). Small Single-Stairway Apartment Buildings Have Strong Safety Record. Retrieved from https://www.pew.org/en/research-and-analysis/reports/2025/02/small-single-stairway-apartment-buildings-have-strong-safety-record
The Pew Charitable Trusts. (2023). Lot-Size Reform Unlocks Affordable Homeownership in Houston | The Pew Charitable Trusts. Retrieved from https://www.pew.org/en/research-and-analysis/issue-briefs/2023/09/lot-size-reform-unlocks-affordable-homeownership-in-houston
Thompson, S. (2023, December 12). D.C. landlords say they need more help managing supportive housing. The Washington Post. Retrieved from https://www.washingtonpost.com/dc-md-va/2023/12/12/dc-permanent-supportive-housing-problems/
Thompson, S. (2025, June 7). In D.C., publicly funded homes can cost over $1 million per unit – The Washington Post. The Washington Post. Retrieved from https://www.washingtonpost.com/dc-md-va/2025/06/06/these-publicly-funded-homes-poor-cost-12-million-each-develop/
Thompson, S., & Bennett, D. (2023, February 16). D.C. overpays landlords millions to house the city’s poorest. The Washington Post. Retrieved from https://www.washingtonpost.com/investigations/2023/02/15/dc-housing-authority-overpays-landlords/
Torrie, Y. (2024, January 17). Final BERDO Regulations, Key Takeaways, and Next Steps. A Better City . Retrieved from https://www.abettercity.org/news-and-events/blog/final-berdo-regulations%2C-key-takeaways%2C-and-next-steps
Transportation Planning and Programming Division, & Kimley Horn. (2016). City of Minneapolis 20 Year Streets Funding Plan. Retrieved from https://www2.minneapolismn.gov/media/content-assets/www2-documents/departments/20-Year-Streets-Funding-Plan-.pdf
Trueblood, A. (2024). Housing for workforce is a key economic development program. Retrieved from https://www.dcpolicycenter.org/publications/housing-for-workforce-is-a-key-economic-development-program/
Un, K. (2010). Parking, Development Costs, and Affordability – MAPC. Retrieved from https://www.mapc.org/resource-library/parking-development-costs-and-affordability/
Engenium Group. (2023). Understanding BEPS: A Comprehensive Guide for Building Owners and the AEC Industry. Retrieved from https://engeniumgroup.com/understanding-beps-a-comprehensive-guide-for-building-owners-and-the-aec-industry/
Urban Land Institute. (2016). Howard University East Campus, Washington D.C. Retrieved from https://uli.org/wp-content/uploads/ULI-Documents/HowardUniversity_PanelReport_web.pdf
Urban Turf. (2021, July 14). The Near Doubling of DC Home Prices in 10 Years. Retrieved from https://dc.urbanturf.com/articles/blog/a-look-at-the-near-doubling-of-dc-home-prices-in-10-years/18491
U.S. Department of Transportation. (2014). Parking Reforms. Retrieved from https://www.transportation.gov/sites/dot.gov/files/2025-01/Parking%20Reforms.pdf
US Department of Transportation. (2024). Biden-Harris Administration Announces $17.6 Million to Help Communities Add Affordable Housing Near Transit. Retrieved from https://www.transportation.gov/briefing-room/biden-harris-administration-announces-176-million-help-communities-add-affordable
U.S. Energy Information Administration (EIA). (2023). District of Columbia end-use energy consumption 2023 estimates. Retrieved from https://www.eia.gov/states/DC/overview
von Bergmann, J., Davidoff, T., Lauster, N., & Somerville, T. (2025). Upzoning and redevelopment: The details matter. Journal of Housing Economics, 69, 102078. doi: 10.1016/J.JHE.2025.102078
Wetherington, W. (1978). The District of Columbia Rental Housing Act of 1977: The Effect of Rent Control on the Rental Housing Market. Catholic University Law Review, 27(3). Retrieved from https://scholarship.law.edu/lawreview
Whitehead, D. (2018, June 7). Historic preservation in DC needs reform . Greater Greater Washington. Retrieved from https://ggwash.org/view/67912/historic-preservation-in-dc-needs-reform-1
Wiener, A. (2024, September 25). ‘Perfect storm’ of problems pulls D.C. toward full-blown housing crisis. The Washington Post. Retrieved from https://www.washingtonpost.com/dc-md-va/2024/09/25/dc-affordable-housing-crisis/
Wilkins, C., Brennan, M., Deora, A., Heegaard, A., Lee, A., & Lubell, J. (2015). Comparing the Life-Cycle Costs of New Construction and Acquisition-Rehab of Affordable Multifamily Rental Housing. Housing Policy Debate, 25(4), 684–714. doi: 10.1080/10511482.2014.1003141
Willis, E. M., Koeser, A. K., Clarke, M., Hansen, G., Hilbert, D. R., Lusk, M. G., Roman, L. A., & Warner, L. A. (2024). Greening development: Reducing urban tree canopy loss through incentives. Urban Forestry & Urban Greening, 91, 128184. doi: 10.1016/j.ufug.2023.128184
Willis, J. (1950). Short History of Rent Control Laws. Cornell Law Review, 36(1). Retrieved from https://scholarship.law.cornell.edu/clr/vol36/iss1/3
Wrenn, D. H., & Irwin, E. G. (2015). Time is money: An empirical examination of the effects of regulatory delay on residential subdivision development. Regional Science and Urban Economics, 51, 25–36. doi: 10.1016/j.regsciurbeco.2014.12.004
Zabel, J., & Dalton, M. (2011). The impact of minimum lot size regulations on house prices in Eastern Massachusetts. Regional Science and Urban Economics, 41(6), 571–583. doi: 10.1016/J.REGSCIURBECO.2011.06.002
Zorach, M. (2024). Cities, Unsurprisingly, Have Far Lower Per Capita Energy Footprints. Hand Built City. Available at https://handbuiltcity.org/2024/02/05/cities-unsurprisingly-have-a-lower-per-capita-energy-footprints/
[1] Estimated using US Census American Community Survey 1-year microdata.
[2] See The Economist (2025) and Hamilton (2023).
[3] Brooks et al. (2023).
[4] During this period, the District added 84,262 net new housing units. This is the equivalent of one new unit for 1.3 new residents. Of this growth, 56,000 were units in buildings with more than 50 units.
[5] Urban Turf (2021).
[6] Interagency Council on Homelessness (2021).
[7] Between 2023 and 2020, there were between 12,000 and 14,000 units under construction per year (D.C Office of Revenue Analysis, 2026). Office of the Budget Director (2024).
[8] Housing starts are also down 79 percent (Banister, 2025).
[9] The data reflects units in buildings with five or more units. Census Building Permit System (BPS) Available at https://www.census.gov/construction/bps/index.html
[10] For example, a recent study by the Urban Institute estimates that the District would have to invest an additional $610M to $640 million in various rental subsidies to prevent evictions, in addition to nearly $1 billion already spent on affordable housing subsidies each year. For details, see Burton et al. (2024a).
[11] Multiple studies spanning different time periods and geographical contexts have documented consistent relationships between supply constraints and housing affordability outcomes. Research by Huang et al. (2012), Ihlanfeldt et al. (2009), Paciorek (2013), Quigley et al. (2005), and Saiz (2010).
[12] Gyourko et al. (2014).
[13] Gallaher, C. (2006).
[14] Sayin et al. (2025a)
[15] Recently, the Council adopted the RENTAL Act which eliminates some of the friction created by TOPA by exempting new buildings from TOPA for 15 years.
[16] These include several processes where the landlord can seek relief from rent control to meet certain returns on investment (hardship petition), make capital investments or substantial rehabilitations, add new services or amenities, or obtain the support of 70 percent of the tenant households to increase rents in return for negotiated improvements (voluntary agreements). Sayin, (2020b).
[17] Changes to capital improvement petitions have steadily narrowed how these costs can be passed on to tenants. The 1985 Rental Housing Act initially allowed landlords to recover capital improvement costs through rent increases. In 1989, the District revised this approach through the Capital Improvements Amendment Act (D.C. Law 8-48), clarifying that any such increases must be temporary and cannot be incorporated into the base rent for purposes of calculating future allowable increases. This change limited the long-term compounding effect of capital-related rent adjustments. Further changes in 2006 standardized annual rent increases under rent control. The Rent Control Reform Amendment Act replaced the earlier, more discretionary rent ceiling framework with a formula tied to inflation (CPI + 2%). This made allowable increases more predictable but also reduced flexibility to adjust rents in response to property-specific cost pressures, including capital needs (D.C. Policy Center, 2020). The 2006 reforms also narrowed the use of hardship petitions by prohibiting rent increases for units occupied by elderly or disabled tenants, or by households earning less than 60 percent of area median income. Subsequent legislation, including the Rent Control Hardship Petition Limitation Amendment Act of 2016, further constrained this tool. It imposed lower caps on hardship-based increases such as limiting adjustments to around 5 percent for properties with negative net income and introduced additional procedural requirements. Together, these changes reduced both the scope and effectiveness of hardship petitions as a mechanism for addressing financial distress in rent-controlled properties. (D.C. Law 21-197 63 DCR 15030, effective Feb. 18, 2017). For a time, the city also prohibited voluntary agreements, but they restriction has now been lifted (L25-0094 Effective from Dec 20, 2023).
[18] For details, see Sayin (2020a)
[19] In July 2022, the District also passed a new tax abatement for those who are doing office-to-residential conversions in downtown D.C. Projects eligible for this tax abatement must have at least 15% of their units available be affordable at 60% AMI. No units have been produced yet, but $2.5 million has been budgeted for annual tax abatements for conversions until FY27. D.C Official Code “§ 47–860. Tax Abatement for Affordable Housing in High-need Affordable Housing Areas.”
[20] At its peak, the annual supports the District provided to economic development was nearly at $1 billion (FY 2019). This included TIFs, PILOTs, grants, revenue bonds, tax abatements and exemptions, land dispositions or acquisitions, and contracts. This number has now dwindled down to $555 million, mostly representing debt payment on commitments from early 2010s. For details, see Unified Economic Development Reports, prepared by the Office of the Chief Financial Officer, and available at https://cfo.dc.gov/page/unified-economic-development-reports.
[21] Additionally, neighborhood transformations like NoMA, Navy Yard, and the Wharf involved benefited from favorable zoning, and lack of neighborhood pushback since these locations did not have much housing before their revitalization.
[22] Thompson (2025).
[23] Permit data show that in 2023, the total number of permits issued across the US increased by 18 percent from 2019. In D.C., the permit numbers declined by 40 percent, whereas they grew by 79 percent in Georgia, 70 percent in Tennessee, 62 percent in South Carolina, and 51 percent in Florida.
[24] Between 2020 and 2025 (Q2 data), the number of units in multifamily buildings increased by 36,335 or by 7,267 per year. In 2024, there were only 1,737 permits pulled. This is 24 percent of the previous average construction per year.
[25] Multiple studies spanning different time periods and geographical contexts have documented consistent relationships between supply constraints and housing affordability outcomes. Research by Huang et al. (2012)(2012), Ihlanfeldt et al. (2009)(2009), Paciorek (2013)(2013), Quigley et al. (2005)(2005), and Saiz (2010) collectively demonstrate that constraints on housing supply led to higher residential prices over time across diverse market conditions.
[26] Gyourko et al. (2015).
[27] Data show that residents typically move to D.C. for jobs and move out for housing (Sayin, 2015) . Additionally, significant growth in housing in Arlington captures some of this dynamic, though these factors are rarely incorporated into housing analysis in D.C. (Hamilton, 2023).
[28] This issue has been made worse with the rise in remote work (McConnell et al., 2023).
[29] Sayin (2019c).
[30] See https://maps.dcoz.dc.gov/HistoricZoning/ for the District’s historic zoning maps.
[31] Sayin (2019a).
[32] Residential zoning covers 20 percent of the city’s land area, 74 percent of residential tax lots, and 48 percent of all non-federal, non-National Park Service lots.
[33] Sayin (2019a).
[34] For example, 50-foot caps effectively yield four stories, not five, which reduce potential development without making a significant impact on building heights.
[35] D.C.’s Planned Unit Development (PUD) process allows developers to gain additional height and density for a project (beyond what they could build matter of right) in exchange for delivering additional public benefits back to the community (Bakshi Kathpalia, 2022).
[36] A map amendment changes the zoning designation of a specific property or area. In the District, these requests are processed either as contested cases or as rulemakings, depending on their scope and who is affected. Contested cases typically involve a defined set of parties with identifiable interests—often tied to a specific property—while rulemakings apply to broader changes that affect a wider area and are not centered on a single owner. The Zoning Commission determines at the outset which process will apply.
[37] Floor area is governed by the Floor Area Ratio (FAR), which measures the total gross floor area of a building relative to the size of its lot. A higher FAR allows more built space—either through greater height, bulk, or both—while a lower FAR constrains it. In practice, FAR sets the upper bound on how much building can occur on a given parcel, making it one of the primary tools for regulating density and development intensity.
[38] D.C.’s Zoning Commission (a government entity) creates zoning laws and the Board of Zoning Appeals (an independent, quasi-judicial body) grants relief from strict application of those rules through variances, special exceptions, or appeals of administrative decisions.
[39] 901 Monroe St is a vacant lot across from the Brookland Metro station originally zoned for low density residential (R-2) or mixed (MU-3A). In 2012, the Zoning Commission approved redevelopment of this lot for a denser residential development. The decision was appealed and vacated by the court in 2012 and 2013 and then again in 2015. Following the third ruling, the development team decided to wait until the city’s Comprehensive Plan was approved in 2021 before resubmitting a PUD for the development. The Commission finally approved the lot for a 230-unit apartment building in October 2025.
[40] Analysis based on public information that combines PUD data available on opendata.dc.gov with appeals data from D.C. Court of appeals. Data available on request.
[41] Calculated by subtracting from the final decision day the initial PUD application day.
[42] Based on DCBIA reports, calculating units appealed between 2015 and 2024. 2017 saw the most appeals, totaling 7,499 units.
[43] This shows in the data as a reduction in PUD applications. OZ data on PUD applications go back to 1976 but data are not presented in consistent ways. An analysis of PUD related actions taken by OZ show that in recent years, there has been a reduction in entirely new PUD applications. For example, all three PUD related applications in 2026 are requests for time extension. As best as we can tell, the last time when there was a completely new PUD application was 2024 (4 applications). Based on our analysis, since 2020, each year, there were an average of 6 new PUD applications, compared to over 15 PUD applications between 2000 and 2019. This analysis is based on the Zoning Decisions database available at https://maps.dcoz.dc.gov/casesdashboard/. DCBIA calculations tell a similar story. In 2015, 2016, and 2017 there were 35, 21, and 15 new PUD applications, respectively. Following the high number of appeals in 2017, there was a significant decrease in new PUD applications, with an average of less than 6 per year.
[44] The District has 73 designated historic districts that collectively cover 3,037 acres of land (roughly 8 percent of the entire land area, and about 24 percent of land dedicated for housing) and 1,326 tax lots.
[45] The Historic Preservation Office (HPO), part of the Office of Planning, provides staff support to the Historic Preservation Review Board (HPRB), which designates historic properties and advises the Mayor on preservation matters. See DC Office of Planning (n.d.) and DC Office of Planning (2018) for general information.
[46] Additionally, historic designation can introduce significant costs for property owners and developers. Renovations or new constructions in historic districts often face stricter design standards and longer review periods, often leading to higher material and labor costs. These factors can disincentivize investment, increase the costs of housing and renovations, and limit the size of new construction.
[47] The D.C. Urban Forest Preservation Act of 2002 (as amended) protects trees with a circumference of 40+ inches (“Special”) and 100+ inches (“Heritage”). It requires permits for removal, payment into a Tree Fund ($55/inch of special tree), and mandates developers to submit tree preservation plans.
[48] Trees classified as “heritage” (those measuring at least 100 inches in circumference) are generally protected from removal, while “special trees” trigger substantial per-inch mitigation fees or require trees to be moved.
[49] Sayin (2019c)
[50] In the U.S., early codes date to the 17th century and focused on fire risk in wood-frame buildings, with major disasters like the 1871 Chicago Fire and 1906 San Francisco Earthquake spurring wider adoption. For a history of how building codes evolved in the USA, see Rossberg et al. (2013).
[51] Over the past century, model codes developed by industry groups and later formalized through the International Code Council have brought consistency to baseline safety standards. At the same time, concerns about cost and effectiveness are not new. As early as 1920, a U.S. Senate committee noted that many code provisions reflected negotiated compromises rather than empirical evidence, often increasing costs without clear improvements in building performance. By the 1960s, national commissions were identifying building codes as a material constraint on efficient housing production, highlighting a longstanding tension between standardization, safety, and cost (McConnaughey, 1978).
[52] For example, the DOB states that “The DC Construction Codes consist of ICC/ASHRAE/NFPA model codes “as modified by the District of Columbia Construction Codes Supplement” so the model codes and the local supplement must be consulted together to determine the complete text of the District of Columbia Construction Codes.”
[53] See, for example DCSEU (2020), Building Innovation Hub (n.d.), and DCSEU (n.d.).
[54] D.C. Code does allow for rooms that do not meet these criteria, but they must be marketed as a “den” or other similar classification. This requirement differs from code requirements in U.S. including major cities like NYC.
[55] D.C.’s ventilation codes, largely based on the 2015 International Code Council family of model codes and adopted around 2020, are considered dated compared to current standards like ASHRAE 62.1-2013. While they mandate mechanical ventilation in new units, older building codes, some dating back to 1961, focus on natural ventilation and basic air changes, leaving some, particularly in older buildings, with poor air quality and inoperable systems.
[56] Office buildings follow ICC code and use lights and HVAC units for light and air. Commercial buildings often have glass exteriors and un-operable windows, as well as deep floorplans that are not allowed as residential units under D.C. Code. In-board rooms (no windows) are common in other markets, give opportunity to add bedrooms to units, and allow flexibility for developer.
[57] Fully accessible units must be able to be used by someone in a wheelchair. This includes appropriately sized doorways and pathways through a unit, that all controls must be within reach of someone in a wheelchair including for stovetops, and that there must be storage that is counter-height or lower. It also requires reinforced walls for grab bar installation. These units are not required by ADA or FHA guidelines but are sometimes required when a residential building receives federal funding (Pearlberg, 2018).
[58] Additionally, at least 1 percent of the Type A units, but not less than one, must include a roll-in shower with a permanently mounted folding shower seat. For details, see https://up.codes/viewer/district-of-columbia/ibc-2015/chapter/11/accessibility#11
[59] Section 504.
[60] Pearlberg (2018).
[61] According to 2024 single year data from ACS, 5.9 percent of residents over the age of 5 report an ambulatory disability (difficulty in walking or climbing stairs) compared 7 percent across the entire country.
[62] See Reform Option 18 in Furth, Hamilton, et al. (2025)
[63] See Smith (2024) for a comprehensive review.
[64] For example, Washington State is considering a bill (Washington State Senate Bill 5156, 2025–26) that would apply to buildings up to 6 stories (24 units) to provide flexibility in design standards (choose between international/global elevator standards, or Existing North American standards), and allow for smaller elevators so long as they accommodate wheelchair use.
[65] Maine (S.P 907) is considering rolling back a specific IBC-based requirement for dual-mode emergency communication in elevators, shifting toward a more flexible and likely less costly standard while maintaining the broader elevator safety framework.
[66] The Pew Charitable Trust (2025).
[67] This is particularly impactful when zoning caps heights at 50 feet, which limits the addition of a fifth floor.
D.C. Council is already considering legislation that can allow residential buildings of a certain height be served by a single entrance/egress under certain conditions. Bill 26-227, One Front Door Act of 2025 was introduced on April 11, 2025, and is now currently under Council Review.
[68] The District’s multifamily housing stock is already among the most energy-efficient in the country. Washington, D.C. was the first city globally to achieve LEED Platinum status, according to the U.S. Green Building Council (Destination DC, 2025), and has more LEED-certified buildings than any other U.S. city. It also ranks second nationwide in the number of ENERGY STAR–certified buildings, as reported by the Environmental Protection Agency (2023)and its per capita energy consumption is lower than that of 41 other states, according to the U.S. Energy Information Administration (2023).
[69] These standards are tied to the local median ENERGY STAR score by property type. Title III of the Clean Energy DC Omnibus Amendment Act of 2018 (D.C. Law 22-257)
[70] The BEPS framework operates on a six-year cycle. The first cycle (BEPS-1) covers District-owned buildings of 10,000 square feet or more and privately owned buildings of 50,000 square feet or more. The second cycle (BEPS-2) will begin on January 1, 2027, and will extend coverage to privately owned buildings of 25,000 square feet or more. With each new cycle, the standards are expected to tighten as buildings reduce their energy use: minimum required ENERGY STAR scores will rise, and maximum allowable source energy use intensity scores will fall. For details see (DC BEPS Blog Series: An Introduction (Part 1) – Baumann Consulting, n.d.).
[71] 20 DCMR 35
[72] See, for example (Engenium Group, 2023)
[73] The Building Energy Performance Standards Amendment Act of 2024 (D.C. Law 25-307) adjusts benchmarking deadlines and verification frequency, delays the second and third compliance cycles by one year, extends the first cycle to six years, adds whole-cycle exemptions for vacant/financially distressed buildings, rebrands penalties as “alternative compliance payments,” and clarifies that BEPS-driven MEP upgrades are exempt from stormwater requirements.
[74] According to the DC Council’s Committee on Transportation & the Environment, 30 percent of commercial buildings and 32 percent of residential buildings were not incompliance with BEPS requirements as of 2025 (Committee on Transportation & the Environment, 2025)
[75] Property owners have four pathways to comply with BEPS. The default is to meet or exceed the required BEPS score by the end of the compliance period. Alternatively, an owner may elect to use the performance pathway, which requires a 20 percent reduction in energy use, or the prescriptive pathway, which requires completing a defined set of DOEE-approved measures. If none of these options are feasible, the owner may propose an alternative compliance approach that DOEE determines will achieve equal or greater energy savings than the other three pathways. If a building fails to comply under any of these four routes, it is subject to a penalty of $10 per square foot per year.
[76] While less applicable to housing, the impact of tenant behavior on BEPS scores may create a disincentive to lease space to high-energy-using tenants (such as museums) in areas such as Downtown where occupancy is urgently needed.
[77] Compliance itself has become its own industry. Providers and owners must invest significant financial and staff resources in navigating DOEE tools, filing reports, and hiring third-party consultants, diverting resources away from improvements with real energy and carbon impacts. At the same time, many housing providers are still not allowed to individually meter tenant energy use, so residents, who most directly control day-to-day consumption, see no direct price signal. In that sense, BEPS is strict where it should be flexible, and flexible where it should be strict—burdening building owners while leaving core behavioral incentives largely untouched.
[78] Zorach (2024).
[79] Based on proformas shared by housing providers.
[80] See here for application types: https://www.dcwater.com/permits/application-types. See here for refund request process: https://www.dcwater.com/permits/refund-requests
[81] Developers describe these deposits as money that disappears into a black box. DC Water gives owners two years to request refunds for excess inspection fees and deposits, but refunds are not automatic, they must be requested in writing. DC Water also maintains a separate forfeiture notice for accounts that have been inactive for more than ten years, which strongly suggests that unreturned construction deposits are common and acquiring refunds is administratively cumbersome. DDOT’s treatment of excavation deposits points in the same direction. The D.C. Code now includes a dedicated section on “unclaimed deposits for excavation work in public space,” explicitly acknowledging that applicants post substantial deposits for this work and that those funds can sit unclaimed long enough to require formal rules about when they are deemed abandoned and who keeps them. For details, see D.C. Code § 41–165.05. Unclaimed deposits for excavation work in public space.
[82] These include rent freezes, eviction moratoria, bans on late fees, mandatory rent-repayment plans, and “safe harbor” hardship defenses.
[83] Policies that created these large arrears include ERAP, the eviction moratorium, automatic stays for any ERAP applicants (regardless of eligibility), and the elimination of tenant rent payments into a court escrow account while cases are adjudicated (protective orders).
[84] What used to be a process measured in months can now extend into years, particularly when jury trials are involved. The number procedural steps have also grown from 2-3 to 7-8, in a court system facing a persistent shortage of (federally appointed) judges.
[85] While eviction filings have decreased significantly over the years, the number of completed evictions has increased, now surpassing pre-pandemic levels. The significant percentage increase in eviction filings leading to competed evictions can be tied to multiple pandemic era policies including automatic stays of eviction cases if the tenant has applied for ERAP (regardless of the availability of funds or whether the tenant would qualify), as well as the elimination of rent payment into court registries while cases are adjudicated. By the time court cases resolve, tenants owe multiple years of back rent, and most are unable to come up with the funds having not set them aside. This leads to more overall evictions even when the number of filings is low.
For eviction filings, see Panfil, Reichman, Zainulbhaj, et al. (2025). For the number of completed evictions, see Burton et al. (2024b)
[86] Data collected from ten affordable housing providers in the city at the end of 2024 showed that economic vacancy (vacant units + units occupied by tenants but not paying rents) reached 15 percent—compared to the 5 percent typically used in project proformas. Estimates of percentage of unpaid rent in affordable buildings increased over 13 times since 2020, now encompassing approximately 20 percent of renters in 2025 (DMPED, 2024). A survey of five providers with 126 properties in D.C. showed a sixfold increase from pre-pandemic levels (AOBA, 2024; Gathright, 2025a).
[87] A small but consequential share of cases now involve what housing providers describe as the “weaponization” of inspections and agencies. Providers report that some tenants, facing eviction or disputes, deliberately damage units or refuse access, then call regulatory agencies (Department of Buildings or the Office of Tenant Advocate) to trigger investigations and enforcement actions. Many housing providers mentioned this problem during interviews with the D.C. Policy Center and some extreme cases of this type of adversary has been covered in the press. See, for example, Barr (2025).
[88] Nonprofit and mission-driven owners such as Enterprise have begun to sell properties (Peters, 2025) and long-time affordable operators like E&G Group (Wiener, 2024) and Neighborhood Development Corporation (AHF Staff, 2024). have exited or wound down operations, with buildings shifting to lenders or owners with limited track records in D.C.
[89] One provider interviewed by the D.C. Policy Center reported carrying several PSH units in a Ward 5 property with no subsidy payments for half a year, resulting in the loss of significant income needed for operations.
[90] See, for example, Thompson (2023).
[91] Across the system, many owners have losses of over 25 percent of their operating income, especially for affordable housing and in certain areas of the city (Wards 5, 7, and 8). The total losses, by one estimate, total over $1 billion (Salai, 2025).
[92] For individual cases, arrears can be mitigated when a judge requires a protective order, or a court order for the tenant to pay rent due into a court registry while the case is pending. These accounts can ensure that while the case is being resolved, the amount of rent due does not reach an unsurmountable level. If the case is ruled that the tenant did not owe rent during this time, they receive the money back from the registry account.
[93] The Department of Buildings (DOB) oversees the review and approval of building permits, certificates of occupancy, and related inspections.
[94] DOB Accelerated Review Program. https://dob.dc.gov/apr
[95] Some developers say the program is also currently oversubscribed, with so many projects trying to go through the Velocity program that approval times have become much lengthier than the standard permit process.
[96] In D.C., ADUs are often basement apartments in row homes.
[97] DC Department of Housing and Community Development (2022).
[98] When RAAP launched in Fiscal Year 2022, offering grants for development of ADUs, it was oversubscribed, with more than 200 applications for just 15 potential awards. Yet by July 2025, only four units had made it through permitting and construction and were fully compliant with D.C. standards.
[99] Allard (2025).
[100] Nationally, most sources put ADUs around $150–$300 per square foot (R. Hoffman, 2026), while the range for D.C. is $360-$480 per square foot for units under 500 square feet, which are more likely to be modest additions to existing structures. Cort et al. (2021)report that in 2021, the typical cost of ADU construction ranged from $300 to $400. We adjusted this figure for inflation using construction cost calculator for Washington D.C. developed by RLB intelligence (available at https://www.rlb.com/ccc/). Detached, ground-up ADUs may cost up to three times higher. See for example Hershberger (2025). These higher costs reflect additional work required for foundations, utility connections, and more complicated design and permitting.
[101] HUD changed rules for FHA in 2023. For an existing ADU on a property, up to 75 percent of the estimated market rent from the ADU can be counted toward qualifying income. For planned ADUs, up to 50 percent of the projected rent can be used. This only applies to owner-occupied, one-unit properties. (Milton, 2023). Fannie Mae allows rental income from an existing ADU on a 1-unit primary residence to count toward qualifying income, up to a cap (typically 30 percent of total qualifying income) (Sichelman, 2025). For Freddie Mac, rental income from an ADU on a 1-unit primary residence may be used to qualify, for purchase or “no-cash-out” refinance. Income is generally limited to 75 percent of the lease amount and no more than 30 percent of total qualifying income. (Freddie Mac, 2025).
[102] Some credit unions and CDFIs offer ADU loan products (often second mortgages) that are secured by the home but sized off the post-ADU value or expected rental stream (Abu-Khalaf, 2023). Examples include Portland-area and California pilots where a CDFI or credit union offers an ADU-specific HELOC based on the future value with ADU in place, not just current equity. Regionally, some lenders in the DC metro (e.g., a few MD/VA credit unions) advertise rate discounts for HELOCs used to build an ADU, even if they’re not formally treating projected rents as qualifying income in underwriting.
[103] Including credit score floors, debt-to-income limits, landlord training requirements, proof of lease or market rent, and zoning-compliance documentation.
[104] For example, RAAP (now unfunded) required homeowners with incomes above 120 percent of Median Family Income (MFI) to rent their units to households below 60 percent of MFI. In practice, this turned RAAP into a small-scale Inclusionary Zoning or affordable-housing program, layering on income certification, compliance, and monitoring.
[105] Affordable dwelling units are locally regulated for-sale and rental homes reserved for households within certain income ranges and offered below market rates. In D.C., DHCD oversees and enforces these requirements. Affordable dwelling units are typically created in return for zoning relief, tax incentives, public funds, or access to District-owned land. Their rules such as affordability periods, income limits, and resale restrictions are defined in legal documents (deeds, covenants, land disposition agreements). These terms used to be negotiated case by case but are now becoming more standardized. They do not include units restricted by federal programs (like HOME, LIHTC, CDBG) or those funded by the Housing Production Trust Fund.
[106] Of this money, $968 million of is devoted to direct services, including roughly $727 million in subsidies. For details, see (Office of the Budget Director, 2024).
[107] Calma (2026).
[108] Housing production trust funds are a critical tool used by governments to finance the development and preservation of affordable housing. These funds can support a range of activities, including capital subsidies, below-market loans, and operating assistance. In Washington, D.C., the Housing Production Trust Fund (HPTF) serves as the city’s primary vehicle for creating and preserving affordable housing. Administered by the Department of Housing and Community Development (DHCD), the HPTF is funded by deed recordation and transfer taxes as well as general fund allocations.
[109] Between 2010 and 2022, HPTF helped finance nearly 17,700 units, 95 percent of them rentals.
[110] D.C. Policy Center’s analysis of Housing Production Trust Fund reports shows that in 2022, the average cost of a unit receiving HPTF funds exceeded $530,000. Data includes 7 major rehabilitation and new construction projects reported in the 2022 Annual Report for the Housing Production Trust Fund, which collectively cost $769 million to produce 1,443 units. This is the full cost of the project, funded through multiple funding streams including HTPF. One recent project cost $1.2 million per unit (Thompson, 2025).
[111] Roughly half of HPTF-supported units produced since 2015 are located in Wards 7 and 8. Affordable Housing dataset, available at Opendata from https://opendata.dc.gov/datasets/affordable-housing/
[112] Extremely low income is defined as 30 percent of Area Median Income (AMI). “Housing Production Trust Fund Reports.” DC Gov Department of Housing and Community Development, dhcd.dc.gov/page/housing-production-trust-fund-reports.
[113] “Chapter 28. Housing Production Trust Fund.” Code of the District of Columbia, code.dccouncil.gov/us/dc/council/code/titles/42/chapters/28/.
[114] The extremely low-income limit for a household of 2 people in D.C. was $36,200 in 2023. The rental income allowed to make this unit affordable (30 percent of income) is $12,066 per year, or about $1,000 per month. This monthly payment is not enough to pay for operating expenditures of a typical multifamily building, which is estimated at $12,500 to $17,500 per unit in the District (National Apartment Association, 2021).
[115] D.C.’s IZ program mandates that most new residential developments with ten or more units dedicate 8–10 percent of their residential square footage to affordable housing, typically targeted at households earning between 50 to 80 percent of Area Median Income (AMI). In exchange, developers may receive a density bonus of up to 20 percent. “Inclusionary Zoning (IZ) Affordable Housing Program. (Department of Housing and Community Development, n.d.)
[116] See Plerhoples Stacy et al. (2021) and Hamilton (2021a).
[117] 60 percent MFI rent levels for IZ and LIHTC properties are as follows:
| IZ | LIHTC | |
| Studio | $1,520 | $1,722 |
| One Bedroom | $1,610 | $1,845 |
| Two Bedroom | $1,940 | $2,214 |
| Three Bedroom | $2,270 | $2,557 |
The difference between these rents will almost certainly increase when the 2026 LIHTC rents are released on May 1st. LIHTC rent levels taken from Novogradac Rent and Income Limit Calculator, found at https://rent-income.novoco.com/free/calculator IZ rent levels are from DHCD (Department of Housing and Community Development, 2026)
[118] Utility allowances are what tenants are expected to pay in utilities and are taken out of rent amounts so that total housing costs do not exceed 30 percent of a tenant’s income. IZ utility allowances are more than twice that of LIHTC programs and the IZ program does not allow energy modeling to determine appropriate utility allowances. Utility allowances are as follows:
| IZ | LIHTC | |
| Studio | $160 | $68 |
| One Bedroom | $241 | $106 |
| Two Bedroom | $322 | $148 |
| Three Bedroom | $404 | $186 |
[119] Property owners report increasing costs, driven particularly by insurance, utilities, and building security.
[120] One report from DHCD claimed that it took an average of 119 days to lease an IZ unit, or over three months (Department of Housing and Community Development, 2025). However, an investigative report from the same year from the D.C. auditor reported that DHCD took an average of 13 months to fill IZ units (Office of the District of Columbia Auditor, 2024).
[121] There is conflicting information on the number of IZ units. The Department of Housing and Community Development’s IZ database notes 4,802 units (https://octo.quickbase.com/nav/app/bi9iqv4v7/action/appoverview) whereas a newsletter circulated by the Office of Planning in March of 2023 noted the delivery of 2,000 units. (https://content.govdelivery.com/accounts/DCWASH/bulletins/350c1be).
[122] Over half of all IZ units are concentrated in Wards 5 and 6, where zoning allows for higher-density development. Conversely, very few units have been created in low-density, single-family-zoned areas like Wards 3 and 4, where exclusionary zoning severely limits the potential for multifamily housing development. (Sayin, 2020a)
[123] B. Schneider (2018).
[124] Households are generally responsible for paying up to 30 percent of their adjusted monthly income for rent and utilities. Voucher recipients are responsible for finding a suitable housing unit where the owner agrees to rent under the program.
[125] Data from HUD (https://hudgis-hud.opendata.arcgis.com/datasets/HUD::housing-choice-vouchers-by-tract/explore?location=38.958459%2C-76.972952%2C12)
[126] DCHA (2025).
[127] Gallaher (2023).
[128] The Petra case crystallized this fear. In 2025, the District’s Attorney General sued Petra Management Group for allegedly using vouchers in rent-controlled buildings to get around rent-control caps (by effectively only renting those units at higher subsidized levels). Petra settled for $700,000 and agreed to start advertising units at their legal rent-controlled rents. (Gathright, 2025b).
[129] The Forest Hills Connection (2019).
[130] These numbers reflect agency Performance Oversight Hearing documents from February 25, 2026 are available at https://lims.dccouncil.gov/Hearings/hearings/2119.
[131] This has been reduced significantly over the years. In 2023, the waitlist was over 40,000 (Cuccia, 2022).
[132] Flynn (2023)
[133] See District of Columbia Government (2016) and National Low Income Housing Coalition (2024). A database of HCV maintained by HUD shows 13,042 vouchers (HUD Open Data Site, 2025)
[134] Flynn et al. (2023).
[135] DCHA’s responses to FY 2026 performance indicated that DCHA’s voucher utilization is now 100 percent, which represents a sharp increase in use in the last year.
[136] Flynn et al. (2023).
[137] National Low Income Housing Coalition (2023).
[138] In Fiscal Year 2016, LRSP cost about $7,988 per voucher (roughly 3,700 vouchers and a $29.6 million budget). By Fiscal Year 2023, costs had climbed to $23,760 per voucher ($169 million supporting 7,121 vouchers). For details see Castaldi et al. (2025).
[139] Rent growth adjusted for inflation using U.S. Bureau of Labor Statistics, Consumer Price Index for All Urban Consumers: Rent of Primary Residence in U.S. City Average [CUUR0000SEHA], retrieved from FRED, Federal Reserve Bank of St. Louis; https://fred.stlouisfed.org/series/CUUR0000SEHA, November 27, 2025. Fair market rent growth, as calculated by HUD was only 15 percent.
[140] LRSP was created to implement the 2006 Comprehensive Housing Strategy Task Force recommendation. the goal was 14,600 subsidies over 15 years, adding 1,000 per year. The program exceeded its goals in its first two years: LSRP was initially funded in FY 2007 and expanded in FY 2008, growing to about 1,718 units (600 tenant-based, 1,118 project/sponsor) Between FY 2008 and FY 2012, funding was essentially just enough to maintain the initial units, not to add new ones (DC Fiscal Policy Institute, 2012).
[141] By Fiscal Year 2016, LRSP funding reached about $48 million for roughly 3,500 households. by Fiscal Year 2019, it was $85.3 million, including Permanent Supportive Housing and Targeted Affordable Housing units. Data from budget book chapters for 2019 and 2016.
[142] Homeward DC, the District’s homeless reduction and prevention plan, identified LRSP as a key financing tool (Interagency Council on Homelessness, 2021).
[143] A 2016 DCFPI brief explicitly notes that LRSP is needed to help HPTF projects hit the statutory requirement that a large share of Trust Fund dollars serve extremely low-income (0–30 percent AMI) households; capital alone doesn’t reduce rents enough without operating subsidies. (DC Fiscal Policy Institute, 2016) A 2022 advocacy memo on the FY 2023 budget similarly emphasizes that project-based LRSP covers ongoing rent, maintenance, utilities, and other operating costs for HPTF PSH units and is critical to meeting the legal requirement that half of HPTF go to 0–30 percent MFI (The Coalition, 2022).
[144] By FY 2024, the LSRP budget had grown to roughly $170 million, about double its FY 2019 level.
[145] Sayin & Coffin (2024).
[146] Homeward DC 1.0 and 2.0 are explicit about relying on PSH and TAH placements to end chronic homelessness; many of these placements are funded as LRSP vouchers (Interagency Council on Homelessness, 2021).
[147] See agency response to Q.14 for the FY2020 Oversight Hearing questions for DCHA. https://dccouncil.gov/wp-content/uploads/2019/04/dcha.pdf.
[148] Housing developers can claim LIHTC on their federal income tax return for a period of ten years, and their projects are required to meet certain low-income use requirements for thirty years. There are three ways that project owners can meet the low-income means testing requirement: having at least 20 percent of their units occupied by tenants earning 50 percent of the area median income (AMI), or having at least 40 percent of their units occupied by tenants with an income of 60 percent AMI or less. Units are kept affordable for a period of 30 years.
[149] HUD data, accessed in February 2026, showed 24,638 units in D.C. The database does not disaggregate data by rental or owner-occupied residence, nor do they have the incomes of tenants occupying each unit. “LITHC Database Access.” lihtc.huduser.gov/.
[150] The program offers tax credits for 10 years (The Affordable Housing Tax Credit Coalition, n.d.).
[151] Roodberg (2025).
[152] Edwards et al. (2017).
[153] This includes developers, investors, and lawyers.
[154] No units have been built west of rock creek park. https://www.novoco.com/public-media/documents/district-columbia-lihtc-properties-through-2023-072025.pdf
[155] Bakshi Kathpalia (2022).
[156] Since 2015, 89 appeal cases were filed in court to vacate zoning decisions (opposing development plans). Ultimately, 9 of these cases were vacated or remanded. Analysis based on public information that combines PUD data available on opendata.dc.gov with appeals data from D.C. Court of appeals. Data available on request.
[157] The average appeals process added 450 days to the development timeline. Calculated by subtracting from the final decision day the initial PUD application day.
[158] This shows in the data as a reduction in PUD applications. OZ data on PUD applications go back to 1976 but data are not presented in consistent ways. An analysis of PUD related actions taken by OZ show that in recent years, there has been a reduction in entirely new PUD applications. For example, all three PUD related applications in 2026 are requests for time extension. As best as we can tell, the last time when there was a completely new PUD application was 2024 (4 applications). Based on our analysis, since 2020, each year, there were an average of 6 new PUD applications, compared to over 15 PUD applications between 2000 and 2019. This analysis is based on the Zoning Decisions database available at https://maps.dcoz.dc.gov/casesdashboard/.
[159] Sayin et al. (2025a)
[160] D.C.’s population density is not significantly different from other US cities. According to the 2020 Census, the population density in the District was 11,286 per square mile, below New York’s (29,298), and San Francisco’s (18,635), but comparable to Boston (13,989), Chicago (12,061), and Philadelphia (11,933) (Kober, 2022).
[161] U.S. Census Bureau, Resident Population in the District of Columbia [DCPOP], retrieved from FRED, Federal Reserve Bank of St. Louis; https://fred.stlouisfed.org/series/DCPOP, November 28, 2025.
[162] (Sayin et al., 2025b)
[163] This includes all housing units, including approximately 6,200 single family homes. Ibid.
[164] This is suggested by the drop in housing permits starting in 2024. Census Building Permit System (BPS) Available at https://www.census.gov/construction/bps/index.html
[165] This is not the District’s first experience with rent control. The city imposed rent control between 1919 and 1925 in response to the stress created by a rapidly growing population and the media attention to families facing eviction while battling the Spanish Flu (Huron, 2020; J. Willis, 1950). In 1942, as similar problems resurfaced during WWII, Congress passed a rent control law that covered 80 percent of the nation’s rental housing, including a separate law just for D.C. However, when these laws expired in 1953, rent control largely disappeared outside of New York City. The issue resurfaced in 1971 when President Nixon imposed a temporary freeze on wages, prices, and rents to combat inflation (Fetter, 2016). Although federal controls ended in 1973, they reignited local rent control movements in several cities, including Washington, D.C. (Wetherington, 1978).
[166] Sayin et al. (2025b).
[167] Price (2019). Also see Kober (2022) for a discussion of how Grand Bargain manifests itself in other cities. According to Kober, “Grand bargain” planning delivers growth where it is politically easiest, but concentrates it in expensive, large-scale projects while excluding lower cost “missing middle” housing and limiting neighborhood diversity. Over time, it becomes unsustainable—running out of easy sites, reinforcing uniform development patterns, and increasing pressure for policies that address symptoms (like rent burdens) without resolving underlying supply constraints.
[168] Sayin (2020a)
[169] For example, between 2015 to 2024 35,000 units in the District changed occupancy status at least once, between rental and owner-occupied (Sayin et al., 2025a).
[170] The District has approximately 150,000 rental units, and among those 138,000 are in buildings with five or more units. This discussion is focused on the latter. The count of market rate units does not include IZ.
[171] These numbers reflect 2024 estimates. DCHA has reported that in 2025, they had 13,000 active HCV recipients.
[172]Sayin et al. (2025b).
[173] Data from CoStar.
[174] See Sayin et al. (2025b) and Sayin et al. (2025a) for how these estimates have been developed.
[175] The actual units are probably fewer than that—possibly under 21,500. This is because some of the units in market rate buildings are set aside for IZ, and they are, by definition, rented at or below 80 percent of AMI.
[176] E. Glaeser et al. (2018).
[177] See Pinto et al. (2023) and Hamilton (2021b).
[178] Mast (2023).
[179] See Li (2022) and Pennington (2021).
[180] See E. L. Glaeser et al. (2008), and E. Glaeser et al. (2018).
[181] von Bergmann et al. (2025) compares the performance of two cities in British Columbia that adopted similar zoning reforms but operated in different permitting and regulatory environments to show that a difficult regulatory environment significantly muted the impact of zoning reforms.
[182] The median monthly rent for a two-bedroom apartment in 2024 was $3,509 or $2,350 more expansive than what a family of four at 30 percent of AMI can afford.
[183] This includes $169 million for local rent supplements and $249 million for Housing Choice Vouchers. Source: D.C. Budget analysis and data from HUD.
[184] Burton et al. (2024b).
[185] D.C. Policy Center’s analysis of Fiscal Year 2023 actual spending show that the full amount of housing related subsidies that year was $1.4 billion. This includes subsidies for housing, homeless services, rehabilitation of public housing units, and HPTF dollars. The subsidy amount declined in Fiscal Year 2024 to $815 million in the approved Fiscal Year 2024 budget, and to $727 million in the approved Fiscal Year 2025 budget. The Fiscal Year 2027 prospects look even weaker.
[186] Sayin & Calma (2024).
[187] Sayin (2019b).
[188] We estimate that each additional housing unit could generate $15,500 per year in combined property, income, and sales tax revenue. At 100,000 new units, an ambitious but achievable long-term target, that would amount to about $1.5 billion in recurring annual revenue. Property tax: Assumes that new units are all in multifamily buildings with an average per unit assessment of $390,000. According to the District’s tax rolls, that is the average assessed value of multifamily units produced since 2018. Income tax: Assumes the average Adjusted Gross Income of a household occupying new units is $159,000. The is the average AGI according to the data published by the IRS for 2021 (137,000), adjusted for inflation. We assume that the average household pays D.C. income taxes at an effective rate of 6.4 percent, which is the effective tax rate according to the OCFO data. Sales tax: Per OCFO data, per capita spending on items subject to general sales tax is $21,000. The estimate uses a household size of 1.5 persons and a 6.5 percent effective sales tax rate.
[189] Trueblood (2024).
[190] See Asquith et al. (2019), E. L. Glaeser et al. (2003), and Mast (2023).
[191] Rodnyansky et al. (2025).
[192] Even modest increases in allowable density in single-family zones could have a big impact. Detached single-family areas often have fewer than 1,000 units per square mile, while rowhouse zones can reach 11,000 units and 25,000 people per square mile without disrupting traditional neighborhood character. For details see (Sayin, 2019b). Additionally, increases in housing supply at the upper end of the market are more effective at increasing affordability in all segments of the market, even more than increasing supply of low-income housing. For details, see (Abramson et al., 2025).
[193] R1-A zones require a minimum lot size of 7,500 square feet. R1-B zones require 4,000 square feet. This information is gleaned from the Zooning Layer Lookup data that is available at https://opendata.dc.gov/datasets/e5f571df6394497d86c1c183ca9f913e_56/explore?location=38.895067%2C-77.017559%2C12.52
[194] The average size of lots that hold buildings with fewer than five flats is 3,200 square feet.
[195] Brooks et al. (2023).
[196] Ward 3, in particular, must allow meaningful new housing. Its schools, parks, transit access, and job proximity make it a prime location for growth. Yet its regulatory framework shuts out most new residents. Our vision recognizes that affordability and equity cannot be achieved when the city’s highest-opportunity neighborhoods remain closed.
[197] T. J. Peter (2024).
[198] Some estimates of success are higher. Research from Oregon suggests that upzoned parcels were twice as likely to be redeveloped over 15 years, leading to three times as many units over time Dong (2024).
[199] Assuming a typical conversion to flat has 3 units.
[200] Places like Oregon, California, Maine, and Minneapolis show that thoughtful zoning reform can unlock supply without sacrificing neighborhood character. In 2019, Oregon passed House Bill 2001, which effectively ended exclusive single-family zoning in cities with more than 10,000 residents. The law requires: duplexes in all single-family zones in cities with 10,000+ residents and triplexes, fourplexes, and cottage clusters in cities with 25,000+ residents. In 2021, California passed legislation to allow two homes on lots previously zoned for single-family statewide, and up to four homes per parcel with lot splits (SB 9) and cities to zone up to 10 units on transit-rich or jobs-rich parcels, even if previously zoned for single-family (SB 10). Maine’s LD 2003 (2022) requires municipalities to allow by-right duplexes, triplexes, and fourplexes in zones previously limited to single-family housing. In 2018, the Minneapolis 2040 Plan made national headlines by eliminating single-family zoning across the city. It allowed triplexes by right on lots that had previously allowed only one unit. The city also upzoned areas along transit corridors for greater density. Minneapolis’s elimination of single-family-only zoning did not instantly remake neighborhoods—permits in upzoned areas rose from 13 units in 2015 to 53 in 2022, but it created space for incremental density and made other reforms easier to implement (Blumgart, 2022).
[201] Baca et al. (2019).
[202] See for example Shoup (2011), U.S. Department of Transportation (2014), and Cortright (2016).
[203] Hoyt et al. (2020b).
[204] See Litman (2014) for cost of parking (12.5-25 percent) and Oregon Department of Land Conservation and Development (2020) for density losses (13-37 percent).
[205] Un (2010) estimates that rents increase by 15 percent based on a sample of landlords.
[206] According to the National Zoning Atlas, 668 of 19,018 zoned acres do not require parking. See https://www.zoningatlas.org/atlas/?state_id=104&cbsa_id=114&county_id=3774&jurisdiction_id=6495&quickfilter=noparkingreq&zoningdistrict_ids%5B%5D=48647&lat=38.97854&lng=-77.05099&zoom=13.196&overlays=tribal-lands%2Cprotected-lands
[207] Developers can model parking demand using indicators on access to transportation, neighborhood amenities, income levels, number of children, and type of employment. DDOT has already used D.C. multifamily data to develop such an estimate on parking needs (Rogers et al., 2016).
[208] Hess et al. (2021).
[209] Comprehensive and Neighborhood Planning Commission (2021).
[210] Gabbe et al. (2020).
[211] See Gould (2023) and Hess et al. (2021). Also see Furman Center for Real Estate & Urban Policy et al. (2012) for an earlier analysis.
[212] The estimate assumes that eliminating parking minimums can increase unit production by 25 percent (based on published research).
[213] This recommendation is not only in line with other localities and is also in line with the size of D.C.’s rowhomes. Most D.C. rowhomes are 15-25’ wide and 30’ or deeper. 1400 square feet is ample room for a rowhome with a front and backyard.
[214] See Zabel et al. (2011), Song (2022), E. L. Glaeser et al. (2006), and Gyourko et al. (2023).
[215] See Gray et al. (2023) and The Pew Charitable Trusts (2023).
[216] Gray (2021).
[217] Dickinson et al. (2010).
[218] See Bipartisan Policy Center (2023) and Horowitz et al. (2023).
[219] Chapple et al. (2020).
[220] E. L. Glaeser et al. (2006).
[221] See Austermuhle (2019) and Garrett (2023).
[222] Office of Planning (2013).
[223] Sood et al. (2022).
[224] Office of Planning (2013).
[225] For example, zoning limits one accessory apartment per lot, requires owner-occupancy in either the accessory unit or the principal unit (11 DCMR 253.5), limits the number of occupants in the accessory apartment to 3 persons ( and total number of occupants in the principal and accessory units to 6 persons; 11 DCMR 253.6), imposes a minimum gross floor area for the main house (1,200–2,000 sq. ft. depending on zone), and imposes tight alley/access conditions, and prohibits roof decks.
[226] Additionally, ADUs in alleys sometimes cannot be built because of lack of address.
[227] California state law (Gov. Code § 65852.2 and related guidance) prohibits cities from requiring fire sprinklers in an ADU if they are not required in the primary dwelling, and construction of an ADU cannot be used to trigger sprinkler requirements in the existing house. Many implementations also cap this at ADUs ≤1,200 square feet on the same lot. Local jurisdictions (e.g., Napa, CA) mirror this: no residential sprinklers required for an ADU if the main house isn’t sprinklered and the ADU stays under defined size/attachment limits (California Department of Housing and Community Development, 2025; California State Fire Marshal, 2017).
[228] Small landlords charge lower rents, impose fewer rent increases, and are more likely to rent to residents with disabilities and seniors. Sayin, et al. (2025a).
[229] DOB’s Permit Operations dashboard provides historic performance indicators for prescreenings and reviews. Available at: https://dataviz1.dc.gov/t/OCTO/views/DOBPublicDashboard/PermitOperations-BuildingPermitsIssued?%3AshowAppBanner=false&%3Adisplay_count=n&%3AshowVizHome=n&%3Aorigin=viz_share_link&%3Aembed=yes&%3Atoolbar=no
[230] DOB moved its permitting process online with ProjectDox for plan submission and Citizen Access Portal for application tracking. However, the digital interface remains cumbersome, and many developers report frequent system errors, unclear comment logs, and lack of interagency visibility.
[231] Certain small-scale permits (e.g., fences, signs, home repairs) can be processed via express permits, often same day. For larger projects, DOB offers Expedited Plan Review for a fee, with target turnaround times of 5–10 business days for first comments. However, uptake has been limited due to unclear eligibility and inconsistent staffing.
[232] Looking at data from 2019, or the last pre-pandemic year during the construction boom, projects that went through 12 prescreening rounds took 449 days to have a new building permit issued. Even reviews facing 6 prescreening rounds took 233 days to receive a permit on average. Permitting times have remained high since, only declining slightly in the last year. However, 2025 numbers are likely artificially low due to the significantly decreased volume of permits. Department of Buildings Permit Operations Dashboard. Available at https://dob.dc.gov/page/agency-performance-dob
[233]See Building Industry Association of Washington (2023), Council of Economic Advisors (2024), and Manville et al. (2023).
[234] Wrenn et al. (2015).
[235] Furth et al. (2024).
[236] T. Peter et al. (2025).
[237] Maclean et al. (2023).
[238] Some jurisdictions such as Arizona, in response to enforced timelines, have implemented extensive pre-approval requirements that create significant burdens on developers. To make this effective, the city must not add requirements for permit applications and instead focus on simplifying the application process to remove duplicative steps and reviews (Furth, Vaz, et al., 2025).
[239] This is intended to reduce new comments in subsequent review cycles that open new issues on projects that were previously deemed compliant.
[240] This should extend well beyond the fee-based Velocity program, providing concurrent reviews for all projects with a single portal through which the process can be tracked. Currently, permits are not issued until all approvals are in place with all agencies, which all move at their own timeline and often have their own system for tracking.
[241] In addition to having a single application/intake for all agencies, all required documents and fees should be clarified upfront.
[242] While there are no requirements by law to create these types of units, D.C.’s market would likely support it. D.C. has one of the highest concentrations of Deaf, DeafBlind, DeafDisabled, and Hard of Hearing (D/DB/DD/HH) populations in the United States. Many developers may wish to incorporate these designs into their units, especially near Gallaudet University.
[243] Furth et al. (2024).
[244] Ibid
[245] The information from Newton, MA’s streamlined permit process can be found at: https://www.newtonma.gov/government/planning/development-review/comprehensive-permits-408
[246] Manville et al. (2023).
[247] Gabriel et al. (2024).
[248] DC Department of Buildings (2023).
[249] This could include self-certification for compliant housing projects to reduce operational burdens (Furth et al., 2024). Phoenix created a self-certification program of architects and engineers to review plans for compliance. This program allowed applicants to receive permits in one to 5 days. After implementation, building permits doubled (Blount et al., 2023a).
[250] Under the Construction Codes, an applicant may hire an approved third-party agency (licensed architects/engineers) to do a code-compliance review of the construction documents at the applicant’s expense. The third-party issues a certified report. If DOB is satisfied that the report and drawings comply with the Construction Codes, DOB is supposed to finish its review within 15 business days, but still must issue the permit itself. This means that DOB is often reviewing the project a second time, even when certified by a third-party. Separately, third-party inspection agencies can perform building inspections and submit reports via the Third-Party Inspection Program, again subject to DOB oversight. D.C. law explicitly says that using third-party plan review does not relieve the District of its obligation to review the construction documents (D.C. Code § 6–1405.02. Third party plan review). So third-party review supplements DOB, it doesn’t replace DOB.
[251] D.C. Code § 6-1405.02(i) and 12-A DCMR 105.3.1.1–.2.
[252] Quigley et al. (2009).
[253] City of Phoenix Planning & Development Department (2023).
[254] Blount et al. (2023b).
[255] See Institute for Market Transformation (2011) and Prince George’s County Department of Permitting (2020).
[256] (IBC, IRC, IEBC, IECC, etc.), ASHRAE 90.1-2013, and 2014 NEC.
[257] District of Columbia Government (2020).
[258] A Mayoral Order established the Construction Codes Coordinating Board (CCCB) in March 2009 to oversee the review and updating of the District’s construction codes, ensuring they met contemporary standards for safe and effective building and maintenance. On February 11, 2026, the D.C. Department of Buildings (DOB) was designated as the lead agency for construction code development. With this transition, the CCCB has been sunset. See https://dob.dc.gov/service/construction-codes-coordinating-board-sunset-21026
[259] D.C. is currently using 2015 codes, six years behind the codes used in VA and MD.
[260] National Association of Home Builders (2019).
[261] The Pew Charitable Trust (2025).
[262] As of fall 2024, 11 states and 5 cities had enacted legislation or amended regulation to allow single stairways for four to six story buildings. JPMorganChase Policy Center (2025).
[263] The Pew Charitable Trust (2025).
[264] See DC Office of Planning (2020) and HUD (2023).
[265] ASHRAE 90.1-2013 / 2015 IECC.
[266] DCRA (2012).
[267] EV-ready requirements are also introducing new compliance risks. Lithium-ion battery fire concerns have led insurers to reassess buildings that previously met sprinkler standards, particularly those with parking garages that include charging stations. In many cases, insurers are reclassifying these garages to a higher hazard category.
In practice, this can require building owners to upgrade sprinkler systems—larger pipe diameters, higher-capacity pumps—to maintain coverage. These retrofits can cost millions and are often not feasible, especially for existing or mid-sized buildings (Risk Logic, 2023).
[268] Love Tomasso (2025).
[269] Seattle Department of Construction & Inspections, Green Building Standard – Overview, City of Seattle, https://www.seattle.gov/sdci/permits/green-building/green-building-standard-overview (last visited Dec. 8, 2025); see also Seattle Department of Construction & Inspections, Green Building – Permit Incentives, City of Seattle, https://www.seattle.gov/sdci/permits/green-building (last visited Dec. 8, 2025).
[270] Portland Housing Bureau, HOU-1.07 – Portland Housing Bureau Affordable Housing Green Building Policy (BCP-HOU-1.07), City of Portland, https://www.portland.gov/phb/phb-affordable-housing-green-building-policy (last visited Dec. 8, 2025); see also City of Portland, PHB Affordable Housing Green Building Policy – Update 1, https://www.portland.gov/phb/documents (last visited Dec. 8, 2025).
[271] City of Phoenix Planning & Development Department, Phoenix Green Construction Code, City of Phoenix (effective July 1, 2011), https://www.phoenix.gov/administration/departments/pdd/tools-resources/codes-ordinance/phoenix-green-construction-code.html (last visited Dec. 8, 2025); see also City of Phoenix, Building Construction Code – 2018 City of Phoenix Building Construction Codes, https://www.phoenix.gov/administration/departments/pdd/tools-resources/codes-ordinance/building-code.html (last visited Dec. 8, 2025); City of Phoenix, 2012 Green Construction Code Amendment – Section 101.2 (Voluntary Compliance), https://www.phoenix.gov/content/dam/phoenix/pddsite/documents/codes-ordinances/igcc_amend.pdf (last visited Dec. 8, 2025).
[272] California Department of Housing & Community Development, 2022 CALGreen Tier 1 Residential Measures (Effective July 1, 2024), https://www.hcd.ca.gov/sites/default/files/docs/building-standards/CALGreen/hcd-shl-625a-rev-0824.pdf (last visited Dec. 8, 2025); California Department of Housing & Community Development, 2022 CALGreen Tier 2 Residential Measures (Effective July 1, 2024), https://www.hcd.ca.gov/sites/default/files/docs/building-standards/CALGreen/hcd-shl-625b-rev-0824.pdf (last visited Dec. 8, 2025); International Code Council, 2022 California Green Building Standards Code (CALGreen), Appendix A4 – Residential Voluntary Measures, https://codes.iccsafe.org/content/CAGBC2022P3/appendix-a4-residential-voluntary-measures (last visited Dec. 8, 2025); see also CALGreen Energy Services, 2022 CALGreen Tier 1 and Tier 2 EV Requirements (Aug. 24, 2022), https://calgreenenergyservices.com/2022/08/24/2022-calgreen-tier-1-and-2-ev-requirements (last visited Dec. 8, 2025).
[273] Bernstein (2008).
[274] DOEE (2021).
[275] Currently, submetering is not allowed in rent controlled buildings in D.C.
[276] Landlords in D.C. can use the capital improvements petition allowable under rent control laws to raise rents to recover capital improvement costs (not routine maintenance). Rent increases are capped at 15 percent for individual units and 20 percent for building-wide improvements and can only begin after the work is completed. Costs must be documented and are recovered over time: 64 months for unit improvements and 96 months for building-wide upgrades. D.C. Official Code § 42–3502.10. Petitions for capital improvements.
[277] This would require changes to the ENERGY STAR Portfolio Manager data.
[278] New York City’s Local Law 97 offers both prescriptive and “good faith”/hardship paths. For details see (Accelerator, 2023; Hoffman, 2023; Jagoda, 2023)
[279] Boston Env’t Dep’t, Building Emissions Reduction and Disclosure Ordinance (BERDO), https://www.boston.gov/departments/environment/berdo (last visited Dec. 9, 2025). On individual compliance schedules, hardship compliance plans, and the Equitable Emissions Investment Fund, see (Torrie, 2024).
[280] While technical assistance is helpful, financial assistance like Green Bank financing are less likely to be usable to landlords because of existing capital stacks. Additionally, some programs offer funding for improvements in return for affordability commitments. This is not a feasible path for many buildings due to lender requirements.
[281] These are used currently in Colorado https://coloradobps.com/. Additionally, DOEE’s proposed Guidebook updates include an Alternative Compliance Agreement where potential penalties are instead paid toward the property’s BEPS compliance.
[282] There is a statutory prohibition on using SETF funds for government utility bills, but it has not been enforced. https://code.dccouncil.gov/us/dc/council/code/sections/8-1774.10
[283] Funded by surcharges on electric, gas, and oil utility bills The Sustainable Energy Trust Fund (SETF) supports the Sustainable Energy Utility (SEU) which helps increase renewable energy and improve energy efficiency in buildings with low-income residents. In previous years, owners were able to get grants for building improvements from SETF. In recent years, the D.C. government has taken over 70 percent of this money to offset their own utility bills, significantly reducing the pool of funds available for building upgrades, electrification subsidies, and energy efficiency investments. For example, $70.1 million of SETF revenue in FY26 (out of a total $100.8 million) was allocated to support government energy costs, with similar allocations planned through FY29, leaving only about $27.5 million for other allowed purposes, including the SEU contract and clean energy projects.
[284] Submetering is prohibited in D.C. rent-controlled buildings.
[285] In October 2023, the NYC Department of Buildings (DOB) clarified “Good Faith Efforts” for Local Law 97, offering a pathway for buildings to mitigate penalties for failing to meet 2024–2029 carbon emission limits. To qualify, owners must demonstrate substantial efforts such as benchmarking, lighting/sub-metering upgrades, and submitting emissions reports, rather than merely failing to comply. https://www.nyc.gov/assets/buildings/pdf/LL88_LL97.pdf
[286] Boston incorporated flexibility measures including hardship exemptions for affordable housing into its Building Emissions Reduction and Disclosure Ordinance (BERDO 2.0) after analysis indicated that rigid, universal emissions caps could destabilize income-restricted housing. The policy ensures that while large buildings must meet increasingly strict emission standards to reach net-zero by 2050, the financial and technical constraints of affordable housing providers are considered. https://www.boston.gov/sites/default/files/file/2021/12/Final%20Amended%20Docket%200775%20BERDO%202_0.pdf
[287] Rebalancing Expectations for Neighbors, Tenants, and Landlords (RENTAL) Amendment Act of 2025, D.C. Law 26-80, 72 DCR 12894, Effective Dec. 31, 2025.
[288] See LeaseRunner (2025), and Panfil, Reichman, Azinulbhai, et al. (2025) for details. For a critical view of the RENTAL Act from tenants’-advocate perspective, see Korber (2025).
[289] A judge can require a protective order in a housing case, requiring the tenant to pay rent into a court escrow account while the case is being decided. This can help prevent rent owed from becoming so large that eviction is inevitable. If the tenant wins the case, they receive the money back.
[290] Some delay is due to judicial vacancy in D.C. Courts, where judges are presidentially nominated and approved by Congress. While D.C. has little control over that system, it can affect other aspects of the system.
[291] National Coalition for a Civil Right to Counsel, “All About the Right to Counsel for Evictions in NYC,” summarizing NYC Office of Civil Justice’s 2018 report on the first year of implementation and reporting that most represented tenants avoided eviction.
[292] See New York City Human Resources Administration, Office of Civil Justice sections on “Legal Services for Tenants – Right to Counsel (Universal Access),” describing free legal representation in Housing Court and NYCHA proceedings; NYC Mayor’s Public Engagement Unit, “Right to Counsel” (program overview); and New York State Unified Court System, “About the Universal Access to Legal Services Law.”
[293] Minnesota Attorney General, Landlords and Tenants: Rights and Responsibilities (Chapter 4 – “Other Important Laws”), noting that in most cases a court hearing must occur within 7–14 days of issuance of the summons; HousingLink, “Minnesota Eviction Process,” summarizing statutory 14-day written notice for nonpayment before filing and subsequent court timelines.
[294] Colo. HB 23-1120, Eviction Protections for Residential Tenants, 74th Gen. Assemb., 1st Reg. Sess. (2023), requiring pre-litigation mediation before filing an eviction for tenants receiving SSI, SSDI, or Colorado Works cash assistance; see Colorado Judicial Branch, “Mandatory Pre-Eviction Mediation (New Legislation 6/7/23)” and “Mediation Services and Other Dispute Resolution Options” (program description and implementation); and ACLU of Colorado, “HB23-1120 – Eviction Protections for Residential Tenants.”
[295] Colorado Housing Connects, “Tenant–Landlord Mediation Program” (free mediation in Denver and Adams counties to avoid eviction); Colorado Housing Connects, “Mediation Helps Landlord and Tenant Avoid Eviction,” May 9, 2025 (case example and 2024 mediation volume); and Colorado Judicial Branch, 2024 Judicial Annual Report (discussion of online dispute resolution and mediation initiatives).
[296] The Mayor’s original RENTAL Act recognized this problem and proposed appeals reforms that would have directly benefitted PUDs specifically: Narrowing administrative standing to parties with a demonstrable injury; requiring bonds for appeals that stop projects; and imposing firm timelines on appeals resolution. These provisions were removed before final passage. Meanwhile, DCBIA continues to push for: binding appeal timelines, standing reform, clarification of ANC “great weight”; and predictable PUD processing rules and deadlines.
[297] City and County of Denver (2025).
[298] See D. I. Schneider et al. (2024) and Arlington County (2024).
[299] City of Phoenix Planning and Development Department (2025).
[300] Raleigh Planning Department (2025).
[301] In Montgomery County, MD an appellate court can impose a bond requirement at its own discretion with no limit on bond amount (Rule 7-205); Boston, MA, allows for surety or cash bond in an amount of not more than $250,000 (Mass. ch. 40A § 12).
[302] Furth et al. (2024).
[303] Seattle Department of Neighborhoods (n.d.)
[304] A recent survey by the District of Columbia Building Industry Association (DCBIA) found that many developers now avoid PUDs altogether and instead opt for by-right projects to circumvent costly and time-consuming appeals. An earlier study was completed by Moravec (2009).
[305] Denver has reformed its zoning code to reduce reliance on PUDs by offering form-based zoning districts and “general development plans” that function with clearer, by-right entitlements.
[306] Raleigh replaced traditional PUDs with a Planned Development District (PDD) process that allows for concurrent rezoning and site plan review, limits the amount of discretionary negotiation required, and imposes clear timeframes for public hearings and decisions. The city also upzoned transit corridors and infill areas to reduce the need for PDDs altogether.
[307] Phoenix still uses a PUD process for large or complex projects but streamlined the timeline by reducing mandatory community meetings, allowing administrative approvals for minor amendments to approved PUDs, and setting firm review deadlines for city staff. Developers are encouraged to use standard zoning districts where possible to avoid PUD delays, and the city has increased the flexibility of base zones.
[308] Seattle has largely moved away from traditional PUDs, relying instead on by-right incentive zoning, where developers can build more units if they provide affordable housing or public benefits. This eliminates lengthy negotiations and hearings associated with PUDs, making the process more predictable and scalable.
[309] Arlington’s Special Exception Site Plan process functions similarly to a PUD but has been reformed over time to consolidated review steps, provide greater predictability through established sector plans and overlay zones, and offer clearer guidance on bonus density and community benefits. While it’s not a full PUD elimination, the reform reduces back-and-forth negotiations and allows multifamily projects in key growth areas to move forward more quickly.
[310] Citizens Budget Commission (2022).
[311] Hoyt et al. (2020a).
[312] For example, including Ontario Place and Skyline/Forest Ridge-Vistas.
[313] California State Board of Equalization, Guidelines for the Assessment of Properties Financed Using Low-Income Housing Tax Credits, LTA No. 2005/044 (July 8, 2005) (directing assessors to value LIHTC properties using the income approach based on restricted rents and to exclude the benefit of federal and state tax credits from income). See also Cal. Rev. & Tax. Code § 402.1 and BOE Property Tax Annotations § 535.0002 (applying § 402.1 where a recorded agreement restricts units to low-income rentals in exchange for tax credits).
[314] Texas Tax Code § 11.1825, Organizations Constructing or Rehabilitating Low-Income Housing: Property Not Previously Exempt (requiring properties qualifying under § 11.1825 to be appraised using the income method). For implementation, see e.g., Dallas Central Appraisal District, “Low Income Housing Cap Rate” (stating that when a property qualifies under § 11.1825, “the chief appraiser must appraise the property using the income method” and “must consider the restrictions on who may rent the property and amount of rent to be charged”).
[315] Martone et al. (2010). For broader statutory context on income-restricted affordable rental housing, see Colo. Rev. Stat. § 29-4-1107 (defining “affordable rental housing projects” with income-restricted rents and specifying that rents must remain stable and tied to household income limits).
[316] Vt. Stat. Ann. tit. 32, § 3481(1) (requiring that for properties with subsidized housing units, assessors use the income approach and consider the effect of state or local laws and regulations on use and value). See also Vermont Housing Finance Agency, “Property Assessment” (explaining that § 3481(1) “dictates that the Income Approach to Value be used to assess real estate taxes for properties with subsidized housing units”) and related Act 68 / Affordable Rental Property Tax Reduction guidance. For background, see State Housing Authority v. Town of Northfield, 184 Vt. 335 (2007), describing pre-2005 inconsistency in valuing subsidized housing and the legislature’s subsequent move to a standardized income-based methodology.
[317] Office of the Mayor (2025).
[318] Portland.gov (2025).
[319] Robinson (2025).
[320] Brey (2025).
[321] Transportation Planning and Programming Division et al. (2016).
[322] https://codelibrary.amlegal.com/codes/chicago/latest/chicago_il/0-0-0-2650943
[323] See Alpert (2018), Whitehead (2018).
[324] See Bakshi Kathpalia et al. (2022), or Cleveland Park Smart Growth (2021).
[325] The Old Georgetown Board and Commission on Fine Arts which govern the Georgetown neighborhood are federal entities, creating further complexity.
[326] Over 60 percent of the 21,769 residential buildings in D.C.’s neighborhood historic districts are in Ward 6 (33.6 percent) or Ward 2 (27 percent), which comprise of the two largest historic districts, Capitol Hill, and Georgetown, respectively. Ward 2, which contains the most neighborhoods with historic designations (16), is the only ward in which historic buildings account for the majority of residential stock (62.8 percent). Ward 4 has the fewest residential historic buildings, which account for only 1.1 percent of the city’s total historic housing stock Bakshi Kathpalia et al. (2022).
[327] Bakshi Kathpalia et al. (2022).
[328] Whitehead (2018).
[329] Portland explicitly defines conservation districts this way and is using them to allow more redevelopment while still shaping neighborhood character (Quadros, 2021).
[330] Bill 26-8, introduced on January 3, 2025 by Councilmember Brianne Nadeau, would require that review of new construction by the Historic Preservation Review Board shall not result in the reduction of housing units or density below what is permitted under zoning. The bill has been referred to the Committee of the Whole, but no hearing has yet been set.
[331] Hughes (2025).
[332] Bronin (2024).
[333] On big institutional or redevelopment sites the Urban Forestry Division often forces redesigns to preserve heritage trees or demands very high mitigation payments; Fannie Mae HQ even did a rare heritage tree relocation, which required significant technical effort, but resulted in the death of the removed tree (DDOT Urban Forestry, 2023; Holland & Knight LLP, 2022; Urban Land Institute, 2016).
[334] Specifically, the District can add a “reasonable use” exception to § 8-651.04a for residential lots over a certain size (e.g., <5,000 sq ft) or in designated infill zones (RA-1, RA-2, alley lots, transit corridors). UFD must find that keeping the tree would preclude a code-compliant primary structure or reduce feasible floor area below a defined threshold (say 0.6 FAR). The city should also create a transparent hardship process with published criteria and timelines, so small owners aren’t stuck in an open-ended negotiation.
[335] City Council of Austin (2010).
[336] Borough of Fair Haven (2024).
[337] See Martin et al. (2025) and E. M. Willis et al. (2024).
[338] Council passed this law, and then temporarily postponed it, but only for government’s own projects.
DC Law 25-0128, 71DCR 2680, Effective from Mar 01, 2024, Expires on Oct 12, 2024.
[339] DC Act 25-0625 DCR 71: 014111.
[340] DC Law 24-0337, Effective from Mar 22, 2023, DCR 70:4308.
[341] DC Law 25-0189, Effective from Jul 19, 2024, DCR 71:9562.
[342] DC Law 25-0244 Effective from Dec 17, 2024.
[343] D.C. Law 25-0202, effective from Aug 24, 2024 71 DCR 10773. It effects the cost of housing projects that receive government supports and serves as a perfect example of how one social priority (creating a preference for unionized labor) can undermine housing affordability. The District’s Chief Financial Officer scored the legislation’s cost to be over $27 million through a four-year period. The fiscal impact statement is available at https://app.cfo.dc.gov/services/fiscal_impact/pdf/spring09/FIS%20Revised%20Project%20Labor-Agreement%20Cost%20Threshold%20Amendment%20Act%20of%202024.pdf.
[344] In 2023, Colorado launched a statewide push to modernize local land use and regulatory practices to support housing growth. While a sweeping land use reform bill failed, the state continues to work through an Office of Housing Recovery to encourage localities to review and revise regulations that block housing. The state’s “Pro-Housing Local Government” designation incentivizes local governments to assess, and streamline permitting timelines, reduce regulatory barriers, and modernize development rules.
[345] In 2023, Montana passed a suite of state-level bills that preempted or required modernization of outdated local regulations. HB 819 and HB 820 require cities to revise and modernize zoning codes and permit processes to prioritize housing supply. These laws included explicit directives for regulatory audits and updates tied to housing outcomes.
[346] Governor’s Housing Emergency Task Force (2023) task force recommended a formal regulatory audit process to review and revise local permitting rules, building codes, and zoning regulations that increase development costs. The task force emphasized prioritizing reforms that reduce costs for high-density and multifamily projects and recommended the creation of a transparent, metrics-driven review process to assess how cumulative regulations impact housing feasibility.
[347] Washington State’s Companion Regulatory Reform Bills to HB 1110 (2023)—which allowed for more types of housing across the state—require cities to conduct regulatory audits of zoning, design review, and building standards. Notably, some cities (e.g., Spokane and Tacoma) have already adopted “housing action plans” that include regulatory review processes focused on reducing barriers to multifamily housing.
[348] Massachusetts passed the Housing Choice Act in 2021 to eased zoning change thresholds to promote housing, but also to encourage localities to conduct comprehensive regulatory reviews of land use and permitting processes. The state’s Executive Office of Housing and Livable Communities now encourages municipalities to adopt “pro-housing” planning processes, including reviews of local ordinances and permitting rules that inhibit multifamily housing.
[349] New York City established the interagency Streamlining Procedures to Expedite Equitable Development (SPEED) Task Force, co-chaired by the Deputy Mayors for Housing and Planning and Operations, with representatives from key city agencies and coordination with state agencies and utilities. The Task Force is charged with identifying permitting and administrative barriers to housing production, recommending streamlining reforms (with an initial report due within 100 days), and overseeing ongoing implementation through 2030.
[350] See Gould Ellen et al. (2020). This range is often used to describe rehabilitation projects—the price can be higher in competitive markets.
[351] The gap between acquisition and new construction has widened over time. See Wilkins et al. (2015).
[352] Roodberg (2025).
[353] Calma (2026).
[354] There is conflicting information on the number of IZ units. The Department of Housing and Community Development’s IZ database notes 4,802 units (https://octo.quickbase.com/nav/app/bi9iqv4v7/action/appoverview) whereas a newsletter circulated by the Office of Planning in March of 2023 noted the delivery of 2,000 units. (https://content.govdelivery.com/accounts/DCWASH/bulletins/350c1be)
[355] A version of this, called Inclusionary Conversions, was first developed by the D.C. Policy Center in 2020 (Sayin, 2020a). In 2021, the city adopted this model under the Generating Affordability in Neighborhoods (GAIN) Act, passed as a part of the FY 2022 Budget, and funded it with $5 million as a pilot project (L24-0043 Effective from Nov 03, 2021). The Executive renamed it as Cash to Covenants (DC Government, 2021).
[356] https://mayor.dc.gov/release/mayor-bowser-unveils-new-tools-add-affordable-housing based on D.C. Policy Center Inclusionary conversions https://www.dcpolicycenter.org/publications/appraising-districts-rentals-chapter-v/
[357] D.C. Policy Center analysis of data presented in HPTF’s FY 2023 Annual Report shows that the per-unit subsidy cost across 13 projects reported for that year varied between $109,000 (Villages of East River Apartments) and $439,000 (Ontario Place), and averaged at $246,000 (DHCD, 2024). At this subsidy cost, $85 million would produce only 340 units.
[358] Rent buy-downs can also be combined with capital subsidies to create more affordable housing and reach deeper affordability goals. Currently, capital subsidies for HPTF subsidies are supposed to heavily support production of housing for households making 30-50 percent of AMI. However, capital subsidies alone cannot meet these levels and the HPTF does not meet its goals. Use capital subsidies to support project feasibility at moderate income levels (e.g., 60 percent AMI) and achieve deeper affordability (30–50 percent AMI) through operating subsidies or rent buy-downs. This approach would allow many more projects at 30 to 50 percent of AMI to pencil out.
[359] Freemark et al. (2026).
[360] The DC Office of Planning would designate tiers based on objective criteria including average rents, recent permitting levels, and project feasibility metrics.
[361] Similar automatic suspension provisions have been implemented in other jurisdictions during economic downturns. For instance, several California cities suspended or reduced IZ requirements during the 2008-2010 recession to maintain housing production.
[362] Phillips (2024).
[363] For example, a San Francisco Technical Advisory Committee (TAC) recommended reducing the city’s inclusionary housing requirement for new developments from 15 percent to 5 percent (Dineen et al., 2026). Seattle’s Mandatory Housing Affordability program was explicitly designed to vary requirements by market strength, with lower obligations in weaker submarkets to avoid suppressing development (City of Seattle, n.d.). Several California cities suspended or reduced IZ requirements during the 2008-2010 recession to maintain housing production. Other examples of jurisdictions considering similar rollbacks include Ontario, Canada (Bennett Jones, 2026) and Boston (Cawley, 2026).
[364] This is particularly true when demand is high and housing costs are appreciating, as is the case in D.C.
Schuetz, J., Meltzer, R., & Been, V. (2010). Silver Bullet or Trojan Horse? The Effects of Inclusionary Zoning on Local Housing Markets in the United States. Urban Studies, 48(2), 297-329. https://doi.org/10.1177/0042098009360683
[365] DC Auditor (2024).
[366] In LIHTC properties, owner-driven certification systems allow units to be leased up in much less time than IZ units. The city centralizes tenant screening and eligibility at DHCD for IZ, inserting itself directly between landlord and tenant in ways that add delay but not necessarily value. Local Housing Solutions (2025). “Inclusionary Zoning.” Available at https://www.localhousingsolutions.org/housing-policy-library/inclusionary-zoning
[367] Currently, prospective tenants who would like an IZ unit must first know it exists, apply through a complex government system with its own search function, and then wait to be referred by the government. Moving this process to be in line with how people normally search for housing would increase access.
[368] This reform would not change affordability levels but would increase the viability of projects by not restricting operating income significantly below federal levels.
[369] Federally administered programs such as Housing Choice Vouchers and LIHTC already allow private utility analysis to replace standardized formulas. For the difference between rent and utility allowances, see footnotes117 and 118 of this paper.
[370] This approach is called income averaging and is used by LIHTC to make mixed-income housing.
Low-Income Housing Credit Average Income Test Regulations. (2022). Department of the Treasury. Available at https://public-inspection.federalregister.gov/2022-22070.pdf
[371] LRSP costs have tripled since 2016, outpacing revenue growth and threatening the program’s long-term sustainability. (Castaldi et al., 2025)
[372] LRSP could replaced with a shallow subsidy for workers earning 30 to 50 percent AMI, who can pay a portion of their income in rent. This would allow the program to reach a much larger number of households as the per-unit subsidy would be reduced by tenant rent and lower overall rent amount. Cort, et al. (2019).
[373] NYC is contending with similar issues with their LRSP equivalent program, CityFHEPS. Their CityFHEPS costs have exceeded their universal childcare costs. Fanelli (2026).
[374] To determine rent amounts, there should be public, tiered payment standards by neighborhood that vary voucher subsidy levels based on local rent data (similar to the Small Area Fair Market Rent (SAFMR) approach used by federal housing authorities). This would allow the District to set higher payment standards in high-cost areas and lower standards in more affordable neighborhoods, ensuring vouchers provide adequate support to access opportunity-rich areas without overpaying in lower-cost markets. Local Housing Solutions (2025).
[375] US Department of Transportation (2024).
[376] CAP (2024).
[377] See Envision Utah (2025) and JPMorganChase Policy Center (2025).
[378] This includes extrenal facades, windows, roof materials, and yard fencing.
[379] Pennsylvania Department of Community and Economic Development. About DCED. https://dced.pa.gov/about-dced/
[380] New York State Homes and Community Renewal. About HCR. https://hcr.ny.gov/about-hcr
[381] Michigan State Housing Development Authority. About MSHDA. https://www.michigan.gov/mshda/about