For an economist, it is odd to think of Washington D.C. as an entity separate from the Washington Metropolitan Area. Metropolitan areas are natural units of analysis for economic and demographic activity, where businesses and residents locate in areas that are most advantageous to their situations. Both the center and the surrounding jurisdictions play a role in making this unit work. The central city of a metropolitan area offers concentrated employment opportunities, and likewise serves as the hub of urban and social services. The dense, diverse neighborhoods surrounding the central city provide opportunities for upward mobility, easy transit, and affordable housing. The outer neighborhoods offer cheaper means of servicing the metro area: businesses in manufacturing, warehousing, and wholesale trade locate there. Across this economic unit, density, income, and concentration of employees and jobs vary greatly, but as a whole, the metro area works.
The District’s economy and demographics are deeply connected to the metropolitan area
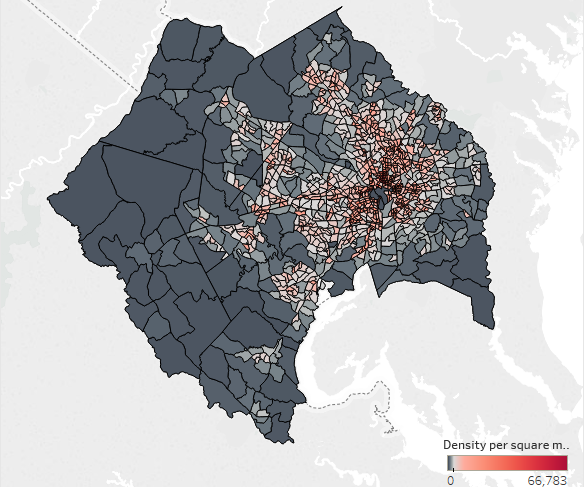
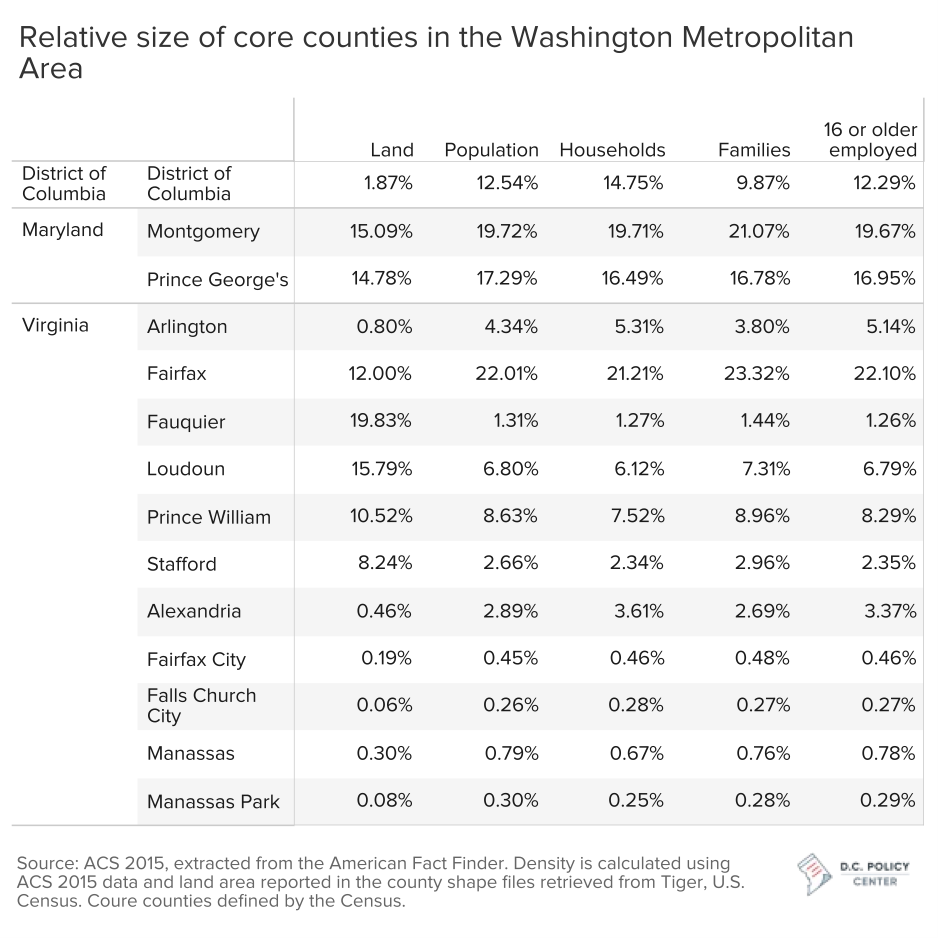
The District holds a disproportionate share of the metro area’s jobs and residents relative to its footprint. Population density is highest in the District with nearly 9,800 persons per square mile (measured at the county level) and falls rapidly as one moves away from the center, especially towards the east. Even within the District-proper, density varies greatly, from over 50,000 persons per square mile in apartment-laden parts of the central corridor, to under 4,000 in the suburban-looking residential neighborhoods east of the River. But once outside the urban core of the District, Arlington, and Alexandria, density declines rapidly and remains rather even.
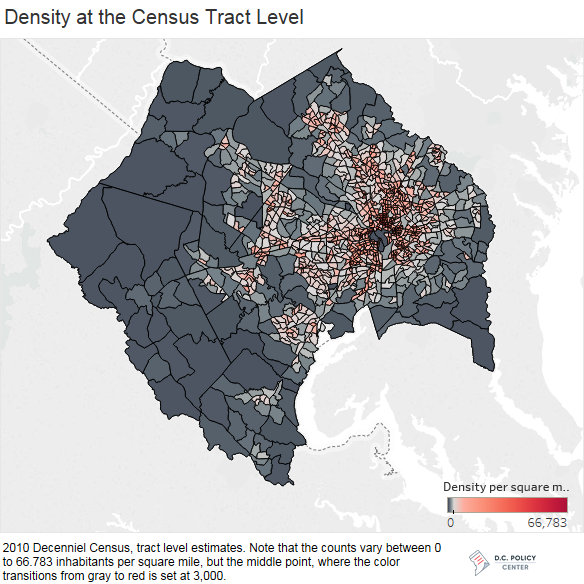
Families favor suburbs over urban areas. That is, most of the density in the urban core comes from singles. The population is racially segregated, with African Americans concentrated in the southeastern neighborhoods of the District and Prince George’s county, and whites (including Hispanics) in the Western suburbs of Fairfax County, Loudoun County, Fauquier County, Stafford County, and Prince William County.
Census tract-level median income data show that the richest live in Montgomery County and northern parts of Loudoun County. While income inequalities could be large, in only in a handful of census tracts, the share of households earning $35,000 or less is over 10 percent. The same holds true for households making over $200,000.
Because census tracts are constructed to hold about similarly sized populations, workers live in neighborhoods spread evenly across the Metro core counties. On average, each census tract holds about 2,800 workers, but 297 out of the 1,177 census tracts in the core Metropolitan Washington counties have more than 3,000 workers.
Of the estimated 4 million work-eligible residents of the Metropolitan Washington’s core urban counties, 2.75 million are employed. District residents make up 12 percent of the core metro employment, while District-based jobs account for 21 percent of all employment. That is, many people commute to the District every day to work (and some commute from the city to the suburbs). Across the core Metro region, on average, 92 percent of those in the labor force are employed, but in a handful of tracts—mostly in D.C. proper, the unemployment rate climbs as high as 37 percent. As a result of the relatively high number of job opportunities in the area, labor force participation is uniformly high across census tracts.
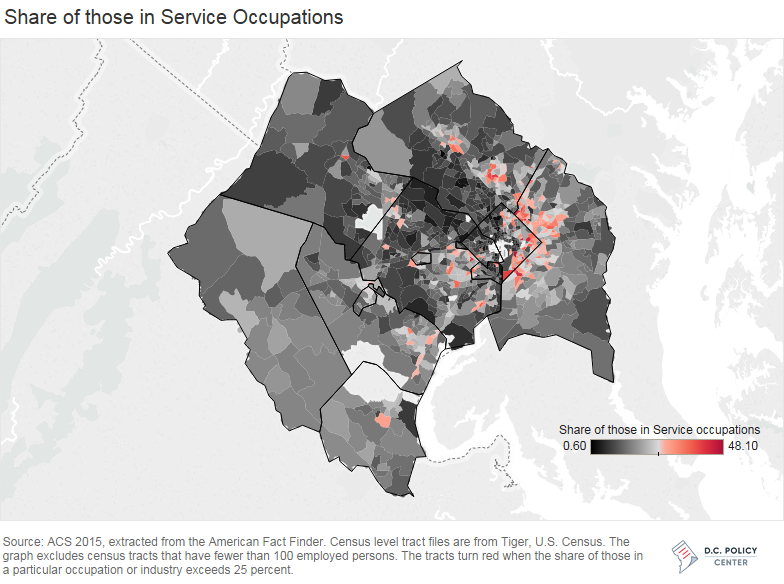
Employment in our region is concentrated in business and professional services and public administration so people holding these jobs live everywhere. Almost every census tract holds at least 500 persons occupied as managers or business professionals and no matter where you go in the Metro region, at least a quarter of the people around you will likely be a manager or a business professional. (In the graphs that follow, the tracts turn red when the number of workers in a certain occupation exceed 500, or their share increases above 25 percent).
Beyond that, the occupational mix of the communities is diverse. Office workers and salespersons live scattered around the region, and more towards the outer counties. They are especially clustered in the southern parts of the metro area (east of the River in D.C., southern neighborhoods in Prince George’s County, and south-eastern neighborhoods in Fairfax, Prince William, and Stafford Counties in Virginia). People holding service jobs are likewise scattered, even more broadly, and they live in areas following an arc that begins in Germantown, runs along I-270 continuing south-east along the Beltway, and then south, along the Baltimore Washington Parkway.
Given the dominance of the federal government, one would expect to find government workers everywhere. But it turns out that government workers live mostly along the southern border of the Metro area, following a north-east, south-west line that begins in Prince George’s County and ends at Stafford County. Looking at industries, rather than occupations, we see that people working for companies in professional and business services live in the central parts of the Metro area. Given the nature of their work, education and health sector employees are everywhere, but those who serve beyond their immediate communities are more likely to be living in eastern Montgomery County and Northern Prince William County. People who work in construction and retail or in hotels and restaurants are thinly spread out.
This is all, in a roundabout way, to say that the dynamics that affect the District’s economy and demographics take shape within the larger Metro area—and are vital to understanding how people live and work in D.C.
Administrative borders confine our policies, not our economy
The District’s administrative borders define where we can pass and follow our own laws and regulations, but those borders are not impenetrable walls that shield us from economic and demographic realities. Workers, residents, and businesses move across the Metro area, paying little attention to where administrative lines are drawn. They are attracted to places with good schools, good services, affordable homes in safe neighborhoods, positive business climates, and easy transportation. They do not care much about what flag adorns the local government buildings. The District, like all other jurisdictions that make up the Metro area, is a small, open economy, drawing from the strength of the region and constantly competing for jobs, workers, and residents. Our policies, investments, and actions reverberate across the metro region, pushing or pulling businesses, workers, and residents in and out of our City. We must pay more attention to our position within the Metro region. We are administratively separate, but when it comes to jobs and people, we are deeply connected to our broader economic unit.
Let’s review.
Jobs – The lost decade
The District holds about 23 percent of all jobs and 21 percent of all private sector jobs in the Metropolitan Washington area. We have more jobs in professional and business services than any other sector (nearly 384,000 jobs, or over half). Our relative strengths, however, reside elsewhere. We hold 38 percent of hospital jobs, 35 percent of jobs in other services (which includes lobbying, associations, and personal services), and 34 percent of jobs in employment services. We are strong in all sectors where the entire Metro area is strong (professional services, education and health, hotels and restaurants) weak in areas where the Metro area is weak, and especially weak in retail. Our economy looks very much like the economies of Northern Virginia and Maryland counties that make up the Metro region, and therefore our intraregional competition for workers and businesses is fierce.
Private sector employment has increased by over 30 percent in the District since 1990. The Metro region surpassed us, however, with a 50 percent job increase over the same period. To be clear, the Metro area did not outperform the District consistently: between 1990 and 2016, in eleven separate years, the District’s jobs grew faster (or shrank slower) than the entire metro region and in one year, it grew about the same.
The big gap in job growth we observe for the 1990-2016 period largely stems from the District’s lost decade—the 1990s, which began with a national recession, continued with a federally-engineered recession as the Federal government reduced its spending in the city, and finally concluded with what can be described as self-inflicted demise that led to the Revitalization Act. By the end of 1997, jobs in the District had shrunk by 5 percent, whereas jobs in the Metro area had grown by 10 percent. Only in 2000 did the District have had as many jobs as it did in 1990. And the big gap in job increases since 1990 is entirely due to our underperformance in this lost decade.
If you were to take your cursor and move our base year from 1990 to 1998, (and you can do this here) to right after the passage of the Revitalization Act, you would see that District jobs increase at a pace similar to the entire Metropolitan Area, still at 30 percent. If you moved the base year to 2009, right after the Great Recession, you would see that we have outperformed the Metro region. Move a bit more, to 2012, and we return to the Metro trend.
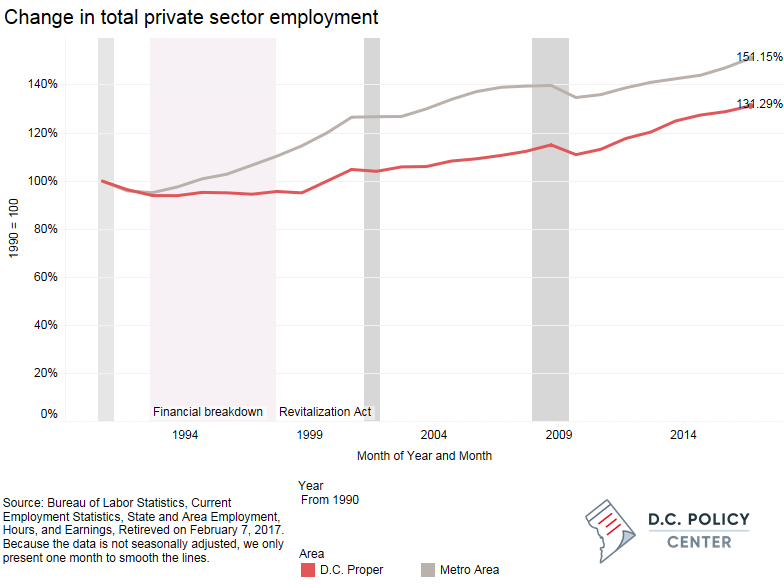
Partly because of this lost decade, employment in the District is now a smaller share of total Metro area jobs than it was 26 years ago, at 21 percent, compared to 24 percent in 1990 (an improvement, however, over 2006, when the District’s share of Metro employment hit bottom at 20 percent). The District experienced the biggest loss in jobs share in professional and business services, down from 24.6 percent to 18.3 percent. And this sector stands out, as it does not follow the U-shaped curves we see in all private sector employment and many other sectors where our employment share dipped sometime before the Great Recession and recovered after that.
There is another bit of unsettling news here: The industry we are losing ground pays significantly more ($92,500, according to BLS estimates) relative to our other key sectors such as: education ($40,290), health and social assistance ($47,840), restaurants ($22,700), hotels ($37,200), retail trade ($25,810) and other services ($68,700).
It begs the question – are we losing relative ground in the Metro area because we are constrained by limited space? The District, according to David Rusk’s classification in his seminal “Cities without Suburbs,” is an inelastic city with no room to expand: it is an old city with a historically limited land area, strict height limitations, and no power to annex its neighbors. The surrounding Metro counties, however, can sprawl.
Data on development suggests otherwise. We have repurposed existing space, increasing density significantly over time. According to the 2016 D.C. Development Report by the Washington Economic Partnership, we added 53 million square feet of office space and 61 million square feet of residential space (about 61,000 units) since 2001. Some of these just replaced existing buildings, but others, like the Wharf at Southwest Waterfront, created density where it did not exist before.
We know that many businesses and workers move to the Washington Metropolitan area due to its proximity to the federal government, and all the professional and contracting services that support it. What we don’t fully understand, however, is why firms locate where they do within the Metropolitan area. The research on the impact of taxes on business locational choices and economic outcomes show mixed results. Studies that look at the relationship between state-level taxes and economic growth by comparing different regions and jurisdictions generally find that taxes matter, but not materially (see here, and here, among many). Furthermore, tax cuts at the expense of public expenditures can hurt growth (see here, and here). On the other hand, firms do care about a favorable business climate, including availability of skilled workers, strong public investments, and a high quality of life. Other studies that look at connections between any type of tax that imposes costs on businesses, not just corporate income taxes, find closer relationship between the local tax system, business decisions, and economic outcomes. Studies that explore firm-level decisions find a stronger relationship between the tax regime and business location choices. There is some consensus around the idea that local taxes matter more for intra-regional outcomes (as in our metro region) than inter-regional outcomes (like D.C. competing with Atlanta).
This is, however, a very important question for the District of Columbia, one we will fully explore in our future at the D.C. Policy Center.
People – Housing and Transportation
The District’s population boom has been spectacular. We grew year after year in the last 11 years and added over 114,000 net-new residents. However, today’s city looks nothing like it did before the turnaround began. East of the River no longer holds the bulk of the residents. That standing now belongs to the Central Corridor, which draws families with young children. Restaurants and shops have spread to these neighborhoods, but are still largely missing in neighborhoods east of the River, especially in Anacostia. Some of this population growth is coming from babies, but life-changing events such as marriage and having a child are still important predictors of who is going to leave.
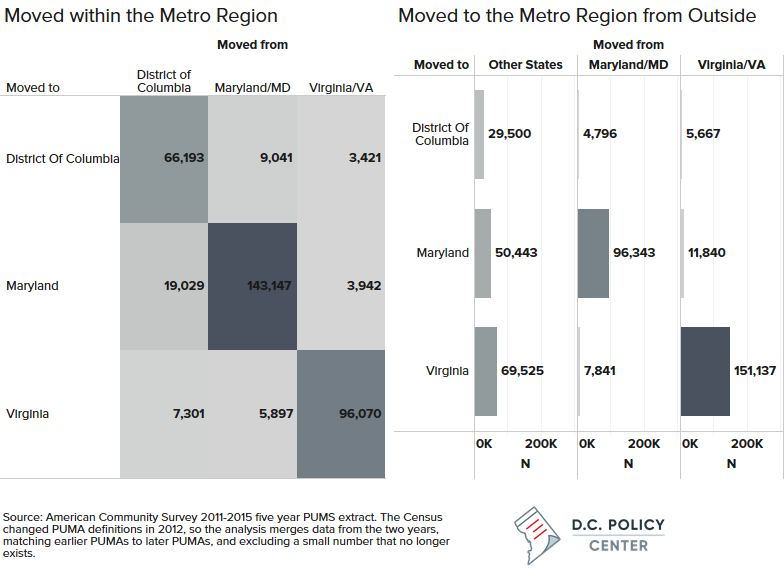
People move frequently within the Metropolitan Washington Area. And when people move, they mostly move nearby. In the five years between 2011 and 2015, on average, the District welcomed 52,000 new residents from other states including Virginia and Maryland. And yet, moving companies received most of their business from our own residents as 66,000 moved within the city. While the Census data is not very good at telling us specifically where these people moved from, we have a bit more information on where they move to. For most of those who move (including within the city) the final destination is the central parts of the City. In fact, 25,000 of the residents who moved within the city moved within the Central City neighborhoods.
More people move out of the District to elsewhere in the Metropolitan Washington Area than the reverse (move from the surrounding Metro area to D.C.) Between 2011 and 2015, each year, on average, 26,000 moved from the District to the surrounding counties in Maryland and Virginia. Only about 12,000 residents from the same counties moved to the City. We received a lot of new residents from areas outside the metro region: on average, 29,500 residents from other states, and roughly 10,000 from parts of Maryland and Virginia outside the metropolitan region. But Maryland and Virginia received many more, nearly 148,000 combined.
In sum, net in-migration is a strong source of population growth in the city. Our gains, however, are very small compared to the gross in-migration to the area. The District keeps about 13 percent of those who moved into the City. We get about 52,000 new residents from other states each year. We send about 26,000, however, to places within the Metropolitan area, and about 18,000 to places outside of the Metropolitan area. This leaves the District with a net resident increase of about 7,500 persons from migration, and there is some evidence that this is on the decline. The rest of the population increase comes from babies.
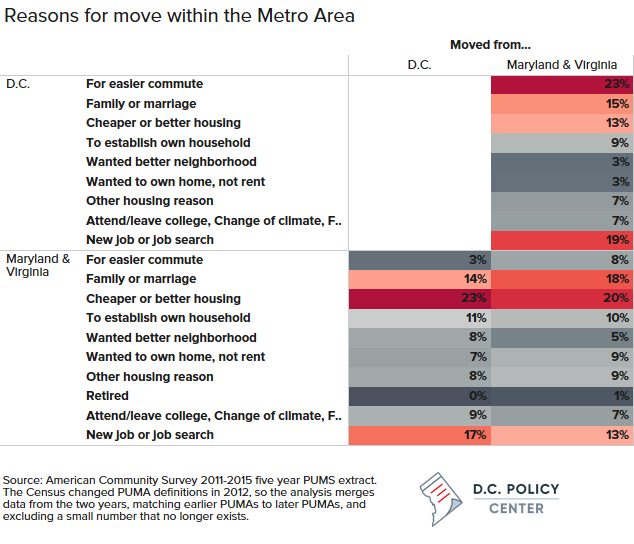
Housing and an easier commute are the top two reasons why people move within the Metropolitan Washington Area. For the District. an easier commute is a real attraction. It is the topmost reason why people move from Maryland and Virginia to D.C. Housing, however, is a real push factor: 23 percent of those who left the for the suburbs cite cheaper or better housing as their reason; housing is also the biggest explanatory factor for moves that happen between Maryland and Virginia.
Jobs constitute the third most important reason for intra-regional moves. For a Metro resident who just got a new job (or lost one) the final destination could be anywhere in the Metropolitan area. About 19 percent of those who relocated to the District, 17 percent who moved from the District to Maryland and Virginia, and 13 percent who moved between Maryland and Virginia cite a change in job status as their reason for moving. Change in marital status or other family-related changes are also equally likely to send a person to the District, Virginia, or Maryland.
What these numbers show us is that housing, jobs, and commutes shape our demographic ebbs and flows. D.C. Policy Center Fellow Kate Rabinowitz shows in her recent piece for the Policy Center that population increases have made the District whiter, wealthier, and younger, and this has contributed to the increasing income divide. Housing costs reinforce this trend. Middle class wage earners, especially lower middle-class wage earners, flock to the suburbs in search of affordable housing, where upward mobility is strong and income inequality is relatively smaller compared to the District.
The D.C. Policy Center’s Research Agenda
The District has many strengths, some of which are rooted in its Metro area.
- It benefits from a large source of high skilled workers. Our skill profile, measured as a mix of abstract, routine, and manual skills, looks most similar to the skills in the Bay Area. And these highly skilled workers—our creative class— are spread around the Metro area in both urban and suburban neighborhoods. While income gaps and wage gaps are high, the metro area is growing and dynamic.
- The District’s economic base is much more expandable than what our geography would suggest. Our residential and commercial inventory grew rapidly with our population, and we have invested in subsidized affordable housing for our poorest residents. Compared to many other cities, we have more progressive housing policies, and as D.C. Policy Center Fellow, Becky Strauss, will show in an upcoming post, housing costs are relatively lower for our poorest residents compared to other cities.
- Our education sector is improving as robust public spending have supported growth in the sector. Education is another important push (or pull) factor for residents, and in the last ten years, the system has turned around from net losses in enrollment to strong gains.
- Residential employment is growing faster than the jobs in the City, so our income tax base is increasing faster than salaries paid in the District.
- The City is financially strong, and general revenue has risen fast enough to fully implement a major tax reduction package approved in 2013.
But there are pitfalls:
- The District’s economy is too specialized and sensitive to changes in federal government policies. Recessions, changes in interest rates, capital flows, technology—the list goes on—exert a lot of influence. We must bring this wider world into our focus.
- Jurisdictional fragmentation and tensions among the localities that make up the metro area threaten growth. Our collaboration with surrounding jurisdictions is weak. Transportation is the prime example of this weakness, but there is no effort among the District and its neighboring jurisdictions to collaborate on housing, workforce development, labor laws, or social safety nets, all areas where such collaboration would be most meaningful.
- Our policy-making process does not encourage the employers to take part in solutions to our social and economic problems. Our policymakers pay little attention to the forces of the open and competitive economy that is the Metropolitan Area.
- High and middle-wage job creation has slowed down in the city, with private sector job growth coming from employment in retail and hospitality
- Some of our most vulnerable residents have not benefited from the recent increase in resident employment, underscoring the weaknesses in workforce development.
- Protectionism and NIMBYism are on the rise, limiting opportunities for lower income residents and future generations.
- While subsidized affordable housing units have increased, housing choices for middle-class families are shrinking.
These observations inform our research at the D.C. Policy Center. Growth in jobs and people are the core metrics of success for our city. We are focused on considering what the city will look like 50 years from today and investigating what policy reforms could best advance our city’s long-term strength.
Stay tuned.