Update: WAMU explored the data reported to DOEE by the Watergate East, reporting on where the data is wrong and why it matters (“Is The Watergate Actually D.C.’s Biggest Polluter?“) The text has been updated to include this information and to link to the article. (9/5/5017) In addition, the text and figures in this post has been updated with corrected figures for emissions for George Washington University, and to more clearly state the year of the main data set. (9/2/2017)
In 2006, the D.C. government set out to address climate change, specifically with a commitment to minimize carbon pollution. D.C.’s Climate Action Plan sets lofty goals. Their ambition is to reduce carbon emissions to 50 percent of 2006 levels by 2032, and 80 percent by 2050. In an effort to track the project, the city initiated a greenhouse gas inventory. The inventory identifies the foremost sources of greenhouse gasses and measures pollutants. According to the D.C. Department of Energy and Environment, between 2011 and 2013, greenhouse gases fell 23 percent citywide.
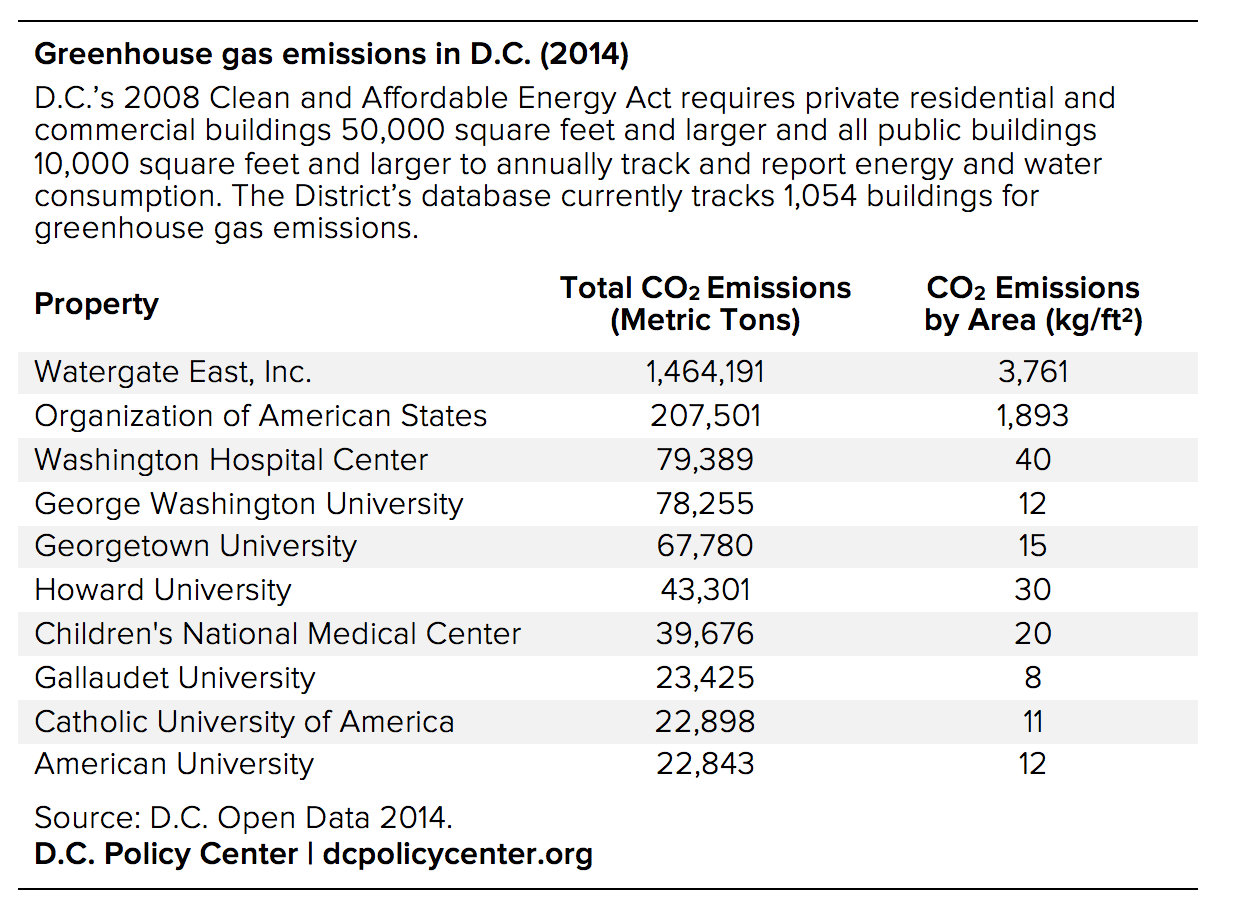
The most recent inventory from 2014 shows that out of D.C.’s 161,500 buildings, only 1,054 are currently tracked for greenhouse gas emissions. Why are so few buildings currently in the inventory? In 2008, D.C.’s Clean and Affordable Energy Act set clear guidelines to who would be tracked in the greenhouse gas inventory: All private residential and commercial buildings 50,000 square feet and larger, and all public buildings 10,000 square feet and larger. Most buildings in D.C. do not have a physical footprint that large. While the current (2014) inventory is only a fraction of D.C.’s total building inventory, it captures some of the largest potential emitters—and is a marked improvement from the 280 buildings inventoried in 2011.
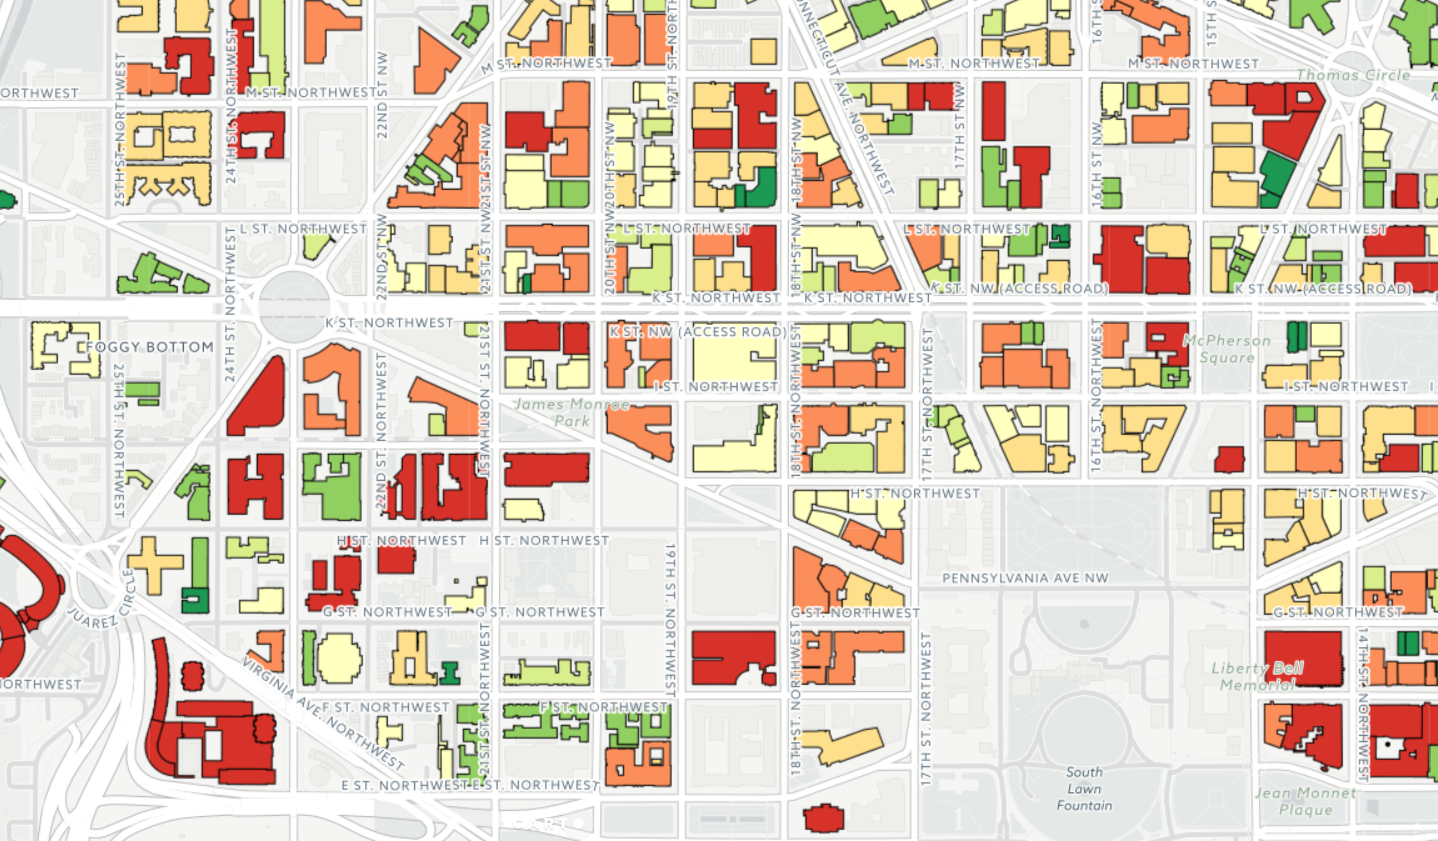
Below, you can see a map of all buildings included in D.C.’s greenhouse gas emissions inventory. CO2 emissions are visualized in two ways on the map: One layer displays total CO2 emissions for a property, while the other displays a property’s CO2 emissions by area (as kilograms per square foot).
The Watergate tops the greenhouse gas inventory
The current inventory of large properties in D.C. shows that various universities, hospitals, hotels, and offices top the list as emitting the most CO2 in D.C. as of 2014. The Watergate has the largest total emissions of buildings inventoried with 1,464,191 metric tons of CO2 emitted, far more than any other building on the top ten list. According to an investigation by WAMU, this appears to be an error in data reported by the Watergate East to the Department of Energy and Environment, and likely reporting errors in the data for the Organization of American States as well.
Click here to read more about the limitations of this data.
How D.C.’s universities compare on carbon emissions
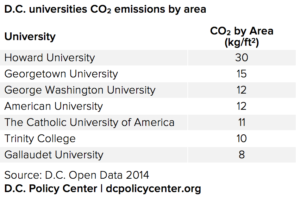
Universities are among the largest tracked greenhouse gas emitters in the District’s database of large buildings. But how do they compare in their current performances? Due to the range in campus sizes and enrollment, total emissions is not the best mode of comparison. So how do the universities stack up when comparing emissions by area or by enrollment?
Universities’ footprints range from 30 kg CO2/sqft for Howard University to 8 kg CO2/sqft for Gallaudet University. (An earlier version of this post misstated the greenhouse emissions for George Washington University; its numbers are 12 kg CO2/sqft, and 2.8 metric tons/student. These numbers do not include George Washington University Hospital, which is not owned by George Washington University, and includes 2100 Foxhall Road, which was not originally included in the analysis.)
To aid in reducing their carbon footprints, many universities have enacted climate action plans. George Washington University plans to reduce their carbon footprint by 40 percent by 2025 using a mix of energy reduction and conservation projects, utility supplier fuel mix changes, on-site renewable energy generation, transportation reduction initiatives, and sustainable procurement practices. As of 2014, Georgetown University has reduced its carbon footprint by 71 percent, achieved principally through the procurement of renewable energy certificates (RECs).
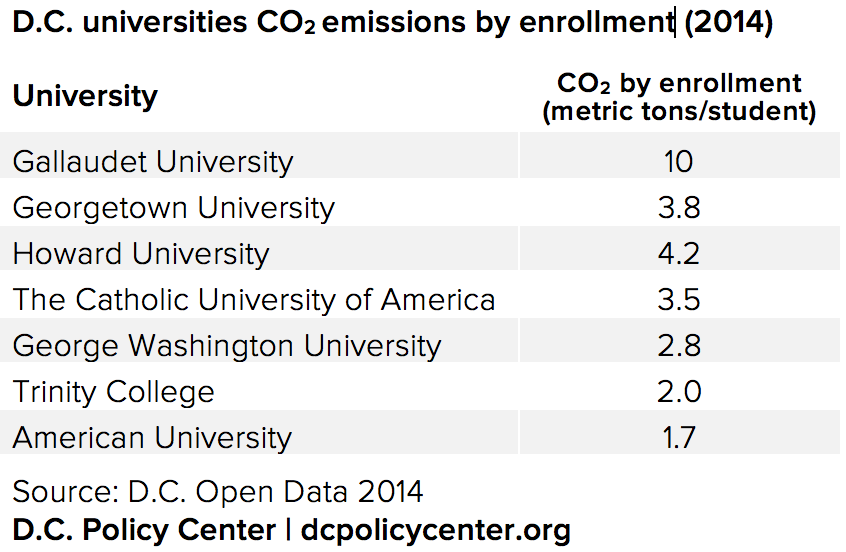
Why is there such a range in CO2 emissions? This may be partially due to overall enrollment. The more students that hare being served, the more energy that is consumed, thus and increase in the CO2 emitted. Examining emissions per student enrolled, Gallaudet University leads at 10 metric tons of CO2 emitted per student. American University is has the smallest carbon footprint per student at 1.7 metric tons of CO2 emitted per student.
But while these large universities top the inventory chart today, they are also leading carbon footprint reduction efforts in D.C.
Leadership in green
It’s clear that D.C. is making an effort to reduce greenhouse gas emission. They have set good example in many categories. D.C. was one of the first cities to pass laws requiring green building certification, is 1st among large cities in LEED certification, and is a forerunner in green power purchases. Currently, D.C. incentivizes businesses and residents through programs such as the Green Light Grant Program, which offers provisions to ventures that “green” the built environment, and funding for Large Parcel Tree Planting, which offers benefits of carbon sequestration by newly planting trees. D.C. should continue their efforts to lead, to provide incentive, and encourage residents to take pride in their environment. After all, we are the nation’s capitol; we should be the example that others look to.
About the data
Update (9/5/5017): WAMU explored the data reported to DOEE by the Watergate East, reporting on where the data is wrong and why it matters (“Is The Watergate Actually D.C.’s Biggest Polluter?“) The text has been updated to include this information and to link to the article.
Update (9/2/2017): The text and figures in this post has been updated with corrected figures for emissions for George Washington University, and to more clearly state the year of the main data set.
Data for greenhouse gas emissions and building footprints acquired from D.C. Open Data. Analysis of greenhouse gas emissions conducted on the most recent year available, 2014. Emissions data is published for individual buildings, however, there are several exceptions. Exceptions include organizations such as Georgetown University and American University that may list multiple buildings but only publish overall emissions for all property owned. For those exceptions, calculations were based on overall emissions for the entire organization. To map the data, building emission data was matched to building footprints through a spatial join, aligning latitude and longitude provided in the greenhouse gas inventory over shapefiles of all building footprints. Only buildings listed in the inventory are included in the map. A complete write-up of the carbon emission calculations is now available on the D.C. Policy Center Data Blog. You can find complete code for the analysis and visuals on my github page.
D.C. Policy Center Senior Fellow Randy Smith is a Geographic Information Systems (GIS) Specialist and a lecturer at Hood College in Frederick, MD. He has an MSc in Geospatial and Mapping Science from the University of Glasgow. He has a passion for maps, baking, and running. He lives in Tenleytown with his wife.