D.C.’s story is frequently told through income inequality and poverty. But there is also a part that is seldom explored—that D.C.’s poor have access to stronger social support programs than in many other large American cities. Economic growth has certainly helped with D.C.’s policy regime, which has generally increased resources and programs available to its residents who live under the poverty threshold. Advocacy groups, too, have played a crucial role highlighting the need to invest in poor neighborhoods and residents.
Today D.C. has some of the country’s most progressive anti-poverty programs—from affordable housing policy to health care and employer protections to universal pre-K. In other areas where D.C. compares less well—welfare, workforce development, or education—policies are heading in the right direction.
Inequality, poverty, and unemployment
The data is indisputable when it comes to income inequality. D.C. has among the worst income inequality of any large American city. This can reflect a dynamic and growing economy. Poverty and inequality are generally worse in cities than the rest of the country, and cities with vibrant economies tend to have the highest inequality of all. They entice the best-educated with higher wages, while the poor can access more social services like public transit or subsidized housing. They are also surrounded with vibrant suburban communities that offer opportunities for upward mobility. The downside of this rapid growth is concentrated poverty and segregation.
One good measure for inequality is the “95/20” ratio, or the difference between residents in the top 95th income percentile compared to those in the bottom 20th. Here, D.C. ranks seventh out of the most-populous 100 American cities. Since the Great Recession, inequality increased in most American cities, but it increased by an unusually large amount in D.C.
D.C.’s rich are mostly driving that increase in inequality. The Bush and Obama years have been good for highly skilled professionals, like the lawyers and federal contractors that make up the backbone of the District’s high-income earners. Those 95th-percenters have seen their incomes grow by a whopping 10 percent, rivaling growth in the tech-driven Bay Area. Now only San Francisco’s rich are richer than D.C.’s.
D.C.’s bottom-20-percenters have actually fared much better than those in other major cities. Most everywhere else, their incomes declined by a sizable amount, averaging a 12 percent drop in cities nationwide. But in D.C., there was no statistically significant change in their income level. Today the average income for D.C.’s bottom 20-percenters ranks well above-average for major cities.
In D.C., the 20-percenters’ incomes also go farther in covering living expenses than in a lot of other cities. To be sure, D.C. is ground zero in battling gentrification and climbing rents. As of 2014, rental costs made up nearly half of 20-percenters’ incomes. A good rule of thumb is that people are “rent burdened” when they pay more than 30 percent of their income on rent. But the rent burden for 20-percenters is higher in 32 other cities, including Baltimore, Los Angeles, Philadelphia, and even Detroit, in large part because incomes tend to be lower in those cities.
The District is also one of the few American cities where density and public transit means residents can forgo a huge expense—owning and maintaining a car. When housing and transportation costs are included, D.C. suddenly becomes among the less burdensome cities for a low-income person to live.
Nor is poverty reaching a crisis compared to other cities. D.C.’s poverty rate, which has been stable at 17 percent, is almost exactly average for cities. Its poverty is less geographically concentrated than most—defined as the share of poor people who live in neighborhoods where poverty rates are 20 percent or higher. And whereas the trend in the vast majority of cities is growing poverty concentration since 2000, this is not the case in D.C.
On the downside, the District does have a relatively bigger racial inequality problem. The District’s black poverty rate is roughly at the national average for cities, but remains nearly four times larger than the white poverty rate—the fourth biggest gap in the country. This is mostly because D.C.’s white poverty rate is so low. The unemployment rate gap between black and white residents is just as big. Although D.C.’s black unemployment rate is higher than average for black residents in other cities, the even bigger story is that the white unemployment rate in D.C. is the lowest in the country.
In D.C., the rich, who tend to be white, are careening ahead of everyone else. Lower-income residents are not closing the gap. But fortunately, the poor are not becoming poorer in absolute terms (but are more segregated), which is better than most American cities since the Great Recession.
| Indicator | Rate | Rank out of 100 Largest Cities) |
|---|---|---|
| *Not statistically significant at 90% confidence interval **Includes Alexandria and Arlington in Virginia |
||
| Income inequality ratio (95/20) – 2014 | 15.1 | 7 |
| Income inequality growth (95/20): 2007 to 2014 | 2.10% | 17 |
| Average income of highest 95th percentile: 2014 | $320,679 | 2 |
| Income growth of highest 95th percentile: 2007 to 2014 | 10% | 7 |
| Average income of lowest 20th percentile: 2014 | $21,230 | 22 |
| Income growth of lowest 20th percentile: 2007 to 2014 | -6%* | 23 |
| Rental cost as a percent of income at lowest 20th percentile: 2014 | 48% | 33 |
| Share of Poor Residing in Tracts with Poverty Rates 20 percent or higher: 2008-12 average** | 53% | 86 |
| Change in Share of Poor Residing in Tracts with Poverty Rates 20 percent or higher: 2000 to 2008-12 average** | -1% | 86 |
| Black poverty: 2015 | 26.60% | 51 |
| White poverty: 2015 | 6.90% | 14 |
| Black unemployment: 2010-14 average | 17.50% | 73 |
| White unemployment: 2010-14 average | 3.20% | 1 |
Pro-poor spending and tax trends
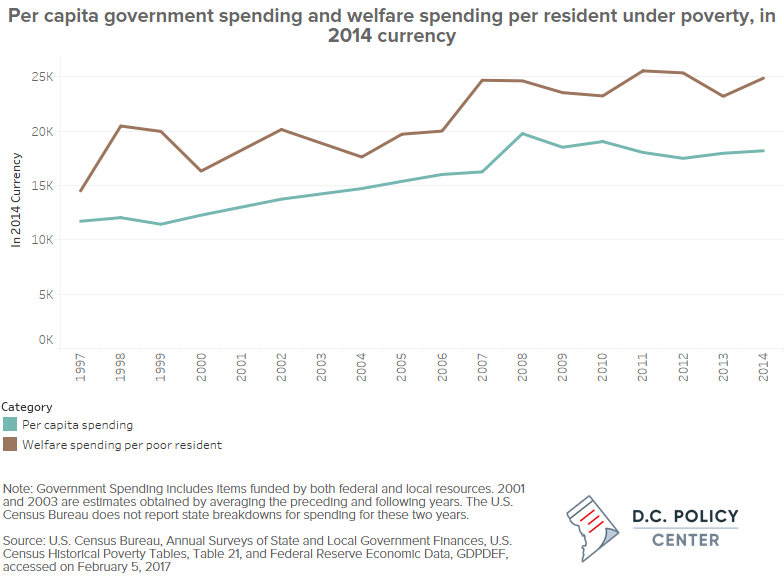
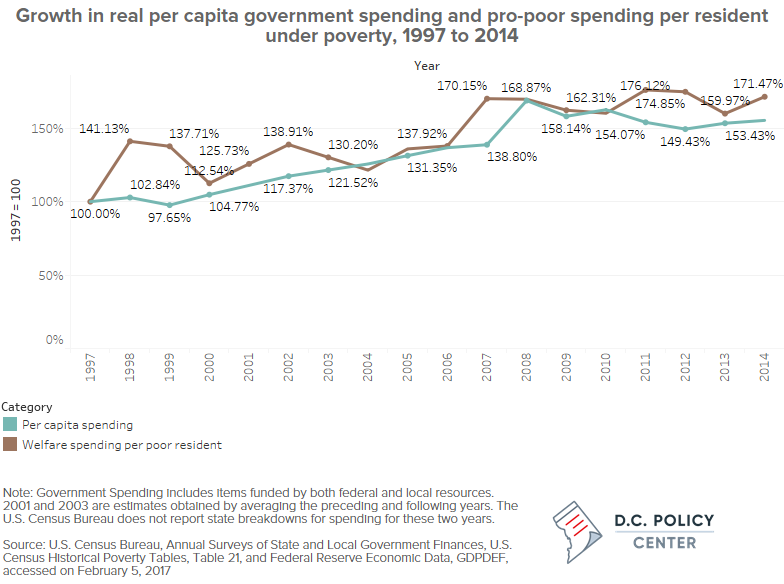
For the policy picture, let’s start with the broadest measure—per capita real spending by the D.C. government. Welfare spending can serve as a good proxy for pro-poor spending. Between 2014 and 1997, real spending per welfare recipient was consistently higher than regular per capita spending. It also increased faster. Over that period, per-recipient welfare spending grew by 171 percent in real terms, while per capital government spending grew by 153 percent. D.C.’s income tax regime is also highly progressive as well. Families earning under $25,000 have the second-lowest income tax burden (families in New York City have the lowest), and those earning above $25,000 pay a tax rate that is higher than average.
Health care
D.C. is a leader in low-income health care access. All states provide insurance for low-income children through Medicaid or SCHIP, but they can set their own income eligibility cut-off. D.C.’s children’s Medicaid eligibility cut-off, at 324 percent of the federal poverty line, is the third-highest in the country behind New York and New Jersey. For single adults, D.C.’s eligibility standards are by far the most generous, with a cut-off at 215 percent of the federal poverty level. No other state even comes close. For states that offer Medicaid to single adults, practically all set their cutoff at 138 percent. Two-fifths of states exclude single adults from Medicaid entirely.
This is a big reason why D.C. has the second-lowest uninsured rate of any large city. In 2015, just 5 percent of D.C. residents were uninsured, compared to 10 percent nationally. Only Boston’s rate is lower, thanks to Massachusetts’ near-universal insurance program.
D.C.’s public health insurance for low-income residents actually predates Massachusetts’ system. D.C. created the locally-funded HealthCare Alliance in 2001 to get around federal Medicaid restrictions so that, for example, undocumented immigrants could receive free insurance. During the Obamacare Medicaid expansion, D.C. simply shifted its already insured low-income residents into the federal Medicaid system. The HealthCare Alliance still exists to serve undocumented immigrants.
Worker protections
In the last year, the D.C. government has been ratcheting up worker supports and protections that target low-income residents. If all proposed legislation passes and gets implemented, D.C. will have among the most progressive worker protections in the nation.
This is especially the case for paid family leave, as passed by the Council in December of 2016. Several other municipalities already have paid leave, and San Francisco’s newly-enacted program will have the highest replacement rate of all, providing 100 percent of a person’s wages even for those earning $100,000 a year. Others, too, have longer paid leave durations. But when it implements its enacted program, the District will be only one of two jurisdictions (along with California) to have a tiered replacement rate where the lowest income workers (who also have the least job security) would receive the highest replacement rate. D.C.’s highest replacement rate—90 percent for those earning up to twice the minimum wage—is substantially higher than what it would be in California (70 percent). This matters because studies have shown that low-income workers tend not to take up paid leave unless the replacement rate is high. The tax structure to pay for it is uniquely progressive as well. Everywhere else, the specific tax is applied to only a fraction of wages for a high-income earner. This is called a “tax cap.” Not so in D.C., where all wages are subject to the tax. The rich, then, would take on a larger burden to fund a paid leave scheme designed to benefit the poor the most.
The District’s minimum wage hike, which was approved in 2016, would similarly catapult the city to sharing the nation’s highest minimum wage by 2020. The District would join jurisdictions like California, New York, Connecticut, and Seattle, which have all voted to move toward a $15 minimum wage. This would put D.C.’s minimum wage on par with the city’s projected living wage. Right now the minimum wage ($11.50) is a few dollars short. For the first time in a decade, D.C. increased the weekly maximum unemployment payment, which had been a stingy $359, to a nationally about-average $425. And the rules were tweaked so that unemployed residents can receive more of their unemployment insurance if they land part-time employment.
The D.C. Council proposed and adopted several other pro-worker bills last year, including barring employers from inquiring about salary or credit history, guaranteeing a minimum of 30-hour week schedules for building service workers. and requiring more predictable work schedules for hourly employees. The first two of these measures had passed but needed the city to set aside money for enforcement. (Mayor Bowser’s fiscal year 2018 budget proposal provides funding for both these measures as well as additional funds to enforce the minimum wage requirements). The last measure has been left off the table, at least for now, to ease the burden on businesses who could soon be saddled with an expensive paid leave scheme. But the overall momentum of D.C. government policy has been toward more worker supports for the neediest.
Workforce development is one area where D.C. has historically under-performed. But positive change could be coming. The city is beginning to do basic performance management—tracking program services and how graduates fair in the labor market. A new computer platform called DataVault should improve service coordination across partners and agencies. The Mayor’s 2016 master plan intends to overhaul the whole system.
Welfare
The District does not have an especially generous welfare system. The city has taken steps to loosen eligibility criteria, allowing more families to qualify for food stamps. But food stamp rules are set by the federal government, with little room for local governments to expand the program. Where D.C. has more flexibility to expand programs—for example, with TANF policy, the federal cash-assistance program for low-income parents—the city has not. Although D.C. did implement a series of increases in TANF payments since fiscal year 2015 (that collectively would increase total TANF benefits by about 46 percent by 2019), the maximum monthly benefit for TANF, which now stands at $508, is only slightly above the average nationally.
States can decide whether to impose a hard time limit on receiving TANF benefits. Most states allow a broad array of exemptions that keep the neediest families on the benefit rolls. But D.C. has gradually moved from a system with no real time limits to one with a strict 60-month limit from which very few are exempt. The Mayor’s fiscal year 2018 budget proposal once again eliminates time limits, but sanctions all families who do not meet their work or other requirements for up to half their total TANF benefits.
Housing
D.C. has a larger policy arsenal to fight for affordable housing than most anywhere else, and the Council and Mayor have recently gotten serious about ramping up that fight. Affordable housing is a huge challenge facing D.C.’s low-income residents. Given the large gap between demand for housing and supply of housing, the market left alone will no longer be able to produce affordable housing. Any solution will therefore have to involve government intervention.
D.C. is one of a handful of cities that has a Housing Production Trust Fund. It provides local gap financing for developers to build or maintain affordable or low-rent housing without losing money. It’s the single biggest component of the D.C. budget that goes toward affordable housing. In 2016, Mayor Bowser pledged to place $100 million in the fund every year in the form of a budget line item. (Funding used to be tied to real estate sale tax revenues and therefore fluctuated year to year.) Now developers can count on a fund flush with cash every year. And at $100 million a year, the Trust’s funding level is the highest per capita in the country. One real barrier appears to be the city’s ability to spend these amounts every year, but the fiscal year 2018 budget ramps up administrative funds, which can ease this problem.
D.C. is also one of a handful of cities that has a locally-funded housing voucher program. These vouchers are given out to residents who do no already receive a federal housing voucher, and cover the difference between what you can pay and the actual rent. Because of the local voucher, in 2016, an additional 3,500 families got affordable housing on top of the 12,000 who receive federal vouchers. Since 2013, both the number of available vouchers and the amount of rent they will cover has gone up. And there is more in the fiscal year 2018 budget proposal.
Other existing programs are set to produce much more affordable housing than in the past. Until recently, Inclusionary Zoning (IZ), established in 2005 and which requires developers to include some amount of affordable housing, produced few units. The market crash took the steam out of new construction and grandfathering old rules for carried-over development projects. In 2013, only 104 IZ units came on the market. Now things are picking up. There are roughly 5,000 IZ units in various stages of development. Land disposition rules were changed in 2014, requiring—for the first time—that developers include affordable housing when they acquire city land. The affordability requirement is hefty, too, at 20 to 30 percent of all new units. By comparison, IZ projects typically are 11 percent affordable.
D.C. is a “tenants’ rights” city. It’s harder for landlords to evict their tenants compared to most other cities. Cities in only four states—and D.C.—have rent control laws. D.C. has its own unique Tenant’s Right to Purchase Act, or TOPA, which gives tenants first dibs on buying their unit if their landlord wants to put it up for sale. The D.C. government funds non-profits to provide free legal advice to help tenants figure out if TOPA is right for them. TOPA is not necessarily a way to preserve affordability, however, as the best-organized and most highly-resourced communities are the ones most likely to buy their buildings through TOPA. And the market does often overwhelm TOPA, with developers offering tenants buyouts that are too good to refuse. TOPA can also frustrate affordable housing developers’ plans, as any restructuring in income or financing can trigger a TOPA initiative. But TOPA is a gentrification roadblock that no other city offers. And the Mayor’s fiscal year 2018 budget proposes to put $10 million to support to TOPA applicants. (To be sure, not all this money is new, but now there is a clear program dedicated to TOPA support.)
D.C.’s homelessness policy is relatively progressive as well. Just a few cities provide shelter for all homeless families year-round—and as of last year, D.C. is one of them. D.C. General, the city’s dilapidated, unsafe, and overcrowded family shelter, is slated to shut down, if the city can overcome neighborhood objections to shelter locations. The Mayor’s plan for smaller family shelters spread out within the community is moving forward, albeit with some objections from communities remaining in the way.
To be sure, all this is not enough to solve the city’s affordable housing crisis. Only 40 percent of low-income families get affordable housing who need it. Satisfying all need by 2020 would cost in the range of a few billion dollars, yet the city spends only a few hundred million a year. But these efforts may still be enough to reverse the trend toward fewer affordable housing units. A complete tally of the affordable housing stock does not exist, but there is reason to believe the stock could now be going up. The city is doing more for affordable housing than ever before.
Education
The District is one of a few jurisdictions with universal pre-K. Its system has received among the highest marks in quality and access compared to other states, and has the highest enrollment rate for 4 years-olds (86 percent) in the country. D.C.’s pre-K system is fully integrated with the public school system. Funding is therefore reliable and teachers get paid the same as in the traditional K-12 system. In most states this is not the case.
The K-12 public education system is still recovering from decades of mismanagement. D.C. has a terrible high school graduation rate (69 percent) and yet also spends the most per-pupil of any school district in the country. The city has a long way to go before anyone can argue it provides quality public education to low-income residents.
But things are looking up. The recent population boom has shed light on the need to improve the system. The city is at the forefront of experimenting with education innovations, whether it’s merit pay for teachers or charter schools. Charter schools now enroll close to half of D.C. students. After decades of declining student enrollment, the city’s public schools have seen eight straight years of growth. In the mid-2000s, the city began a spending blitz renovating long-neglected public school facilities, libraries, and recreation centers. There is also has a special program for at-risk children funneling more funds to schools with more children in poverty. And student achievement is finally trending in a positive direction: As low as the graduation rate may be, it is substantially higher than it was a few years ago. And between 2013 and 2015, D.C. saw the biggest gains in elementary test scores of any urban school district in the country.
Conclusion
The District does a lot for its low-income residents; the recent economic boom, combined with progressive income policies, has kept their incomes more stable than their counterparts in other cities. They can rely on a uniquely robust network of pro-poor programs, paid for by a growing tax base and thanks to the dedicated work of progressive advocates.