In recent years, researchers have become more interested in the ways that an individual’s environment shapes their ability to climb the socioeconomic ladder. In a famous recent study, Stanford economist Raj Chetty and his coauthors looked at upward mobility, as measured by the proportion of children who went on to make more money than their parents later in life. He found that the overall D.C. commuting zone[1] had high rates of upward mobility, ranking 13th in the 50 largest U.S. metro areas in upward mobility—and third in the probability that a child born in the poorest 20 percent of households in the 1980s made their way to the top 20 percent. However, in another study that looked at economic mobility at the county level, Chetty found that D.C. itself experiences some of the lowest economic mobility in the country.[2]
What do places with high levels of economic mobility have in common? Chetty and others found that high levels of racial diversity, low levels of income inequality, and high-quality primary education are all associated with higher levels of economic mobility, even after controlling for other factors such as tax rates, social capital, family structure, and labor market participation. The researchers found that the metropolitan D.C. area, which has higher overall levels of racial diversity, lower levels of racial segregation, and a strong middle class, experiences relatively high upward mobility among its lower-income residents compared to other large metropolitan areas.
D.C.’s level of income equality depends on how you measure it
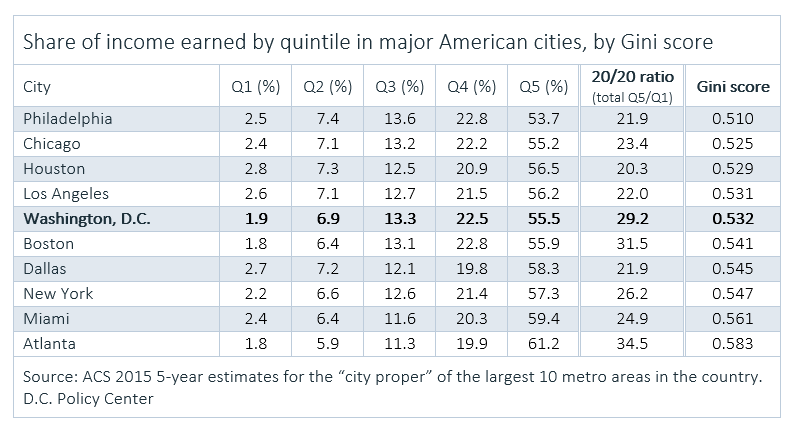
Given that income inequality is associated with mobility, it is important to consider the various methods of measuring inequality in D.C. One method, the 20/20 ratio, compares the proportion of income earned by the bottom 20 percent of earners relative to the top 20 percent of earners. When using this ratio, D.C. fares poorly compared with other major cities: The District’s bottom fifth earn only 1.9 percent of the total income earned, the third lowest income share among the largest American cities. [3] Meanwhile, its top fifth of earners take home 55.5 percent of the total income for the city.
As one climbs the income ladder, however, the Distric’s middle class preforms better than its counterparts, with the middle fifth (the 40-60 percent bracket of earners) takes home the second highest share of income behind Philadelphia. This suggests that the 20/20 ratio, though useful, may not fully capture the strength of the District’s middle income earners.
Another way to look at income inequality is the Gini coefficient (referred to here as the “Gini score”), a common measurement of inequality that considers the entire income distribution.[4] This measure provides a different picture of the District’s income inequality than the 20/20 ratio, as D.C.’s Gini score of 0.532 places it firmly in the middle of the 10 cities at the core of the largest metropolitan areas. Taken together, this suggests that while D.C. has quite a large gap between its very lowest earners and its very highest earners, its middle class is still quite strong compared with other major cities.
Diversity and inequality in D.C.: A closer look
The sections above show how D.C. stacks up compared with other major cities. But what about economic opportunity within D.C.? While we don’t currently have as much data about economic mobility at the neighborhood level, we can see how factors strongly associated with mobility—like diversity and inequality—may vary from one neighborhood to the next, and how they are distributed across the city.
Income inequality
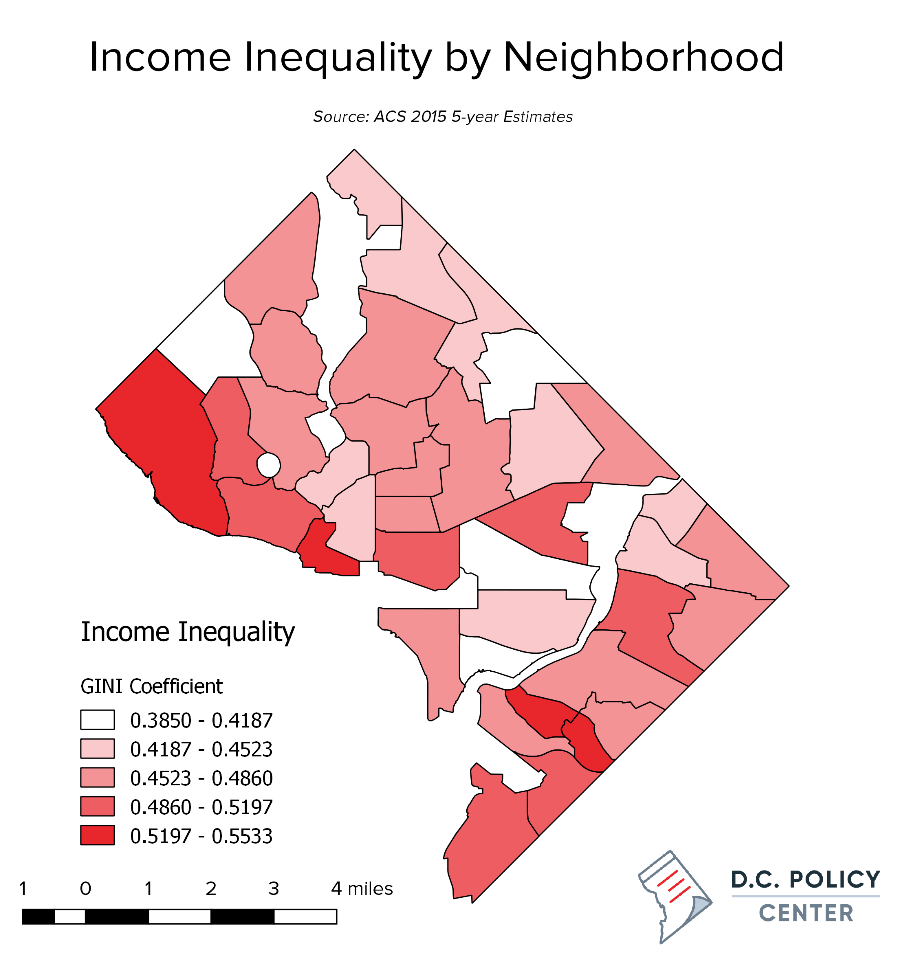
When we look at levels of income inequality across the District using the Gini score discussed earlier, concentrated areas of inequality do appear. As shown below, the neighborhood clusters with the lowest Gini scores (and therefore the lowest levels of income inequality) are Michigan Park/University Heights, Friendship Heights, Navy Yard, NoMa/H Street, and Fort Totten. The areas with the highest Gini scores are Foggy Bottom, the Palisades, Glover Park and Cathedral Heights, as well as Historic Anacostia and the neighborhood cluster including Woodland/Fort Stanton, Garfield Heights, and Knox Hill.
Racial diversity
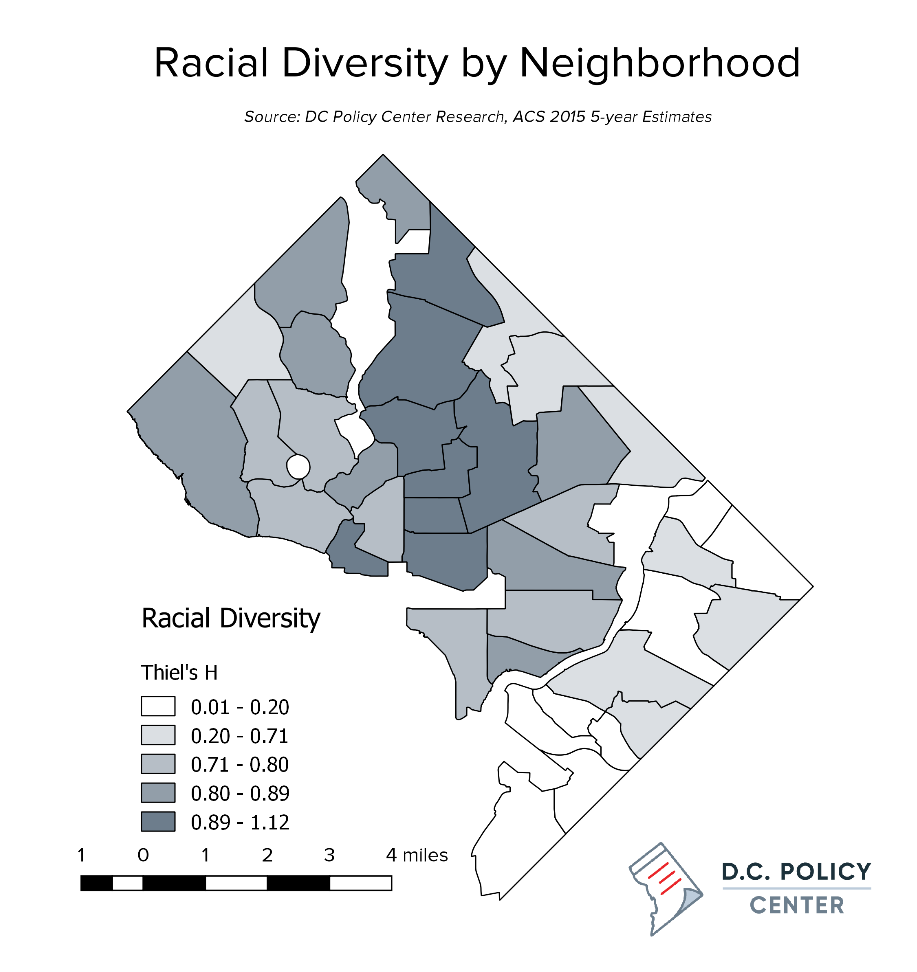
Similarly, racial diversity within neighborhoods varies widely. Here, we measure the level of racial diversity by our “entropy index,” also known as “Theil’s H”; this is a common measurement of diversity within a geographic region, where higher scores represent areas with greater levels of racial diversity. [5] As shown in the following map, the lowest levels of racial diversity are found in many neighborhoods clusters east of the Anacostia, where black residents make up 95 percent or more of the population. Meanwhile, areas in the center and northern parts of the city have higher levels of diversity, with Columbia Heights reporting the highest levels of racial diversity in the District.
Which neighborhoods have characteristics associated with higher levels of economic mobility?
Considering the relationship Chetty found between economic mobility and factors like racial diversity and mixed-income neighborhoods, we might expect to see more economic mobility in neighborhoods such as Columbia Heights, Shaw, and the H Street/NoMa area, which are more racially diverse and mixed-income compared to the rest of the city. The neighborhoods in which we might expect to see lower rates of economic mobility are those that are less diverse and have greater income inequality. These include the very low-income, highly segregated neighborhoods of Kenilworth, Benning, and Congress Heights east of the Anacostia River, and the high-income, mostly white neighborhood clusters in Northwest.[6]
When considering income inequality in the District, it’s true that our middle class is relatively strong compared with many other major cities—but also important to remember that our bottom 20 percent of earners are substantially poorer than the rest of the country. Factoring in higher costs of living, and disproportionate tax burdens, our bottom earners appear to be struggling more than a Gini coefficient would be able to indicate. Further, while D.C. sees relatively high levels of economic mobility in its broader metropolitan area, it struggles to provide a fluid economic ladder in the borders relative to other counties in the United States. Within D.C., it’s possible that children born in low-income households may experience better socio-economic outcomes in certain neighborhoods that boast both high levels of racial diversity and low levels of income inequality; further research is needed to understand how D.C. can maximize economic opportunity for all of its residents.