
On the surface, the District’s startup scene appears to be more lively than ever before. The city has received numerous accolades from the Washington Post and WAMU to VentureBeat and Entrepreneur for fostering a vibrant startup ecosystem that is both supportive and diverse, making it a popular destination for determined entrepreneurs looking to set up shop. Pulling back, however, we see that the jump in startup activity in the District has been driven by only handful of industries, primarily those in accommodation and food services. Startups in other industries, including those heavily concentrated in the region (e.g. Professional, Scientific, and Technical Services), are lagging behind their counterparts around the rest of the country.
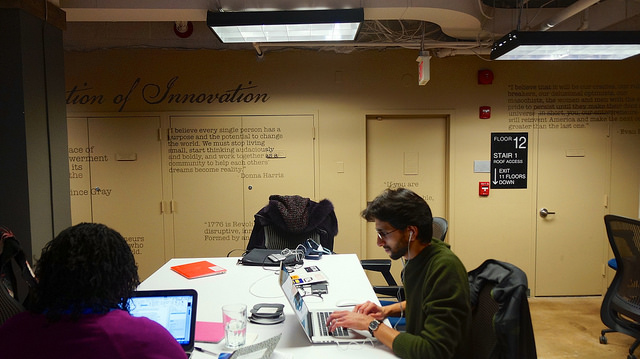
Startup incubator 1776. (Photo by Ted Eytan)
This article explores the current startup landscape in Washington, D.C., including the sectors in which startups are making the most gains, and those in which they are not. Using data from the U.S. Census Bureau and the Bureau of Labor Statistics, I find that while the overall rate of entrepreneurial activity in the District has remained relatively steady in recent years, startups in certain sectors have made relatively faster gains than others. In particular, accommodation and food startups in the District, as well as those in manufacturing, retail trade and wholesale trade, are advancing at a faster pace than the national average. On the other hand, our strongest industries (i.e. those with the largest shares of employment—such as professional and scientific services, administrative support, and education and healthcare—continue to be dominated by established giants rather than making room for entrepreneurial ambitions.
The District’s startup landscape
Most people probably equate “start-ups” with technology-related businesses, but tech start-ups are only one part of the picture. On average, about 950 startups were established in the District in each quarter of 2016, generating more than 17,000 jobs by the end of the year. Figure 1 (below) compares the startup establishment rates for Washington, D.C. and the United States as a whole from 2007 to 2016, using data from the Business Employment Dynamics from the Bureau of Labor Statistics (BLS). The “startup establishment rate” is the percentage of private-sector establishment births, defined by the BLS as the moment when a business establishment hires at least one employee for the first time.
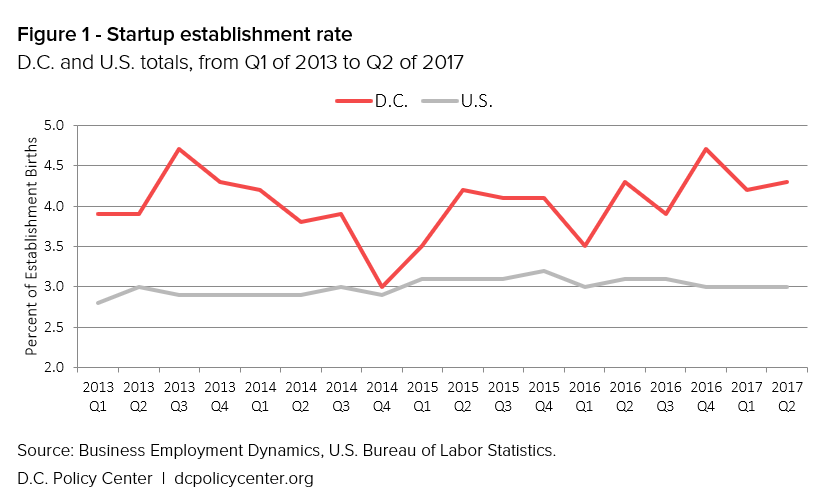
In 2016, on average, 4 out of every 100 private-sector establishments in the District were startup firms less than a year old with at least one employee, compared to the national average of 3 out of 100. Following a dip in the fourth quarter of 2014 that brought the District’s startup rate to just 0.1 above the national average, the rate has been slowing moving up to reach its pre-2014 levels.
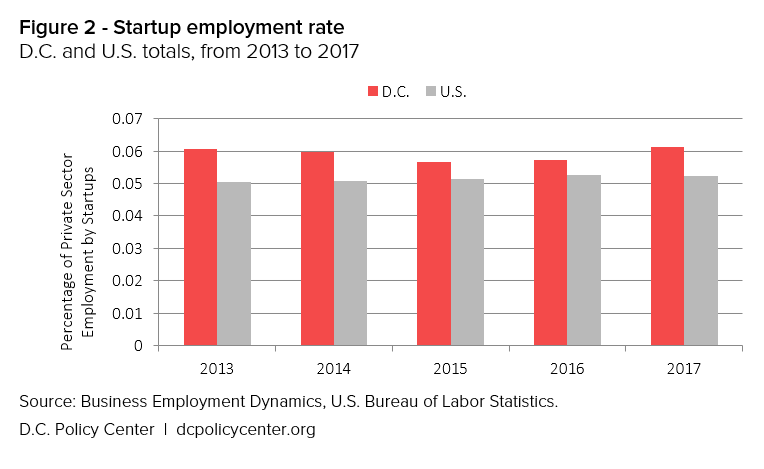
While establishment births can tell us about the number of entrepreneurial endeavors taken, they reveal nothing about the employment impact of startups. Figure 2 (below) illustrates the Annual Startup Employment Rate for the District. Startup employment rate is calculated as the percentage of total employment gains by businesses that are 1 year or younger. In 2017, 6 out of every 100 employments gained were by startups 1 year-old or younger. This number has remained above the national average since 2013, despite taking a slight dip in 2015.
Business sectors and job creation
Next, I take a deeper dive into the sectors where startups are creating the highest proportion of jobs. Figure 3 (below) illustrates jobs created in the District by NAIC sector in an average quarter in 2016, ordered by the total number of jobs created. The sectors topping the list—such as Professional, Scientific, and Technical Services, Other Services (e.g. personal services, lobbying, associations, etc.), and Accommodation and Food Services—reflect the District’s key sectors with the highest shares of employment.
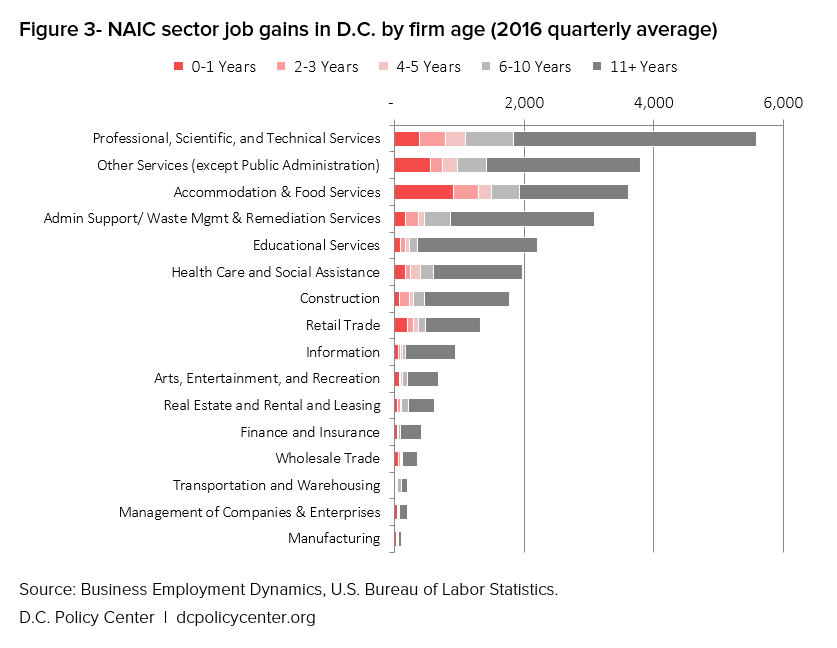
However, the strongest sectors in the city are not necessarily those in which startups are making the most gains. For instance, as Figure 4 (below) shows, only 7 percent of all jobs created in the Professional, Scientific, and Technical Services sector—our strongest sector by overall employment—were created by startup firms, compared to the national average of about 13 percent. In fact, D.C. startups other than those in the Accommodation and Food sector created lower shares of jobs compared to the national average in their respective sectors.
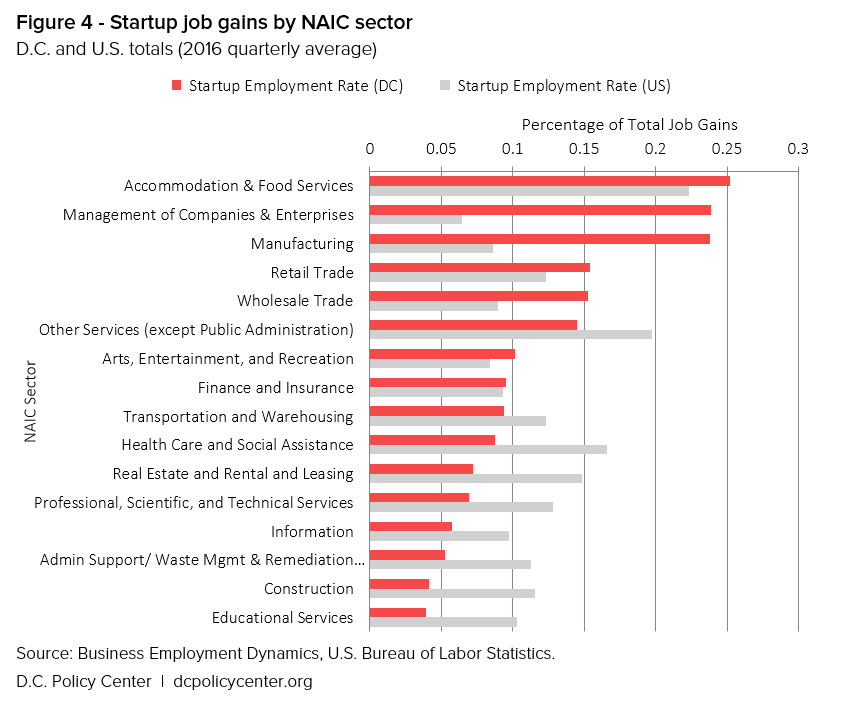
In 2016, around 14 percent of jobs gained by the Other Services sector each quarter were created by startups, 5 percentage points lower than the national average. Similarly, D.C. startups in sectors such as Administration Support, Waste Management, and Remediation Services, Education Services, and Healthcare and Social Assistance all created smaller proportions of jobs relative to the national average.
One reason for the lack of startup success in some of our strongest industries could be market concentration—when the majority of the market is dominated by a few players. For example, the Professional, Scientific, and Technical Services sector (one of the District’s strongest sectors) is locked up by a small number of firms. Between 2014 and 2015, job postings for this sector grew at a faster rate than any other sector in the region, however, nearly 30 percent of the growth in job postings was driven by just 10 employers within the sector—all of which are well-known federal contractors such as Deloitte, Booz Allen Hamilton, and Engility.
Which sectors are startups making the most gains in terms of job creations? As Figure 4 illustrates, Accommodation and Food startups takes the win for creating the highest share of sectoral jobs, followed by those in Management of Companies and Enterprises, Manufacturing, Retail Trade, and Wholesale Trade sectors.
Accommodation and Food Services
In 2016, District startups within the Accommodation & Food Services sector created on average over 25 percent of all new job within the sector each quarter. Typically, firms within the Accommodation and Food Services sector provide customers with lodging and/or meals, snacks, and beverages for immediate consumption. They include hotels and recreational facilities, as well as full-service restaurants, food trucks, bars, catering companies and other food service providers.
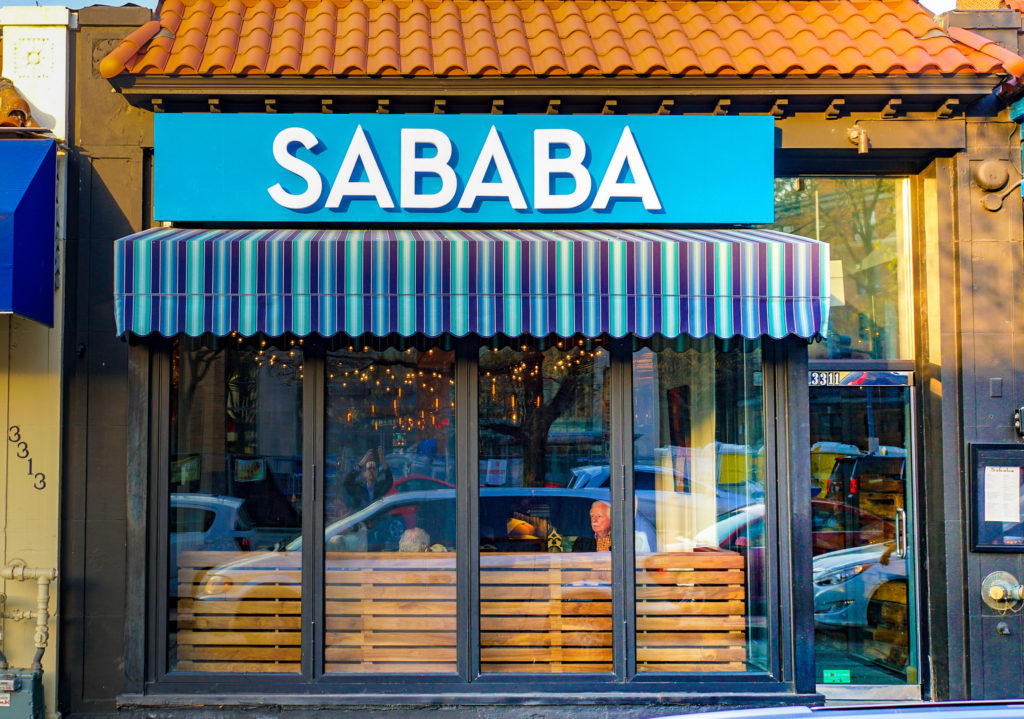
Sababa Restaurant, which opened earlier this year in Cleveland Park. (Photo by Ted Eytan)
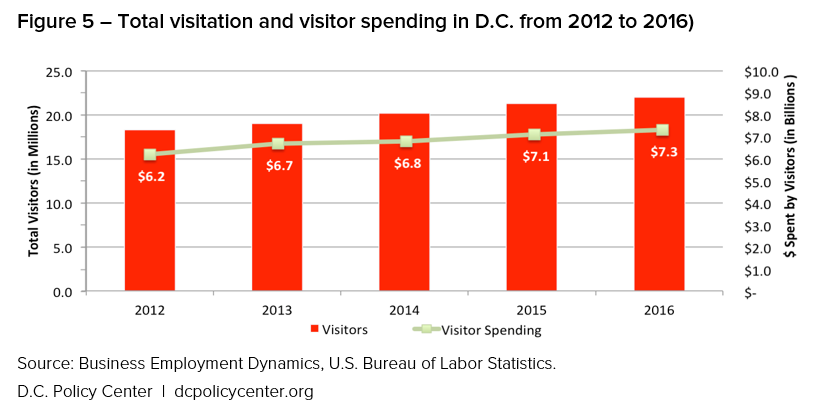
Several factors may be driving startup success within this sector. For starters, the continuous increase of tourists visiting the District (22 million visitors in 2016 compared to 18.3 million in 2012) has fueled the overall growth in the sector in recent years. In 2016 alone, tourists spent over $7 billions during their visit in the city, 63 percent of which was spent on lodging and food and beverage services. Figure 5 (below) illustrates recent trends in District tourism, including total visits and overall visitor spending, from 2012 to 2016.
Moreover, the District has also created an environment that is especially welcoming to food & hospitality entrepreneurs, who benefits from a multitude of food-focused accelerators and incubators, such as Mess Hall, Union Kitchen, Tastemakers, Eatsplace, and Tastelab; and the DC Food Policy Council, which is dedicated to identifying regulatory burdens on the local food businesses and entrepreneurs. It’s no wonder the number and variety of eating places—including healthy eating concepts, fast-casual options, food halls, and artisanal foods—have surged over the last five years.
Management of Companies and Enterprises
In each quarter of 2016, local startups in the Management of Companies and Enterprises sector created nearly a quarter of all new jobs within the sector, on average. Nationally, the startup share of jobs created in this sector is just over 6 percent. Given that the majority of D.C. establishments in this sector have historically been corporate and regional management offices, a large chunk of the jobs created by “startups” in the sector could simply reflect the opening of new headquarters and regional offices of already established firms.
Manufacturing
Manufacturing has never been a strong suit of the District’s economy. In 2016, the Manufacturing sector created just over 100 jobs each quarter on average. Yet, nearly a quarter of those jobs were created by startup firms, mostly by those tied to food manufacturing such as bakeries and breweries.
Retail Trade and Wholesale Trade
Retail Trade and Wholesale Trade are both important sectors in the District’s economy. While big-box retailers such as Target and Wal-Mart have grown to become some of the largest employers in the sector, increasing interest in niche independent stores and locally owned retailers and producers have created new opportunities for retail and wholesale entrepreneurs in the District. On average, startups in both retail and wholesale trade sectors created over 15 percent of all new jobs each quarter in 2016.
About the data
Data points cited in this article and in charts were based on calculations made using Business Employment Dynamics statistics, from the U.S. Bureau of Labor Statistics, for Washington, D.C. and the United States as a whole from 2007 to 2016. The “startup establishment rate” is the percentage of private-sector establishment births, defined by the BLS as the moment when a business establishment hires at least one employee for the first time.
Read more: D.C.’s Startup Scene, Part II: Opportunity Costs
Feature photo by Ted Eytan (Source)
D.C. Policy Center FellowShirin Arslan is an economist who specializes in gender analysis in economics and workers’ economic security. She holds a master’s degree in economics from American University and B.A. in Economics from Virginia Commonwealth University. Learn more about her work at shirinarslan.com.