
Previously, in D.C.’s Startup Scene, I examined employment gains made by District startups[1] across industry sectors. I found that on average, startups in certain sectors—such as Accommodation and Food, Retail, and Wholesale Trade—were making relatively faster gains in employment compared to more established firms. However, startups within some of D.C.’s strongest industries—like Professional, Scientific, and Technical Services; Educational Services; and Health Care and Social Assistance—had employment rates half that of the national average for startups.
In this article, I dig deeper by examining one potential barrier that may be in the way of startup employment gains—namely, the difference in wages offered by startup firms less than one year old and established firms that are 11 years or older. To do this, I use data from the U.S. Census Bureau’s 2016 Quarterly Workforce Indicator to calculate the startup pay gap—which captures the difference between average monthly salaries paid at startups and established firms—for selected sectors in D.C., San Francisco, Boston, and Seattle. I also look at startup pay gaps across different age groups of workers. Selected age groups include early-career workers (ages 25-34), peak-career workers (35-44), and mid-career workers (45-54).[2] Taken together, this will show which industry sectors appear to have the best average returns for workers who shift from established companies to startups, and how the labor market in D.C. compares with other startup hubs.
Startup pay gap can shed light on the opportunity cost workers face when choosing to work for a startup rather than an established firm, with larger gaps signal higher levels of wages forgone when such choices are made. By this measure, my analysis finds that D.C.’s startup workers in the Health Care and Social Assistance sector face smaller relative opportunity costs than their San Francisco, Boston, and Seattle counterparts. However, D.C. startup workers face larger potential trade-offs in The Professional Services, Accommodation and Food, Retail Trade, and Wholesale Trade sectors compared with those other cities.
Across selected sectors in each city, the startup pay gap fluctuates depending on worker age group. Among selected sectors, the startup pay gap is the narrowest for early-career workers in Education, Retail Trade, Accommodation, and Wholesale Trade sectors. Peak-career workers (35-44) in D.C. face the narrowest pay gap in Health Care and Social Assistance, while the gap in professional services sector progressively narrows as we move up worker age groups.
Startup salary gaps in D.C. compared with other jurisdictions
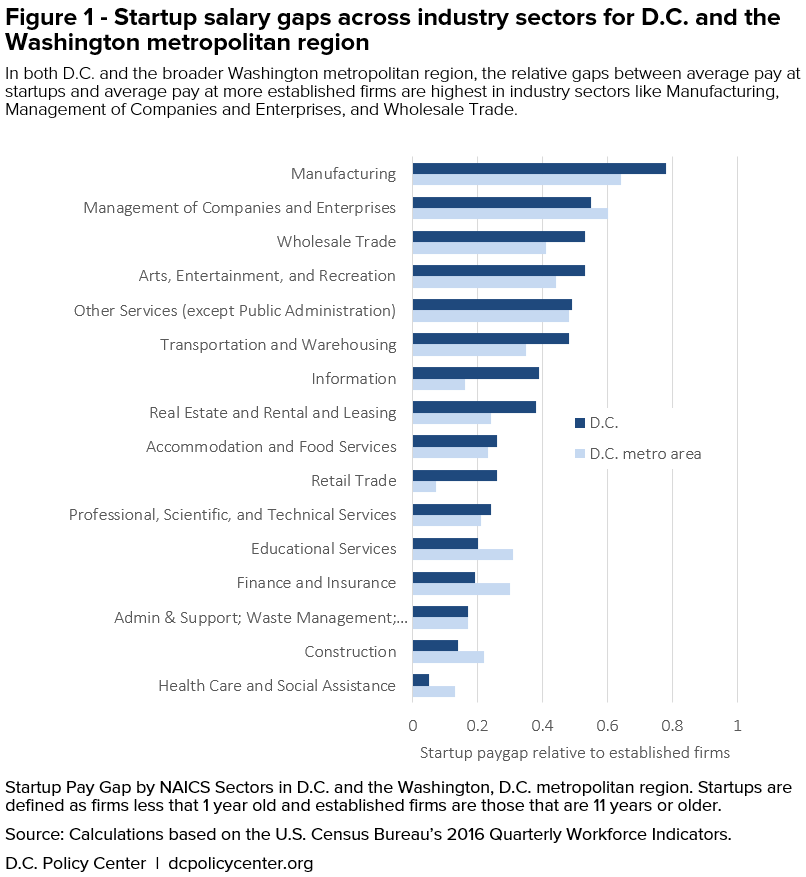
Drawing on data from the U.S. Census Bureau, Quarterly Workforce Indicators (QWI) for 2016, I analyzed the average monthly salaries paid by D.C. startups as compared to their established counterparts across NAICS industries, in D.C. and the broader metro area. (Startups are defined as companies less than a year old, while established firms are those 11 years or older.)
Figure 1 lists startup pay gaps across selected NAICS sectors in the District and on a Metropolitan level. The gaps are wider in the District than on the metro-level in all but 5 NAICS sectors: Health Care and Social Assistance, Construction, Administrative Services, Finance and Insurance, Educational Services, and Management of Companies and Enterprises. The largest differences in District- and metro-level pay gaps can be observed in Information and Retail Trade sectors.
I also examined how these relative pay gaps compare with those in comparable cities like San Francisco, Boston, and Seattle—jurisdictions that also have similar workforce compositions and income population trends. As Figure 2 illustrates, the startup pay gap in the Health Care sector was much larger in San Francisco (0.56), Boston (0.56), and Seattle (0.31) compared with D.C. (0.05).
Both in the District and across the D.C. metropolitan area, startup workers in Health Care and Social Assistance face the narrowest pay gap compared to startup workers in other sectors – at 0.05. In this sector, startup employees earned 95 percent of the wages earned by employees at established firms in D.C. This signals not only a strong demand for qualified workers by startups within this sector, but also their funding capacity to do so. Services provided in this sector are typically delivered professionally trained health practitioners and social workers with requisite expertise.

On the other hand, startup workers in D.C. faced wider pay gaps in Professional Services, Accommodation and Food Services, and Wholesale sectors than their counterparts in San Francisco, Boston, and Seattle. On average, D.C. startups in the Accommodation and Food Services sector created over 25 percent of all new job within the sector in each quarter of 2016, while startups in both Retail and Wholesale Trade sectors created over 15 percent of all new jobs each quarter in 2016.
Seattle startups took the lead in the Professional Services and Accommodation sectors, where startup pay gaps averaging 0.07 and 0.11. Startup pay gap in Retail was narrowest in Boston (-0.09), where startup employees on average earned 109 percent of the wages earned by employees at established firms.
Next, I’ll break down the pay gap further for three groups of workers: early-career workers ages 25-34; peak-career workers ages 35-44; and mid-career workers ages 45-54.
Early-Career Workers
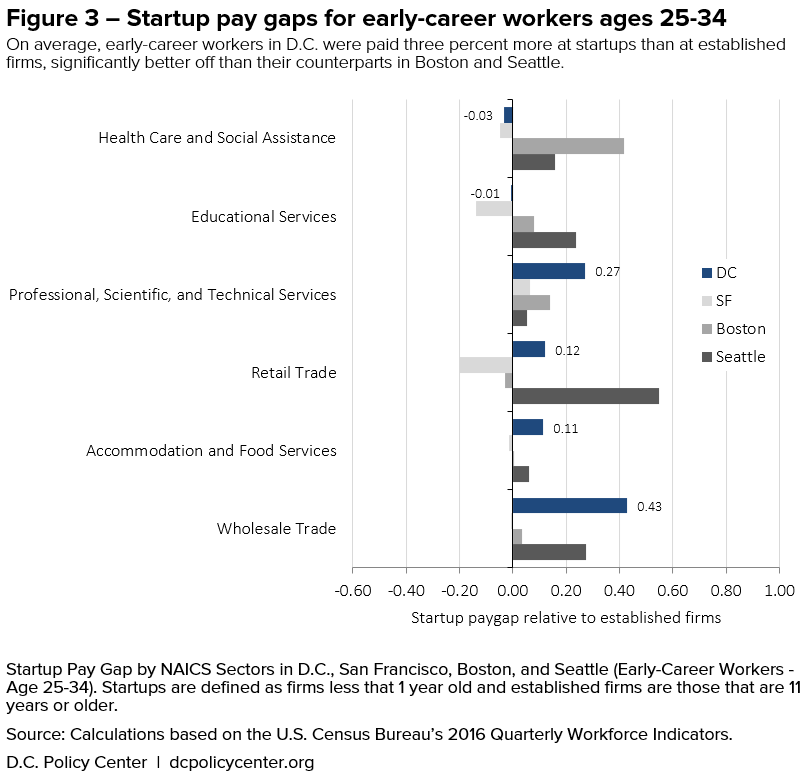
The negative pay gap value of -0.03 in D.C.’s Health Care and Social Assistance sector indicates that on average, early-career workers ages 25 to 34 were paid 3 percent more at startups than at established firms, significantly better off than their counterparts in Boston and Seattle. Similarly, early-career workers in D.C.’s Education sector faced a startup pay gap of -0.01, smaller than the gap of 0.08 and 0.23 observed in Boston and Seattle, but larger than the startup pay gap of -0.14 in San Francisco.
Relative to those in San Francisco, Boston, and Seattle, D.C.’s early-career workers faced large startup pay gaps in Professional Services (0.27), Accommodation and Food (0.11) and Wholesale Trade sectors (0.43). Seattle takes the lead in offering the most comparable startup pay in Professional Services (0.05), while San Francisco startups in both Accommodation and Wholesale sectors offered average wages on par with established firms.
Peak-Career Workers
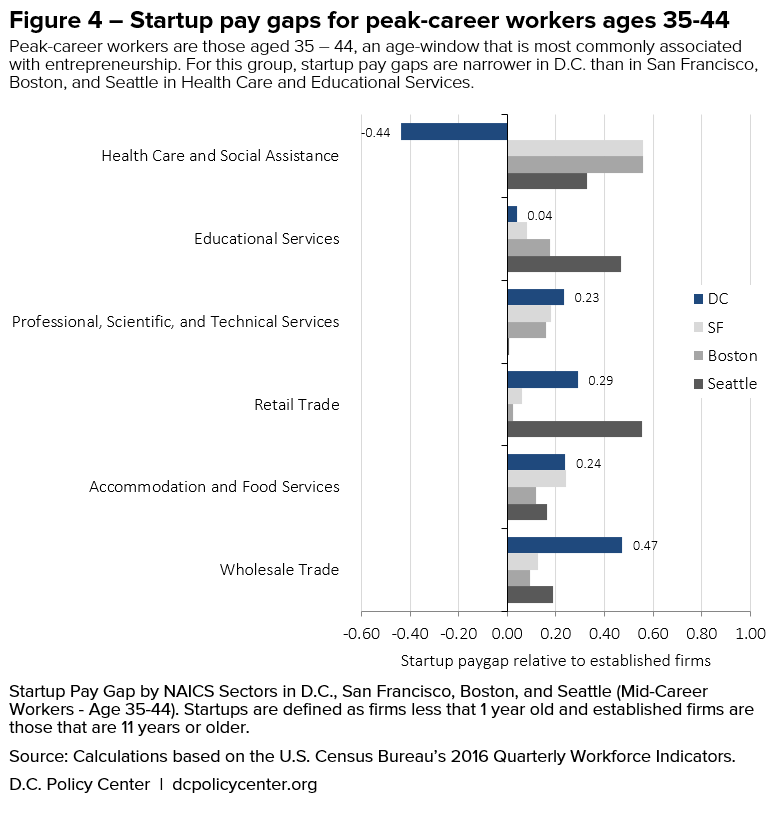
Peak-career workers are those aged 35 – 44, an age-window that is most commonly associated with entrepreneurship. For this group, startup pay gaps are narrower in D.C. than in San Francisco, Boston, and Seattle in two sectors: Health Care and Educational Services.
In 2016, peak-career workers in D.C.’s Health Care and Social Assistance startups earned average salaries 144 percent of those received by their counterparts in established firms. D.C.’s Education startups also outperformed their peers in San Francisco, Boston, and Seattle in paying comparable wages (96 percent of wages at established firms) to their peak-career workers.
Compared to other cities, peak-career workers in D.C. faced relatively wider pay gaps in Professional Services (0.23), Accommodation and Food (0.24), and Wholesale Trade (0.47) sectors for this group of workers. However, the pay gap in Professional Services sector is slightly narrower for this group of workers (0.23) than their early-career counterparts (0.27).
Mid-Career Workers
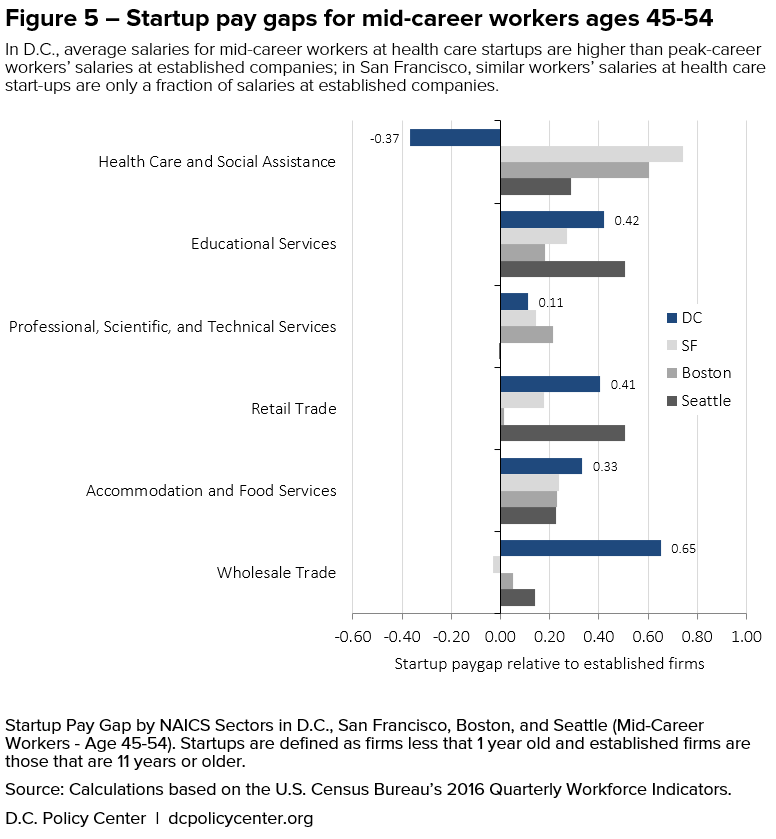
Compared to their younger counterparts, D.C.’s mid-career workers face the lowest startup pay gap in the Professional and Scientific Services sector. In fact, the startup pay gap in this sector progressively narrows as we move up worker age groups in D.C. – 0.27 for early-career workers, 0.23 for peak-career workers, and 0.11 for mid-career workers. On the other hand, as we move from peak-career workers to mid-career workers in Health Care and Social Assistance, the startup pay gap widens (i.e. negative pay gap narrows), with the latter group facing a higher pay gap (-0.37) than their peak-career peers (-0.44). Nonetheless, mid-career workers in D.C.’s Health Care startups on average earned 137 percent of the wages offered by established firms in the sector, whereas their counterparts in San Francisco, Boston, and Seattle earned much less.
Healthcare startups in D.C. have the lowest pay gap, both across sectors and cities
Based on this analysis, it appears that D.C. workers in the Healthcare and Social Assistance sector face the lowest opportunity cost – at least in terms of average monthly salary – when switching from an established firm to a startup within the same sector. For peak-career workers, the switch to startups could actually result in a significantly higher monthly salary, on average. The same can not be said for peak-career workers in the Healthcare and Social Assistance sectors across San Francisco, Boston, or Seattle, where switching from an established firm to a startup can lead to a salary cut of 33 to 56 percent, on average.
On the other hand, workers in sectors such as Professional, Scientific and Technical Services, Accommodation and Food Services, and Wholesale Trade in D.C. could face a much higher opportunity cost when leaving their job at an established firm to join a startup. However, it is worth noting that the salary foregone when workers choose to work for a startup rather than an established firm (captured here using startup pay gap) is only one dimension of the overall opportunity cost; and that it may even be associated with considerable payoffs if or when the startups eventually become successful.
About the data
Average monthly earnings by firm and worker age were reported in the U.S. Census Bureau’s Center for Economic Studies via its Quarterly Workforce Indicators (QWI) dataset for 2016. Figures shown for all industries only represent private sector jobs. Sectors are defined by the North American Industry Classification System (NAICS) using the following industry codes: Healthcare and Social Assistance (62), Educational Services (61), Professional, Scientific and Technical Services (54), Retail Trade (44-45), Wholesale Trade (42), and Accommodations and Food Services (72).
I then used data on average monthly salaries in different industries (based on NAICS codes) to calculate the Startup pay gap, measured as 1 minus the ratio between average monthly salaries paid at startups (firms less that 1 year old) and established firms (11 years or older):
Startup pay gap = 1 – (Average Monthly Salary at Startups / Average Monthly Salary at Established Firms)
Next, I conducted this analysis for the selected sectors in D.C., San Francisco, Boston, and Seattle, across different age groups of workers: early-career workers (25-34), peak-career workers (35-44), and mid-career workers (45-54).
Due to data limitations, estimations of startup pay gap rely on average earnings rather than median earnings and do not control for worker-specific characteristics such as occupation, race, gender, among others.
Notes
[1] Startups are defined as firms less that 1 year old, and established firms are those that are 11 years or older.
[2] Due to data limitations, estimations of startup pay gap in the article rely on average earnings rather than median earnings and do not control for worker-specific characteristics such as occupation, race, gender, among others.
Feature photo by Ted Eytan (Source).
D.C. Policy Center Fellow Shirin Arslan is an economist who specializes in gender analysis in economics and workers’ economic security. She holds a master’s degree in economics from American University and B.A. in Economics from Virginia Commonwealth University. Learn more about her work at shirinarslan.com.