Burglary is often a crime people don’t think about until it happens to them. Jewelry, cash, and electronics are the high-value items that are most frequently targeted. However, these items are often not the biggest loss. It is a shattered sense of security, the thought that you may not be as safe in your own home as you once thought. Many burglary victims experience a range of emotions that are often only associated with violent crimes.
In D.C., burglary is defined using varying degrees of severity, and includes theft or intended theft in residential or commercial locations. Within Washington, D.C., 2,122 burglaries occurred in 2016. This is a ten-year low and 16.7 percent decrease from 2015. Examining the burglary rate, which takes into account D.C.’s expanding population, I found that the number of burglaries per 10,000 people is also at its lowest point in the past decade (31.2), down 17.8 percent from 2015.
Despite the decrease in burglary, it is still a crime felt personally by its victims. With this in mind, I wanted to analyze the spatial patterns of burglaries in 2016, identify where they occurred, what areas may be seeing significant increases or decreases, and explore if any identifiable variables may have influenced these trends.
Analysis
Plotting individual burglaries on a map gives us an overall picture of exactly where burglaries occurred in the District. However, individual point data can be difficult to interpret. At the same time, identifying trends and clusters is broad and doesn’t give us an accurate enough representation. To begin the analysis, I spatially joined individual burglaries to census tracts within the District. By joining the data to census tracts, this has the benefit of allowing for regression analysis with multiple demographic variables.
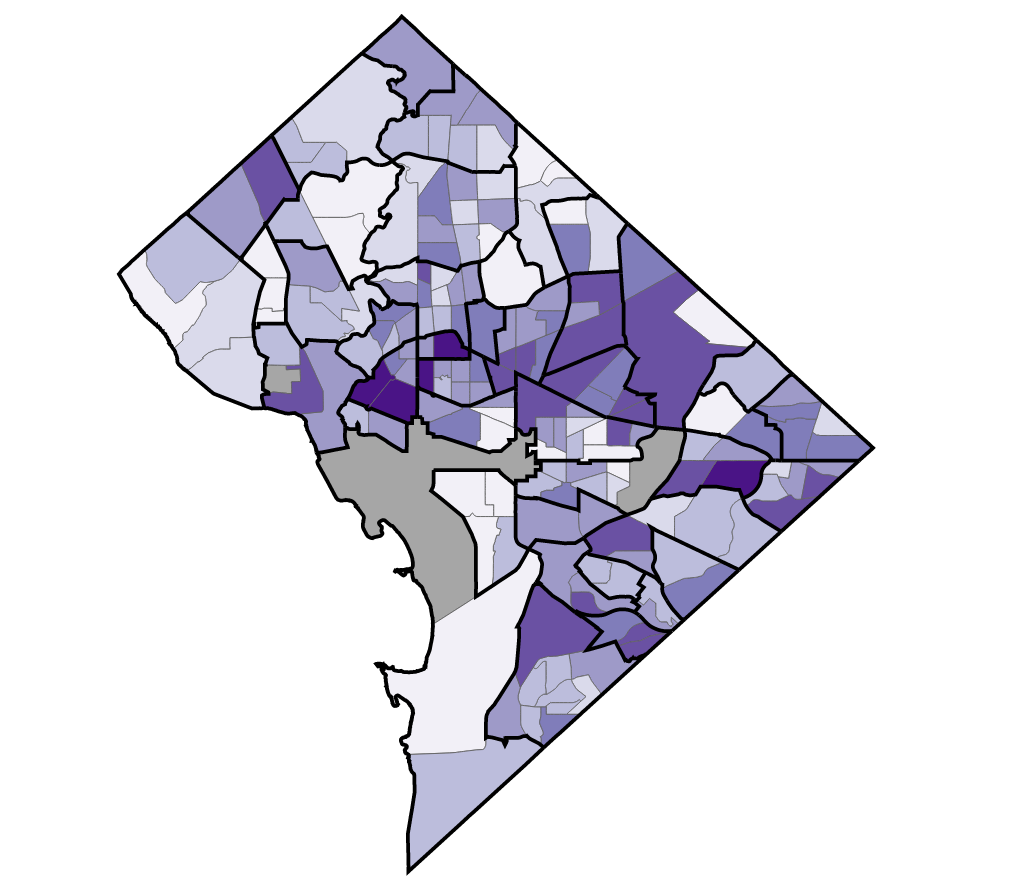
Where did burglaries occur?
With burglary counts aggregated to each census tract, we begin to see patterns appear on the map. The first thing that jumped out to myself was how widespread burglary is in the District. Every ward of the city and almost every census tract had a record of this crime. There are a few clusters that stand out for their high number of burglaries, however, including tracts south of Dupont Circle and Golden Triangle, tracts around Ivy City, and several tracts around Greenway and Fort Dupont.
Looking back to the 2015 data on burglary, we can get a sense if there have been any changes in the trends and clustering from one year to the next. Similar to 2016, burglary was a District-wide occurrence. Unlike in 2016, there were noticeable clusters in varied geographic areas. There is a distinct concentration in both Wards 5 and 7—a visible high incident cluster that we didn’t see in 2016, were burglary seems to be more evenly spread.
In an effort to visualize how burglaries may have shifted during the year, I calculated percent change in burglary by census tract to illuminate those trends. The first observation that I notice is the increase in the total number of burglaries in neighborhoods such as Spring Valley, Palisades, and Woodley Park. However, the overall number of burglaries is still relatively low. For instance, Woodley Park saw only 13 burglaries in 2016 while Fort Dupont had 43 burglaries occur. In contrast, neighborhoods such as Barry Farms, Woodland, and Garfield Heights saw decreases in the number of burglaries.
When did burglaries occur?
Breaking down burglaries temporally aids in answering when burglaries occurred throughout the District in 2016. The time heat map below breaks down burglaries by day of the week and hour of the day. Burglaries occurred in all hours of the day and week. However, there was a clear uptick in burglary between 9 a.m. and 10 p.m. We can see other noticeable patterns of burglaries occurring in the middle of the day, at 1 p.m., and in the evening, from 6 p.m. to 10 p.m.
Exploring the 2015 data temporally didn’t yield as many differences as we observed spatially. We can see a general uptick starting around 9 a.m. and dropping after 10 p.m.
Why did burglaries occur?
To gain a better understanding on why burglaries are occurring more frequently in certain geographic areas and not others, I ran a regression analysis. I set the dependent variable as the rate of burglaries per 10,000 households for each census tract. Loading over 110 social and economic factors, I was able to devise a best-fit model, identifying six explanatory factors.
The regression model identified these demographics to be the most important:
- Percentage of population that are in the age group 30-34 years old,
- Percentage of population that are in the age group 65-69 years old,
- Percentage of the population that have some college,
- Percentage of the population that retain a bachelor’s degree,
- Percentage of the population that receive SNAP benefits, and
- the total number of married family households.
This yielded an R2 of 0.28. While this R2 is low, it is still a valuable indicator in explaining criminal activities. It does tell us that 28 percent of the variation in burglaries is can be explained by these factors, but also, other forces can likely better explain the variance in where and why this type of crime occurs. For instance, a graduate thesis from Embry-Riddle Aeronautical University investigated factors associated with burglary, and found that burglary hotspots, geographic areas where burglaries occur frequently, are highly influenced by three things: The presence of law enforcement, distances associated with a target property (burglars often strike close to their home), and opportunity to commit the offense. Other research has found homes that are unoccupied relatively often and abundance of access and escape routes can be potential influencers of burglary in an area.
The Data
Data for the demographic model used was obtained from the U.S. Census Bureau’s American Community Survey from 2015. The demographic model was filtered to exclude census tracts with fewer than 100 households. Crime datasets were obtained from D.C. Open Data, 2016. Visit my GitHub page for code used in each visual.